Showing 12 results

Soil Horizon Profile Builder
Visual builder examining the 6 distinct soil horizons (O, A, E, B, C, R) identifying organic aggregation, topsoil leaching, and bedrock breakdown.

Tragedy of the Commons
Economic game theory simulator demonstrating the Tragedy of the Commons via a multi-turn global fishery model against AI fleets.
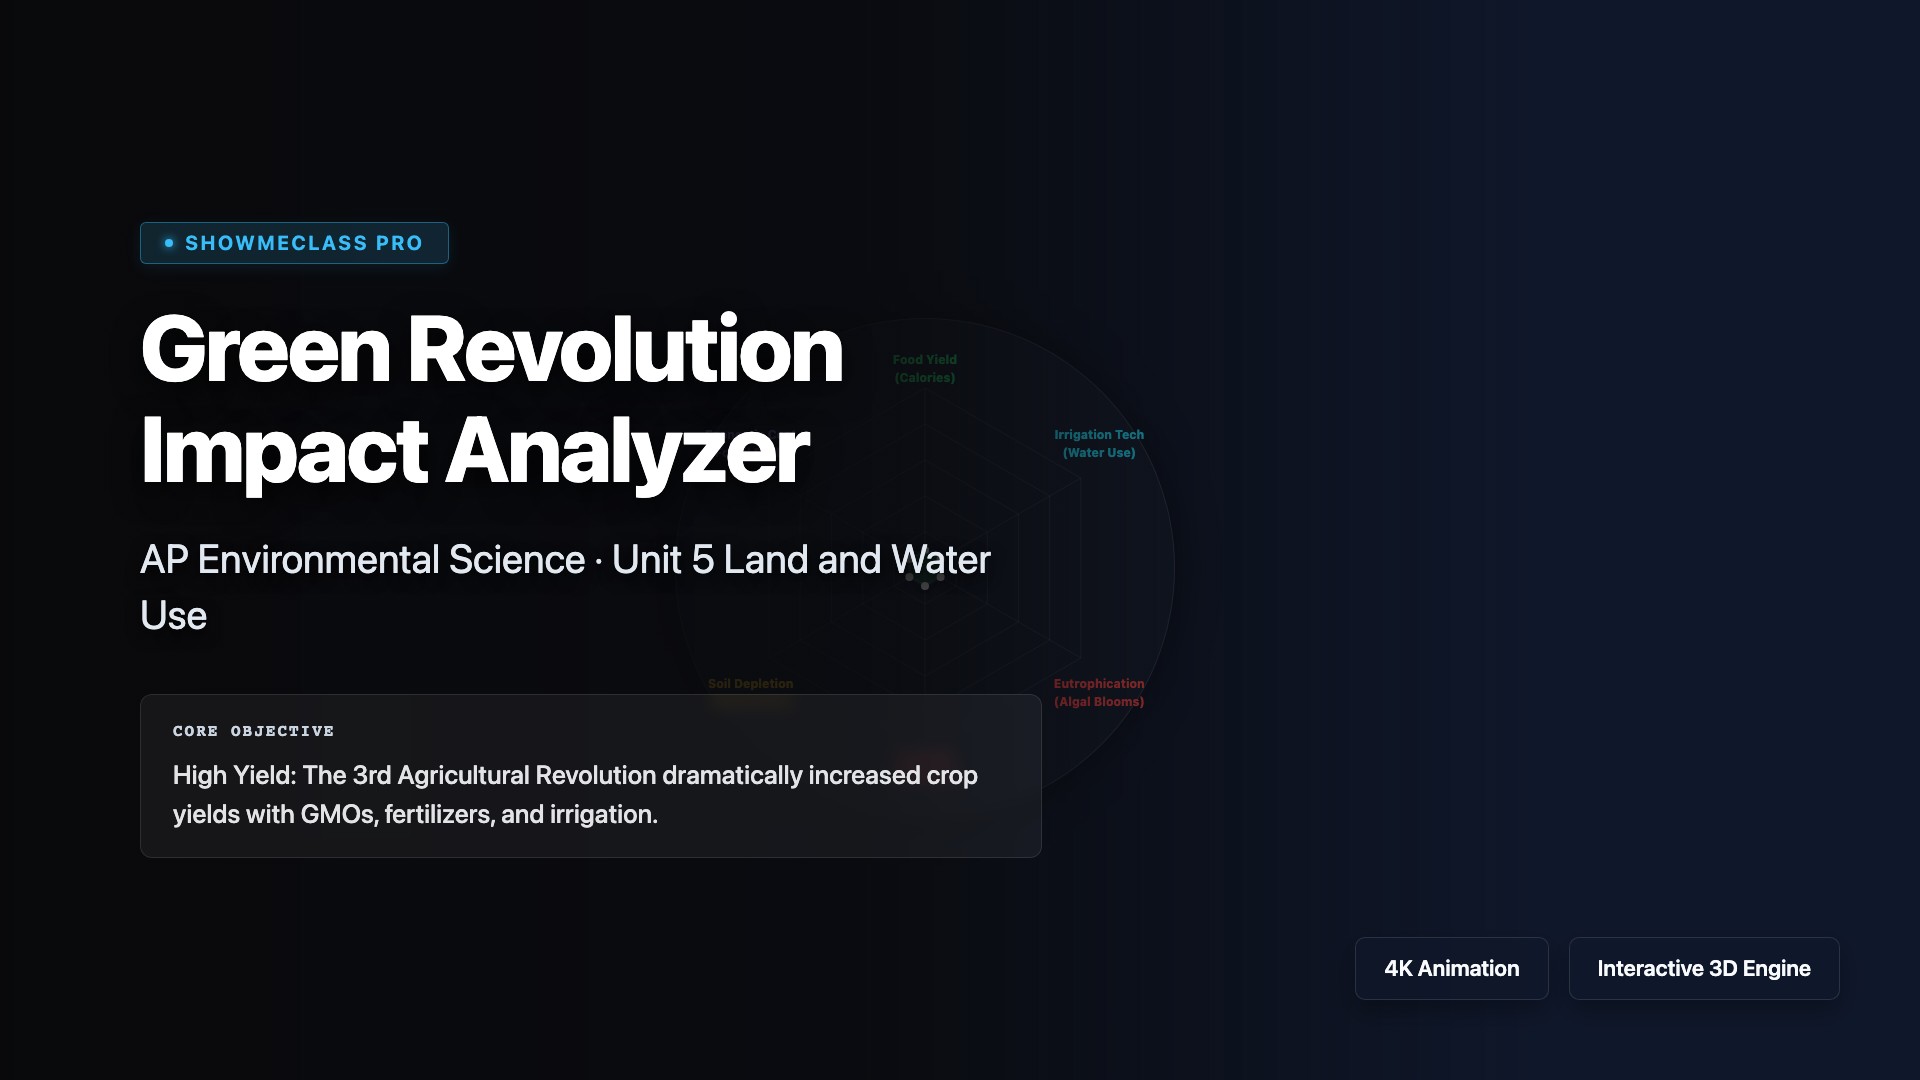
Green Revolution Impact Analyzer
Radar chart interactive exploring the trade-offs of the Green Revolution: drastically boosting yield via fertilizers and irrigation while risking eutrophication and salinization.
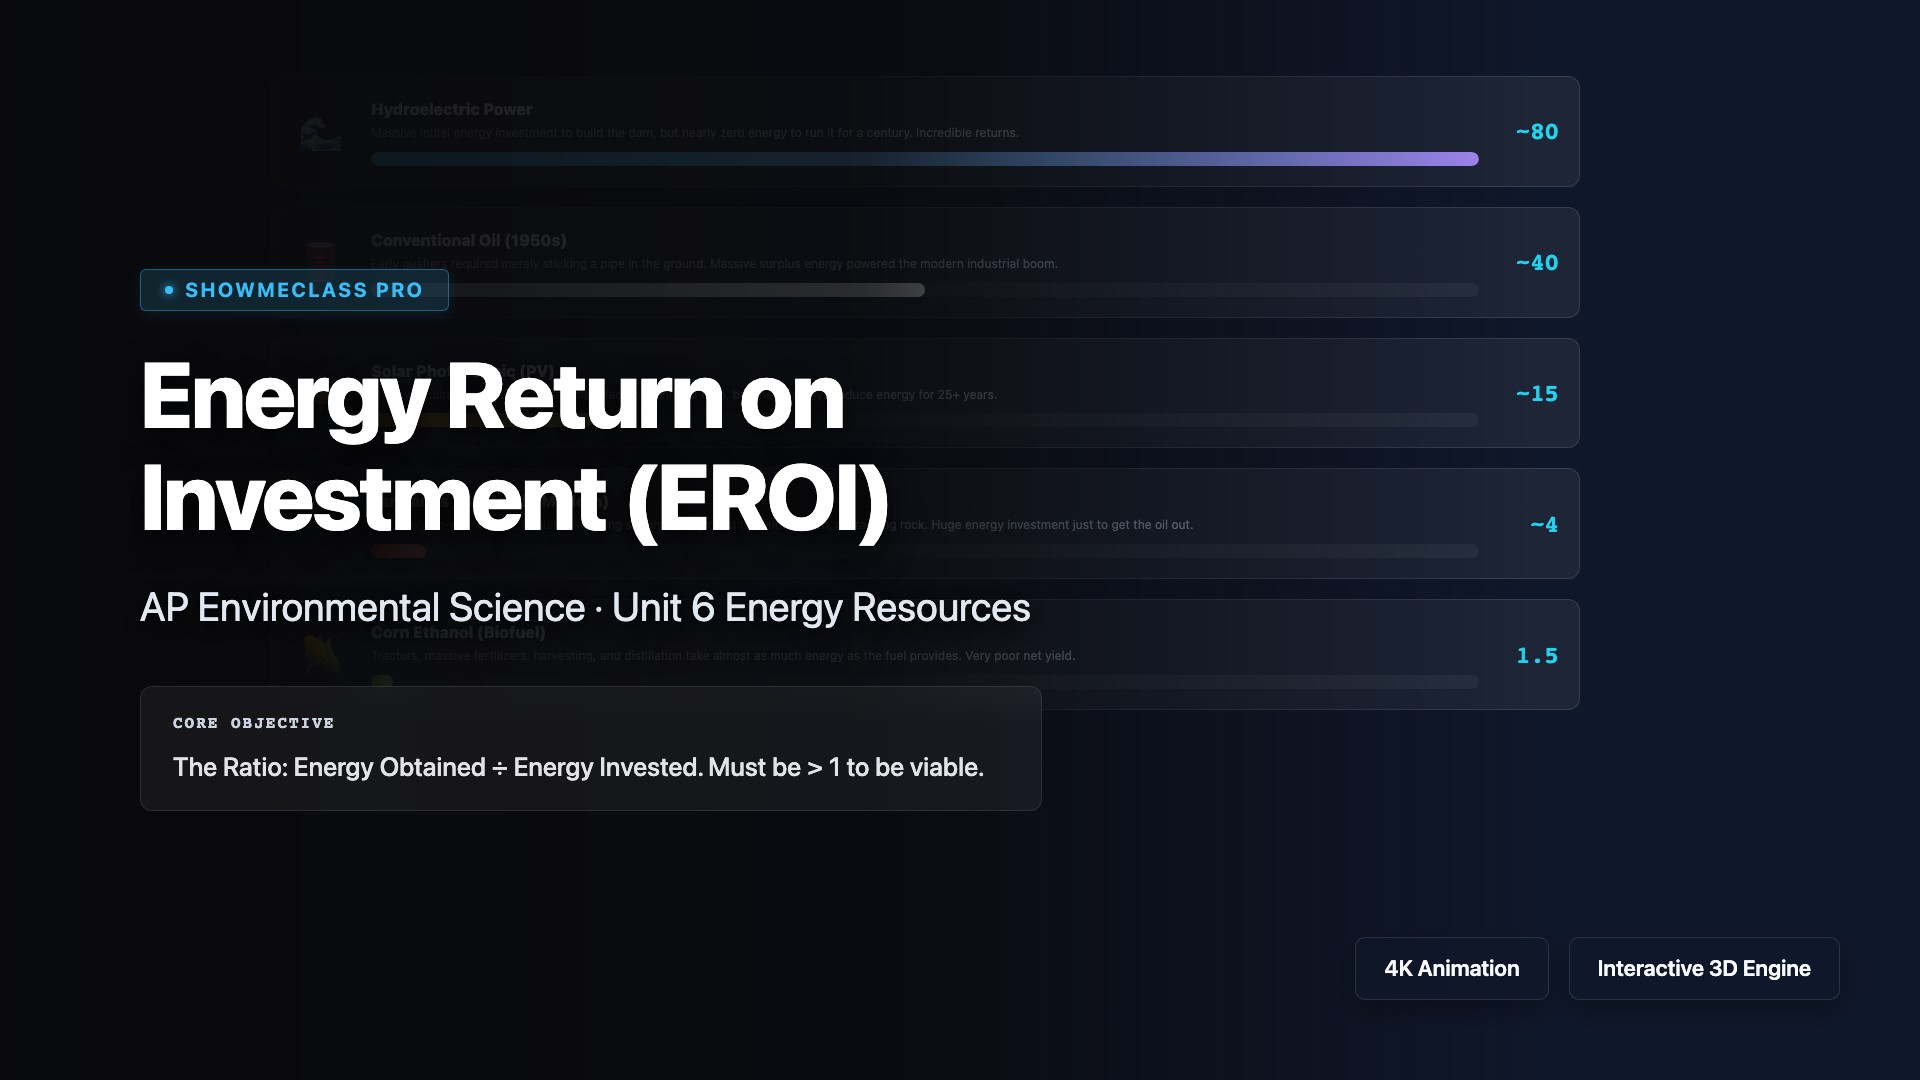
EROI Energy Return
Comparator for Energy Return on Investment (EROI), mapping the high yields of early oil and hydro against the modern low-yield reality of tar sands and corn ethanol.

Turbine Systems: Hydro & Geothermal
Comparison of the ubiquitous turbine-generator electrical system, modeled for Gravity/Kinetic generation (Hydroelectric dam) and Heat/Steam generation (Geothermal mapping).

Photochemical Smog Formation
Interactive diurnal cycle simulator mapping the timing offset between morning commuter NOx emissions and peak afternoon photochemcial ozone formation.
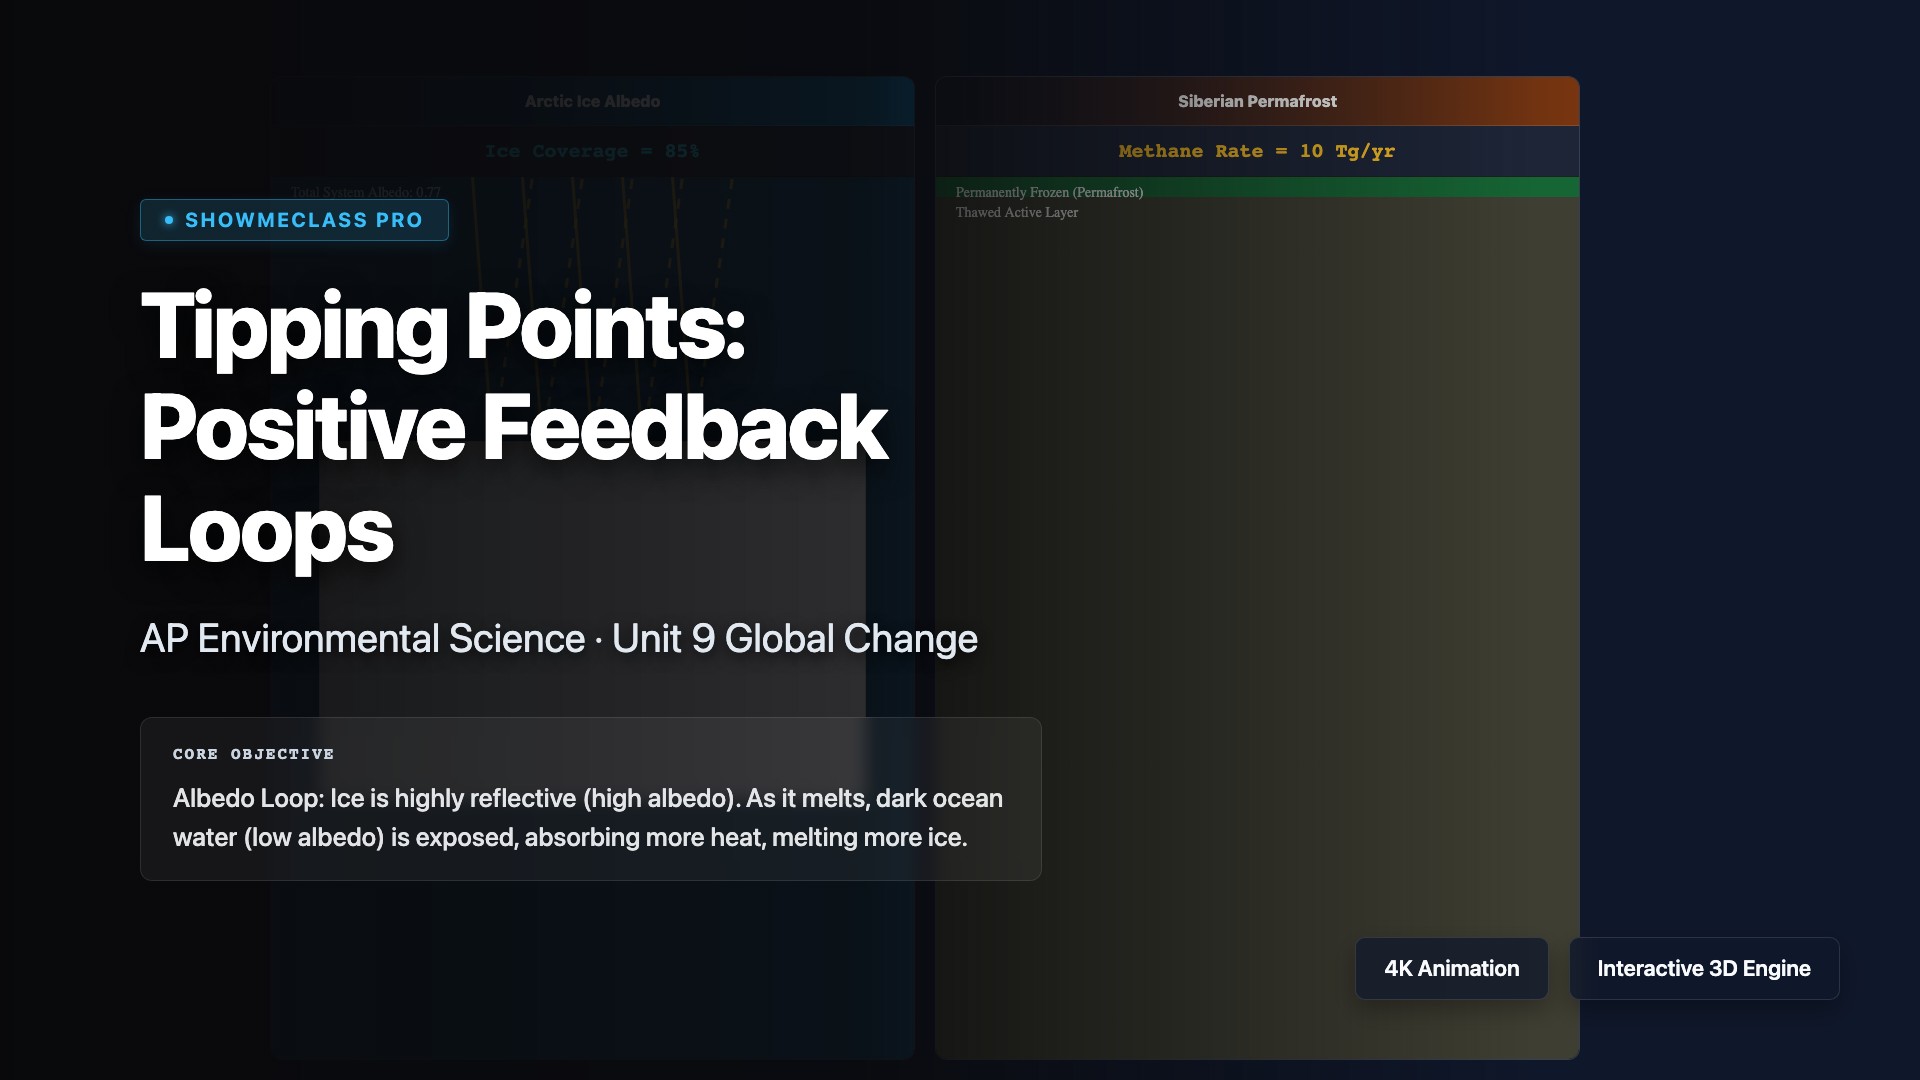
Tipping Points: Positive Feedback Loops
Dual-simulator visualizing physical positive climate tipping points: the exponential loss of sea-ice reflectivity (Albedo) alongside explosive methane expulsion from thawing Siberian permafrost.

Ocean Acidification Impacts
Chemistry visualization of oceanic CO2 absorption forming Carbonic Acid. Tracks the precise mathematical pH logarithmic shift and devastating bio-calcification impacts (aragonite dissolution).
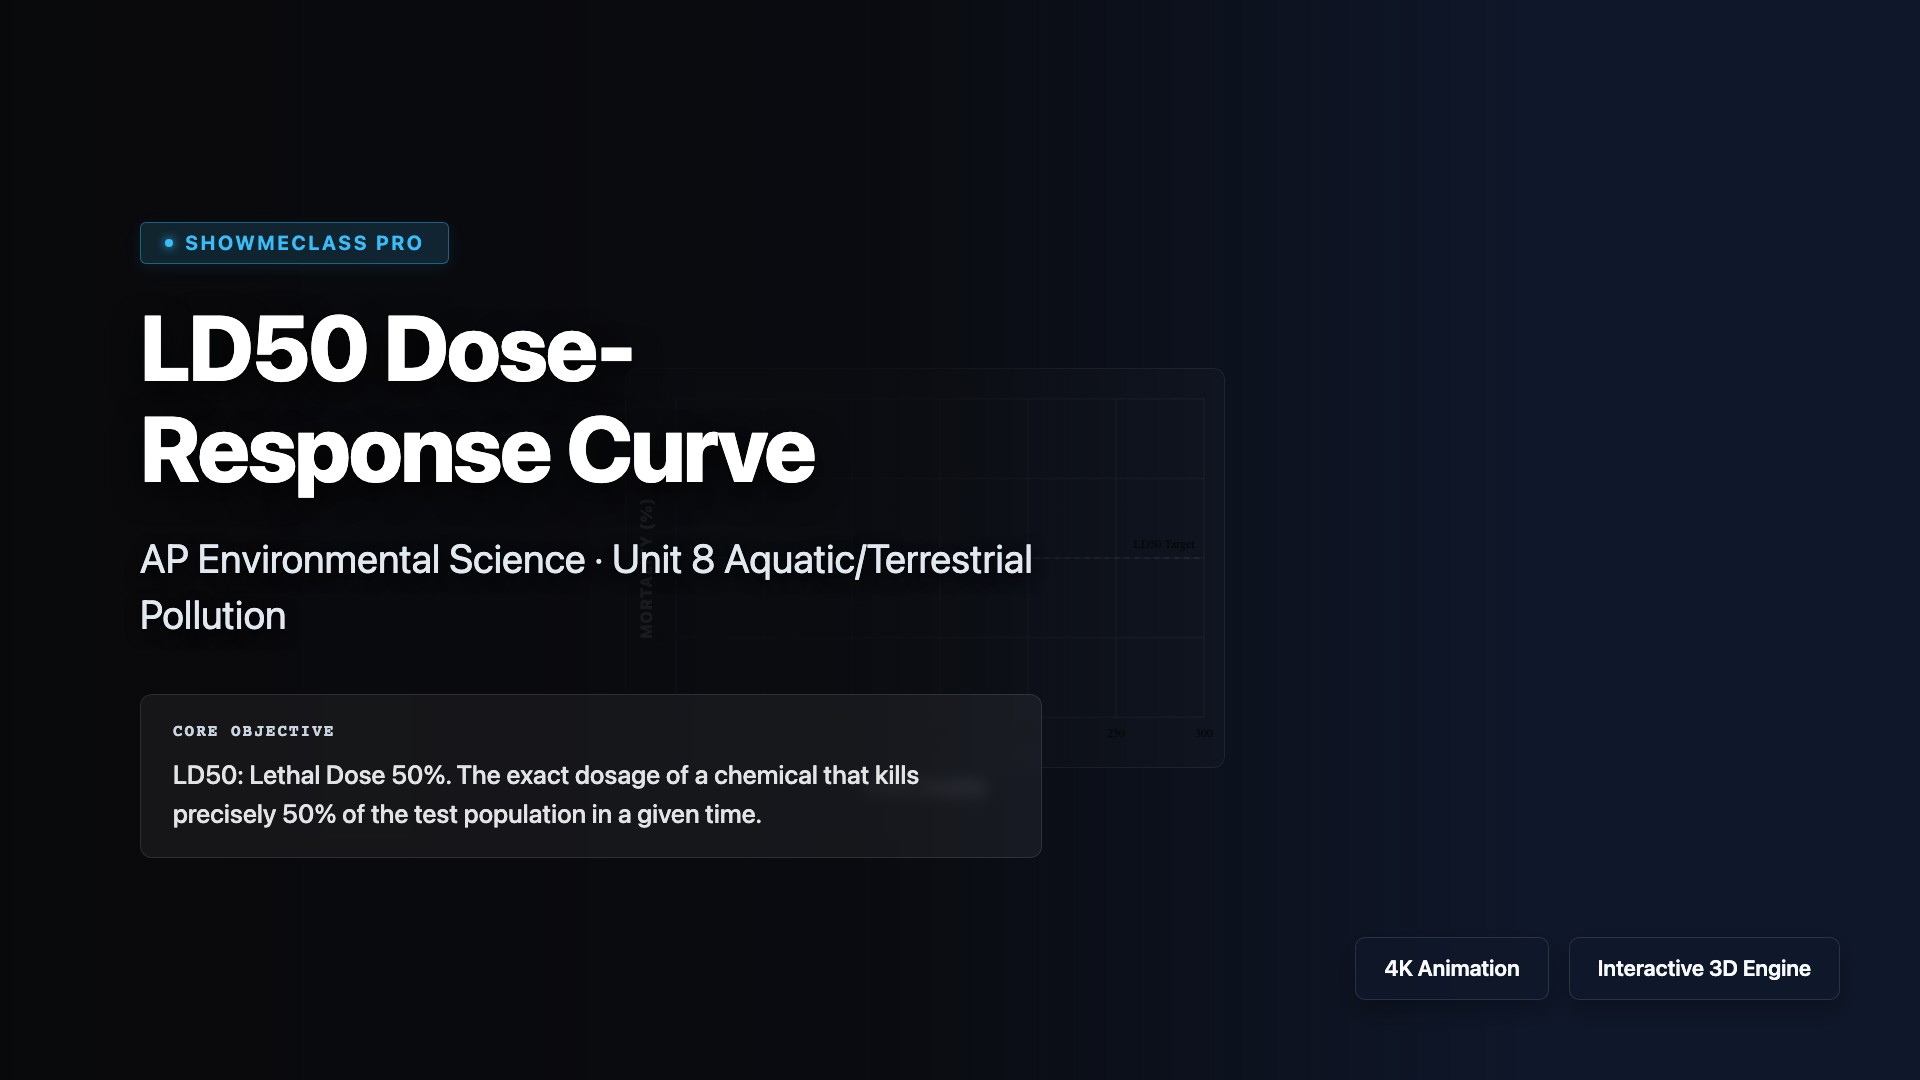
LD50 Dose-Response Curve
Toxicological laboratory test plotting the classic S-shaped dose-response curve to mathematically isolate the lethal dose 50% (LD50) threshold constraint.

Bioaccumulation & Biomagnification
Step-by-step mathematical visualization of biomagnification. Tracks the exponential concentration multiplication of fat-soluble toxins (DDT) as energy degrades across trophic levels.
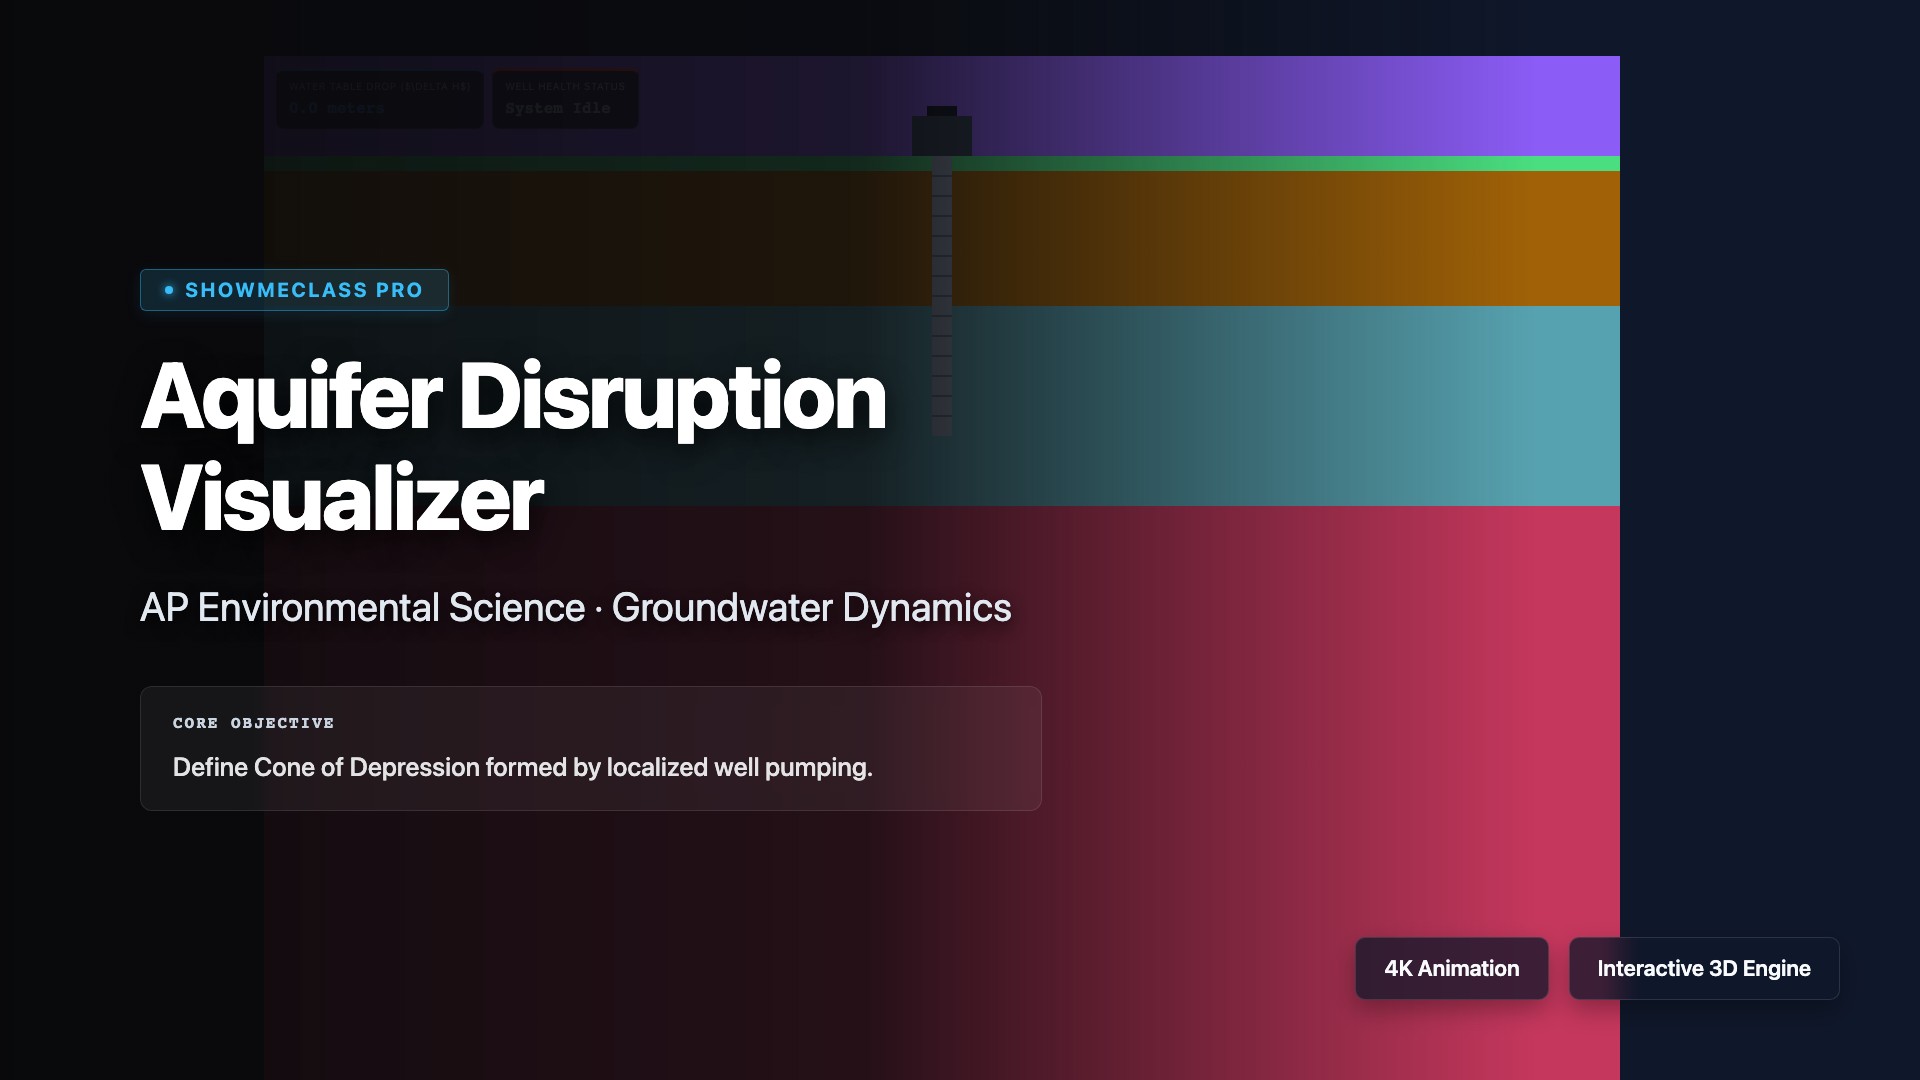
Aquifer Drawdown & Saltwater Intrusion
Examine groundwater dynamics under agricultural duress. Over-pump the well to witness the Cone of Depression collapse the water table, eventually drawing up toxic saltwater from the deep aquifer and ruining the well.

Tax Incidence & Deadweight Loss Simulator
Settle the debate over who actually pays taxes. Adjust Supply/Demand elasticities and apply an Excise Tax to instantaneously visualize the Consumer Burden (Blue), Producer Burden (Red), and the inefficient Deadweight Loss (Yellow).