
Showing 12 results
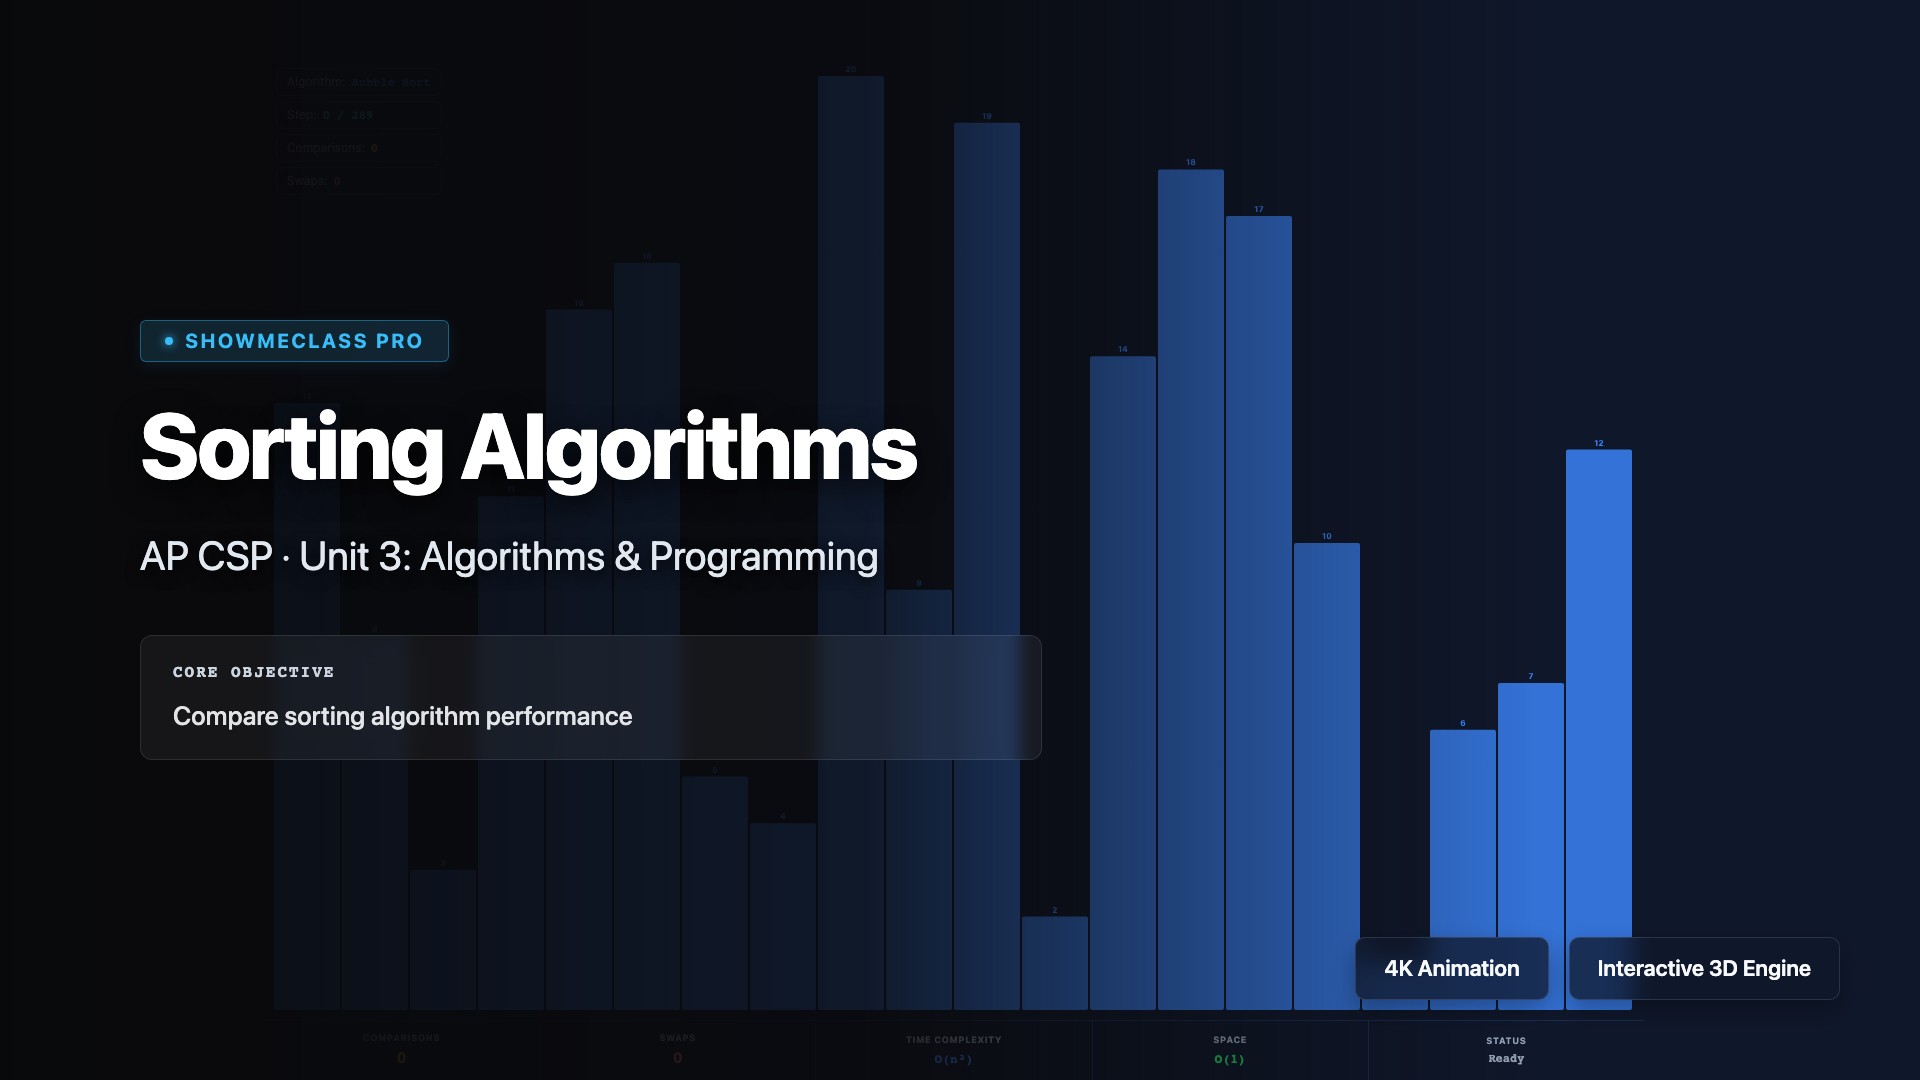
Sorting Algorithms O(N^2) vs O(N log N)
Visualize Selection, Insertion, and Merge sort line-by-line. Track memory accesses, array swaps, and Big-O efficiency in real time.

Recursion Call Stack Memory
Step through factorial and Fibonacci recursive calls frame-by-frame. Watch the LIFO Call Stack grow and trace return values bubbling up from the Base Case.

Array vs ArrayList Memory Resizing
Witness the internal array backing an ArrayList dynamically resize. Compare fixed memory bounds against O(N) copy operations when capacity is exceeded.

Object Orientation Stack vs Heap
Eliminate aliasing bugs by visualizing Java's Stack vs Heap memory. See how references map to object instances and primitives copy by value.

Heapsort Visualization
Visualize treating a flat array as a Complete Binary Tree. Watch the algorithm Build Max Heap, then extract elements to sort in O(N log N) time without extra memory.

2D Array Traversal
Deconstruct nested loops covering Row-Major, Column-Major, and boundary tracing across a 2D integer matrix.

Game Theory Payoff Matrix
Model oligopolistic behavior. Highlights Dominant Strategies and Best Responses to isolate Nash Equilibriums in classic scenarios.
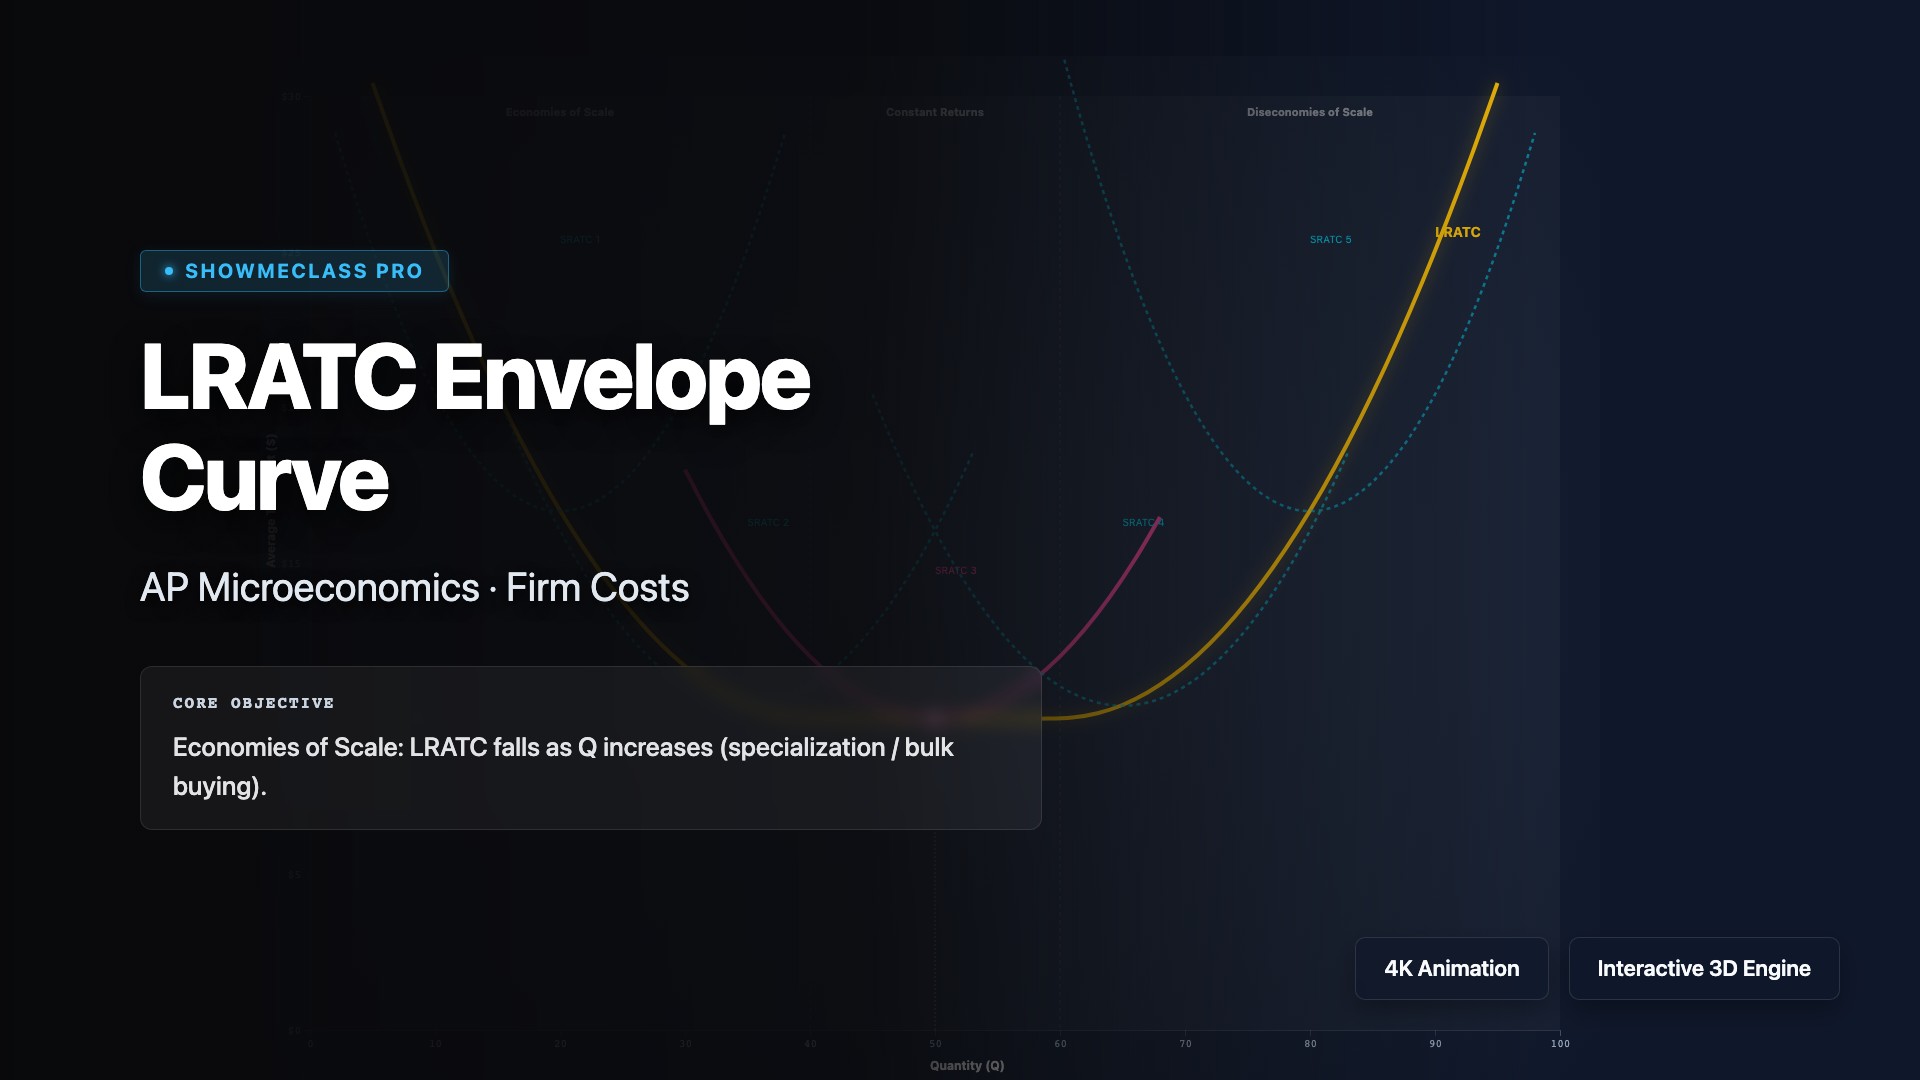
LRATC Envelope Curve
Understand firm costs in the Long Run. Slide targeted production scales to track how Short-Run Average Total Cost curves (SRATC) form the Returns to Scale envelope.
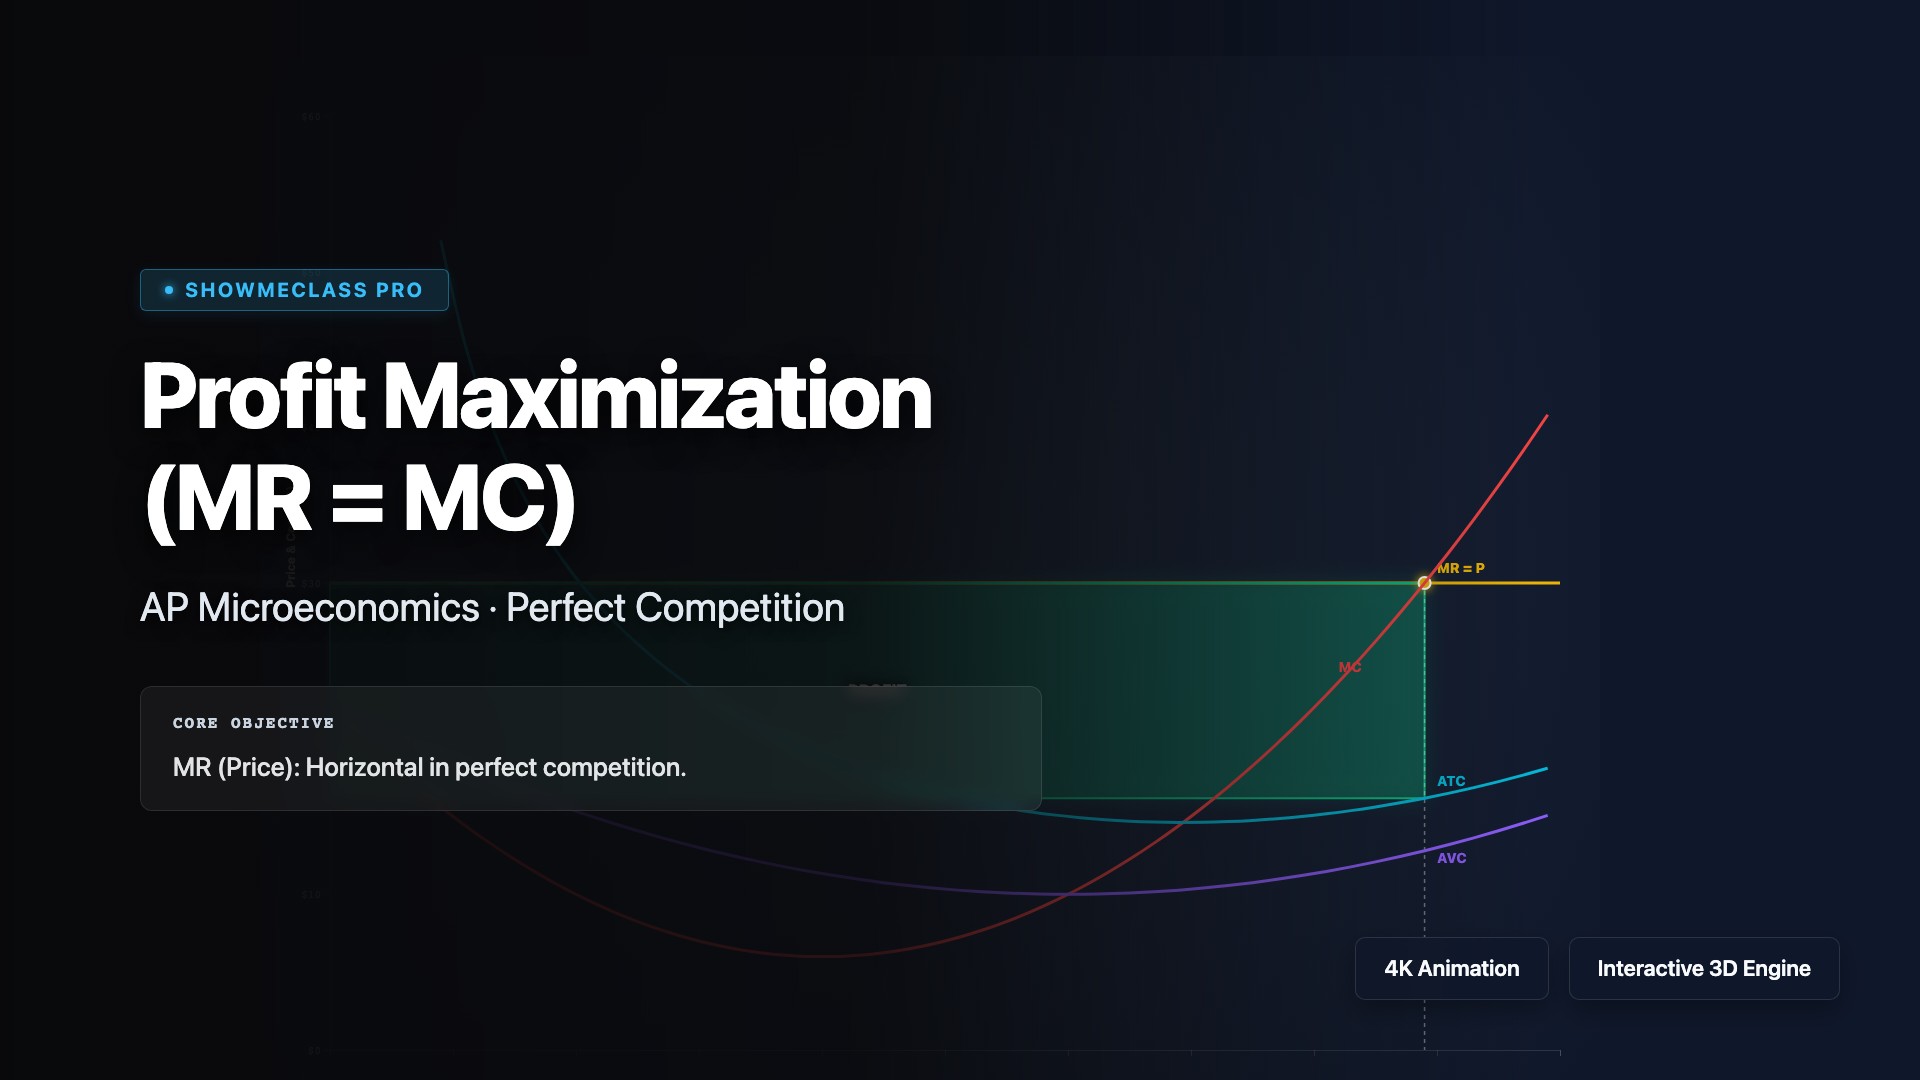
Profit Maximization (MR = MC)
Drag the market price line to find the optimal quantity where MR intercepts Marginal Cost. Instantly calculates Total Economic Profit or identifies the Shutdown point when Price falls below AVC.
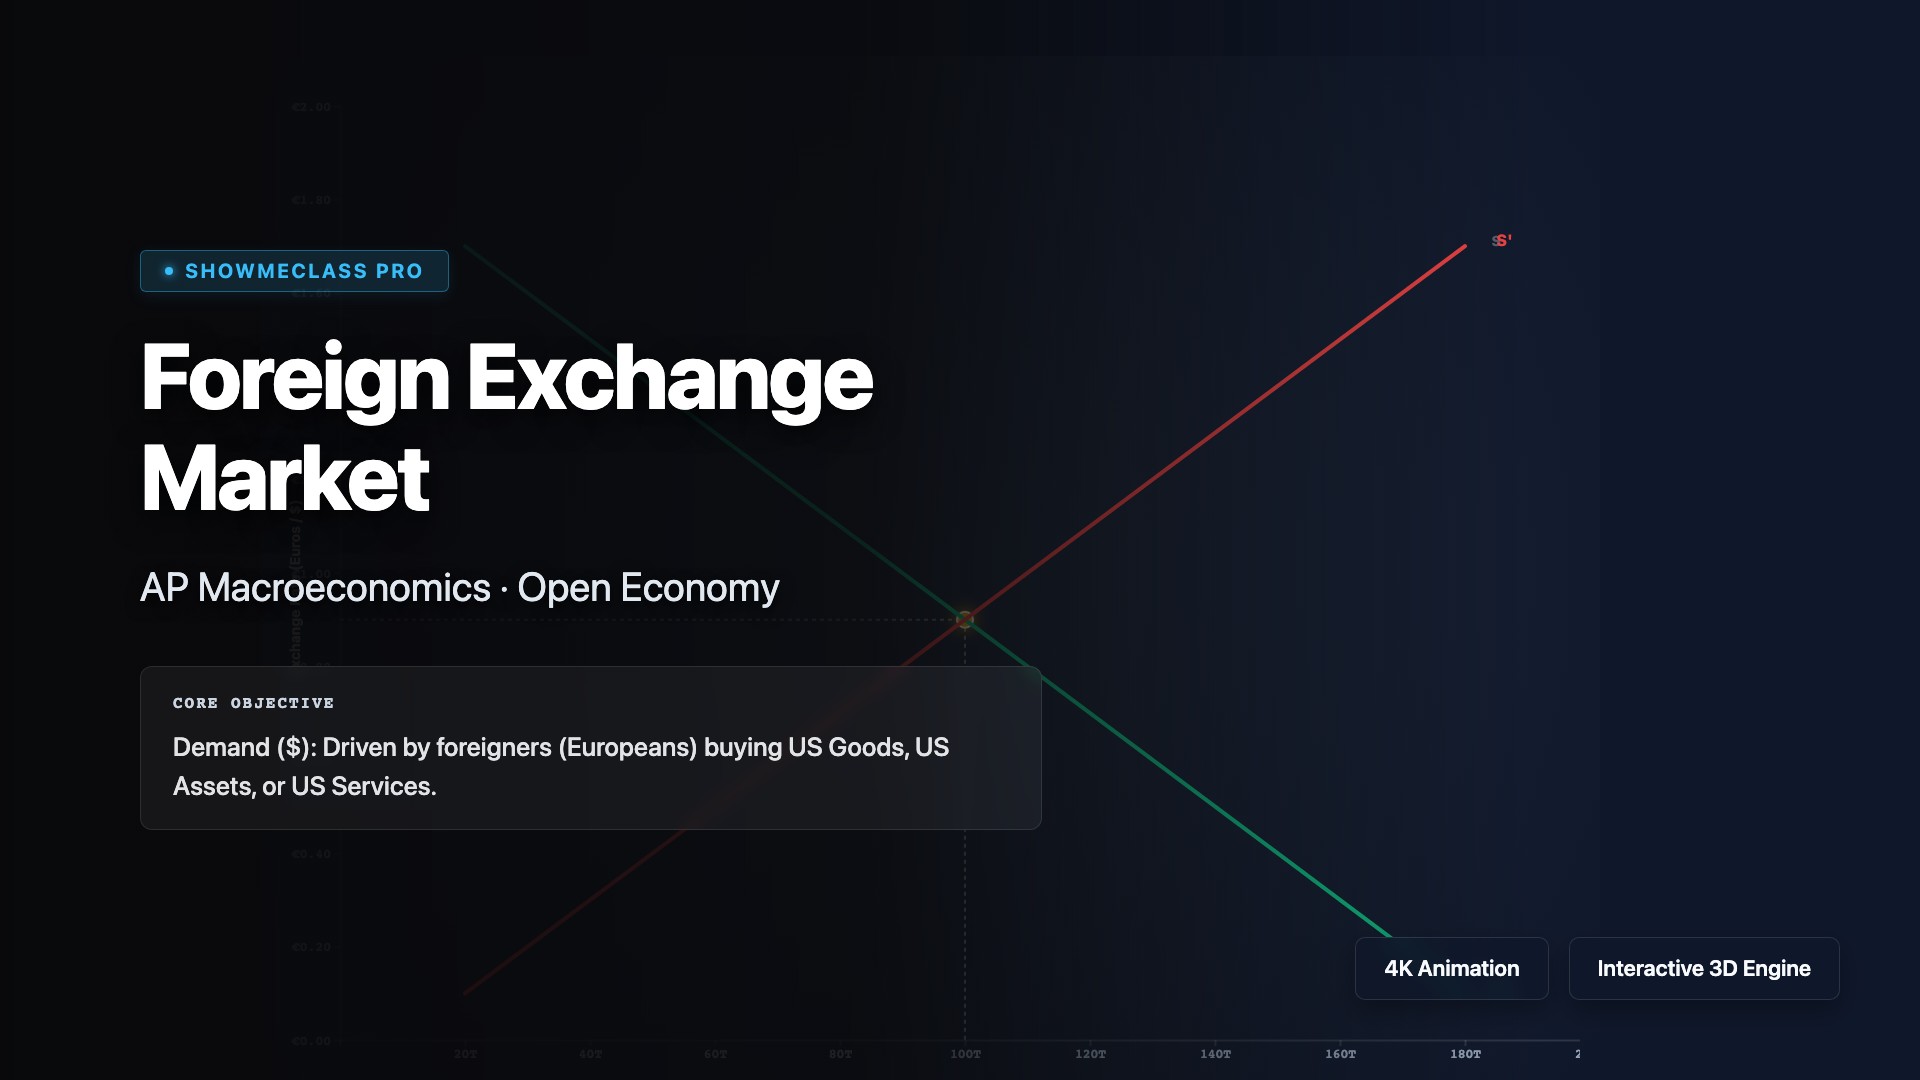
Foreign Exchange Market
Visualize currency Appreciation and Depreciation on the forex market. Shift Supply and Demand curves for US Dollars relative to the Euro based on dynamic global conditions.

Money Multiplier
Deconstruct Fractional Reserve Banking. Track an initial deposit dynamically chaining through multiple bank node T-accounts via Excess Reserve lending.
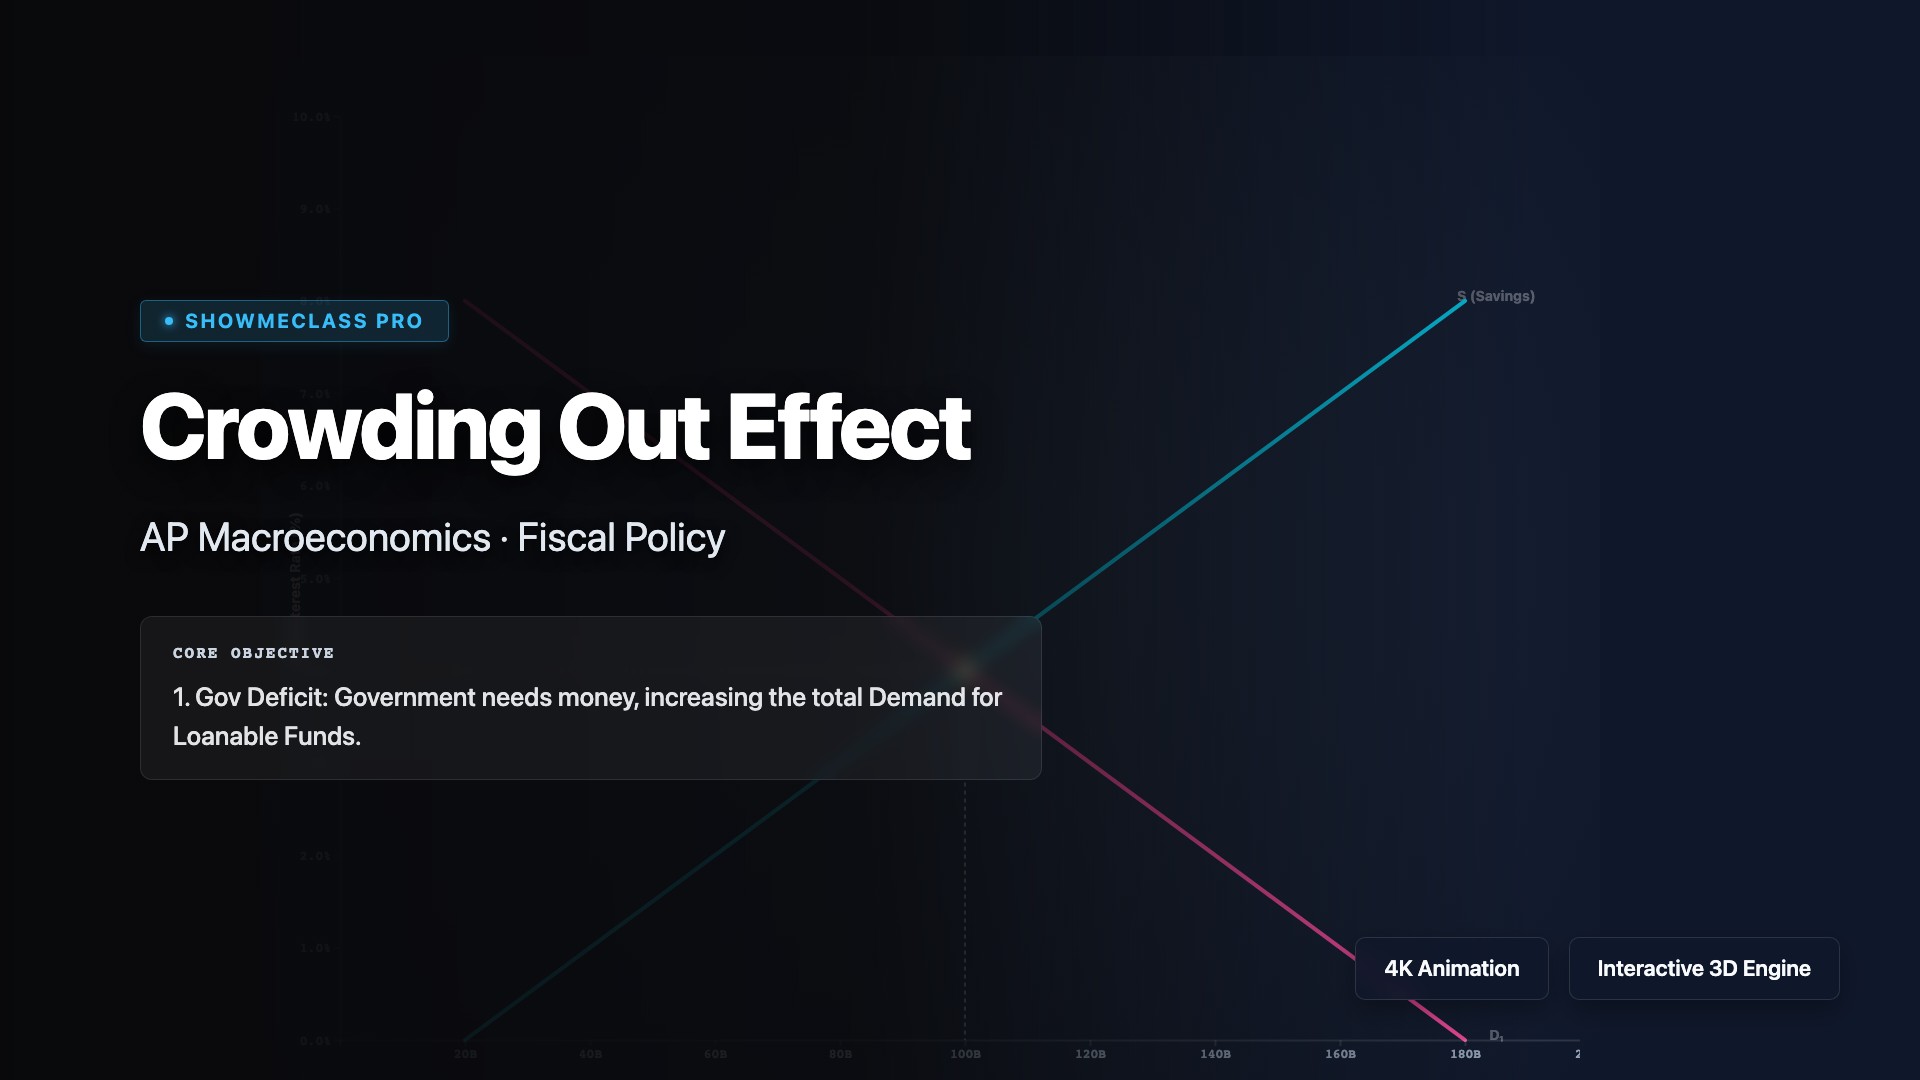
Crowding Out Effect
Observe how Government Deficit spending spikes Real Interest Rates in the Loanable Funds Market, inadvertently Crowding Out private business investment.