
Showing 12 results
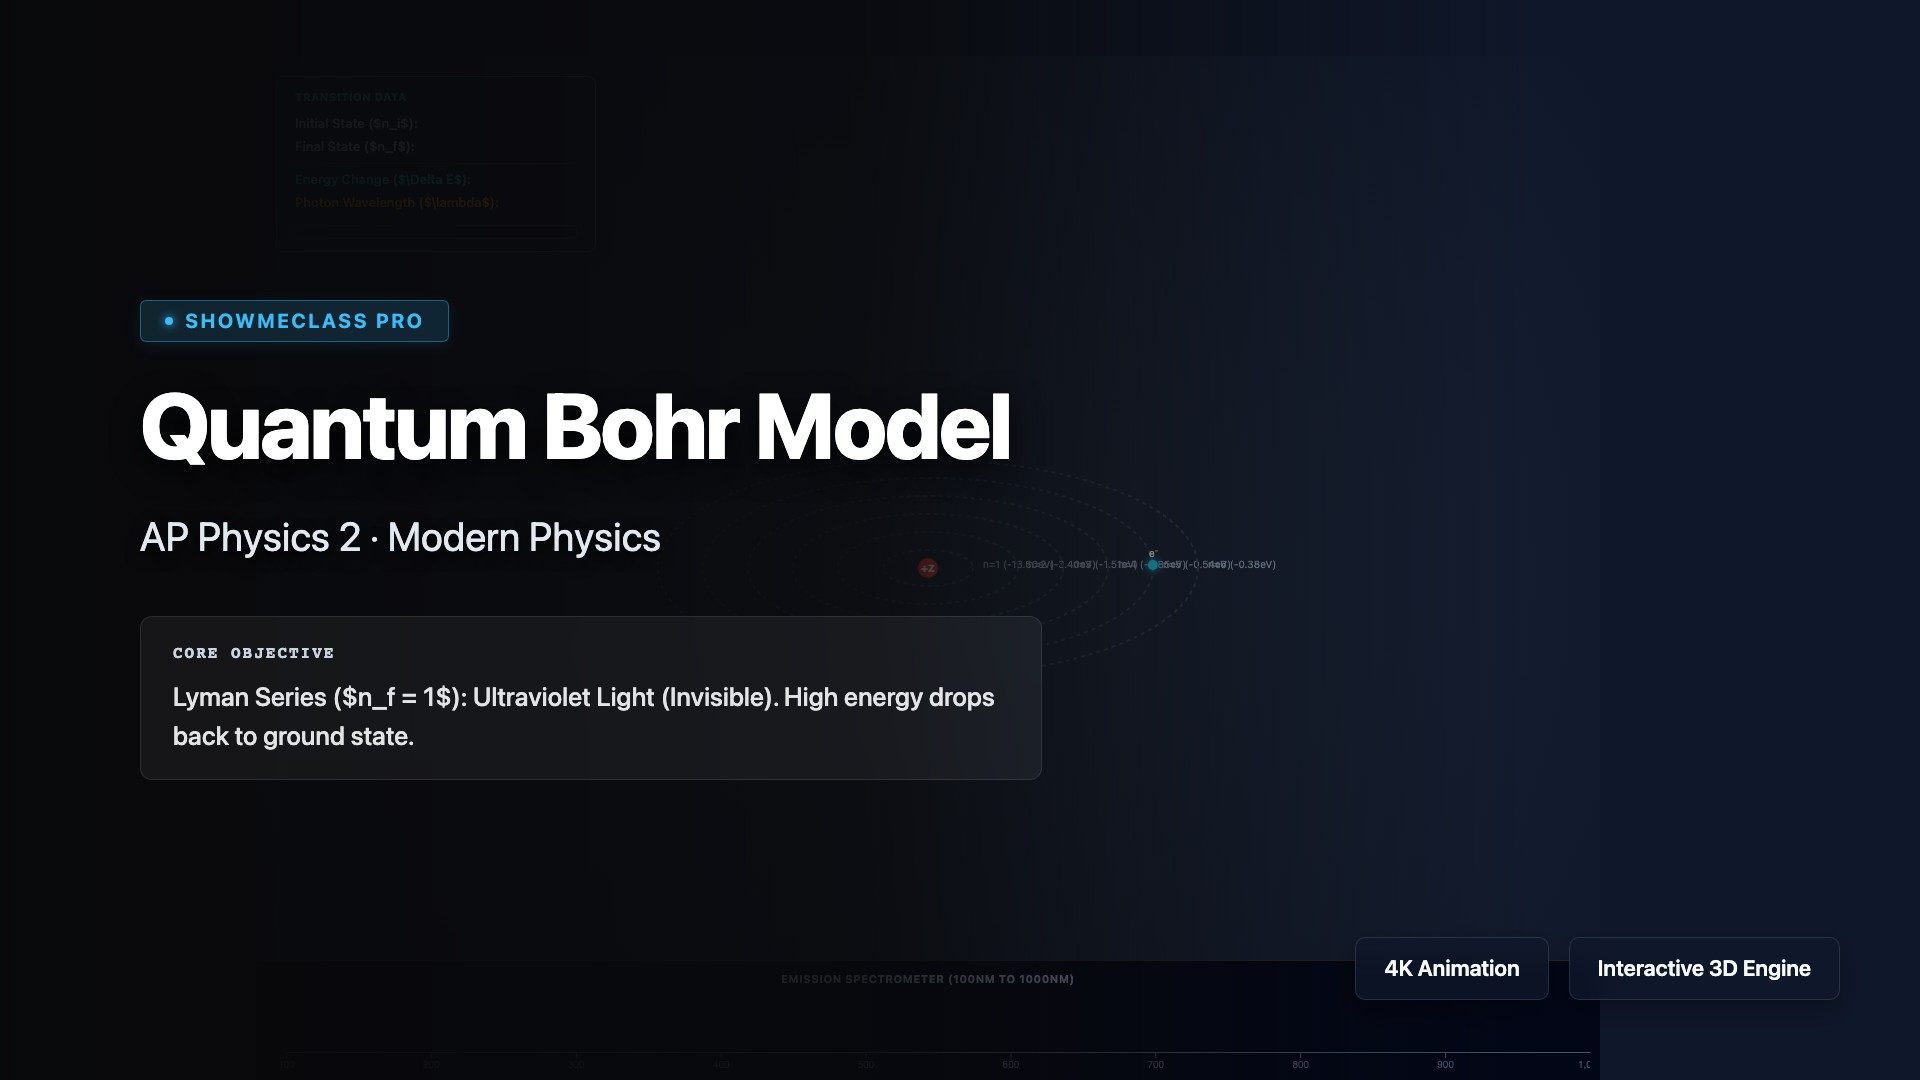
Quantum Bohr Model
Visualize electron orbital transitions in Hydrogen-like atoms. Calculate photon emission wavelengths and generate real-time spectral lines (Lyman, Balmer, Paschen).
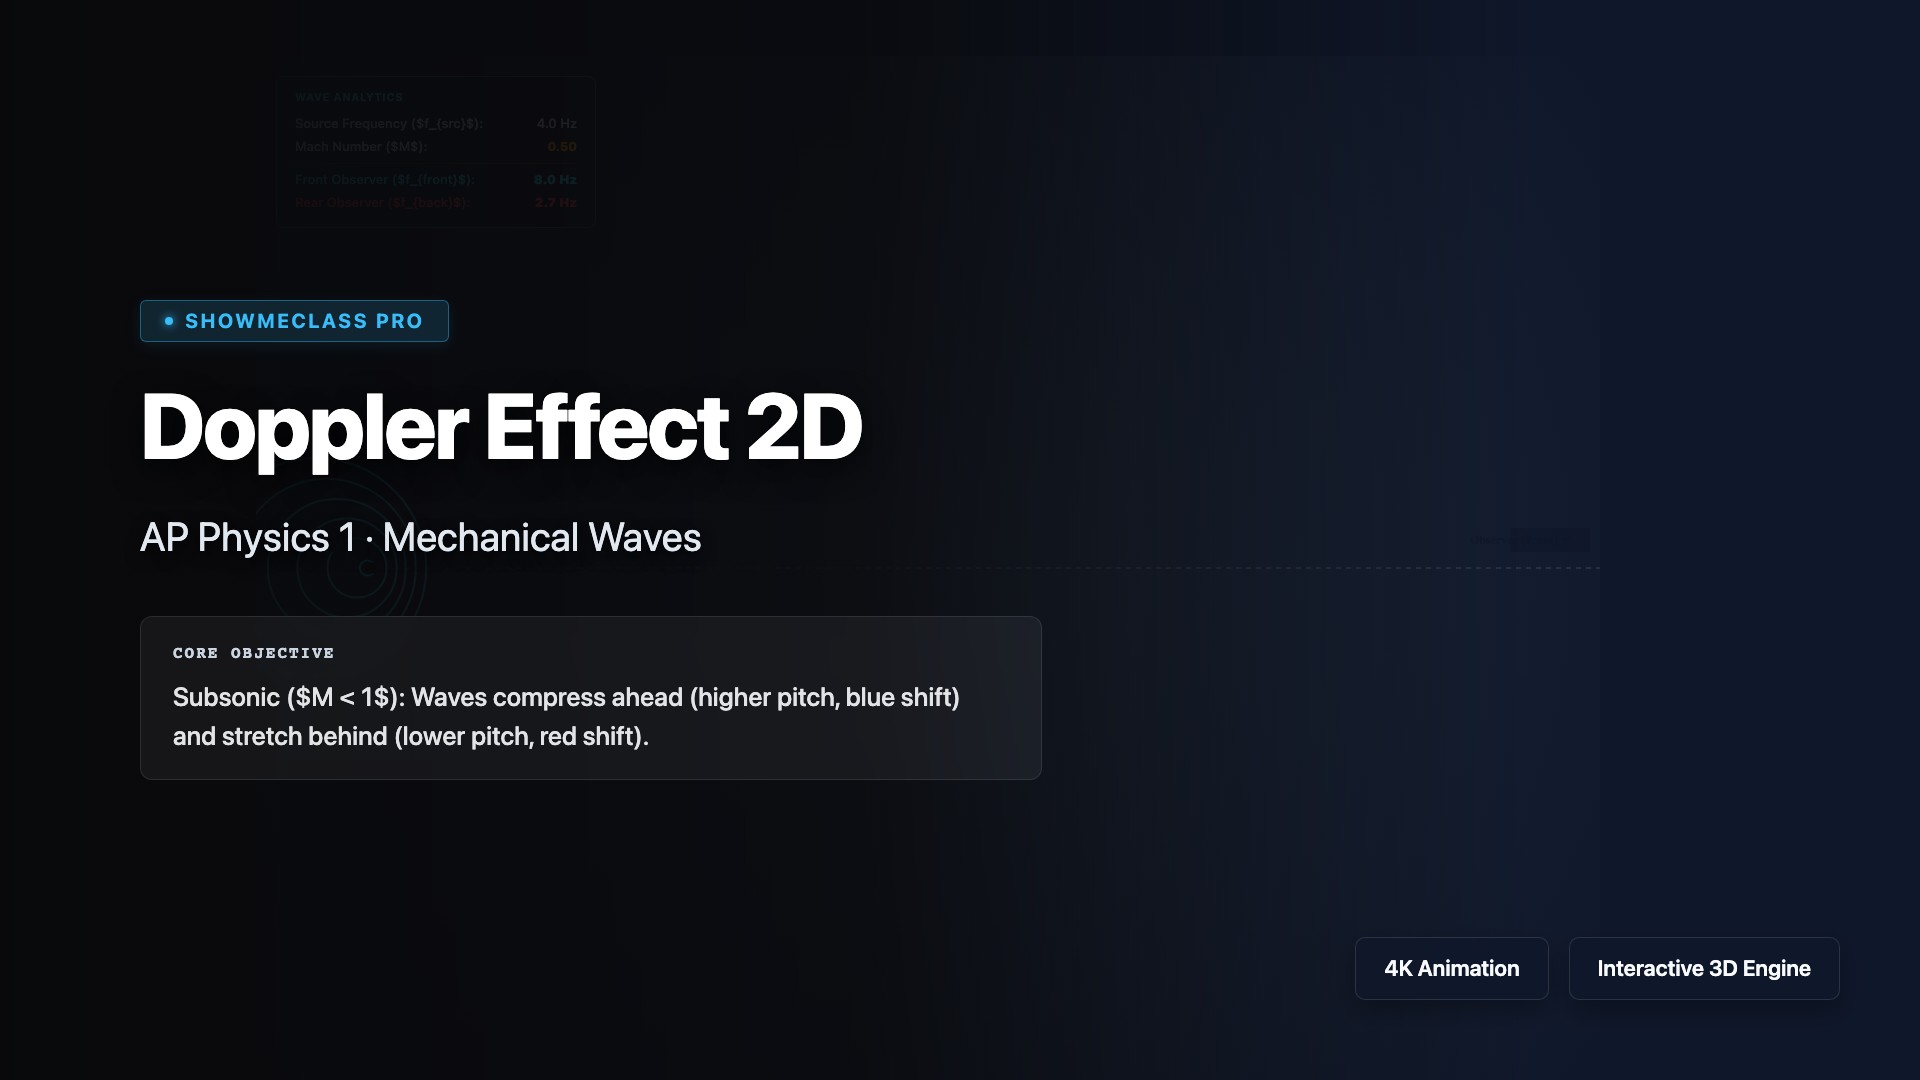
Doppler Effect 2D
Simulate sound wave propagation from a moving source. Calculate perceived frequencies for front and rear observers, and explore the Mach Cone (sonic boom) during supersonic flight.
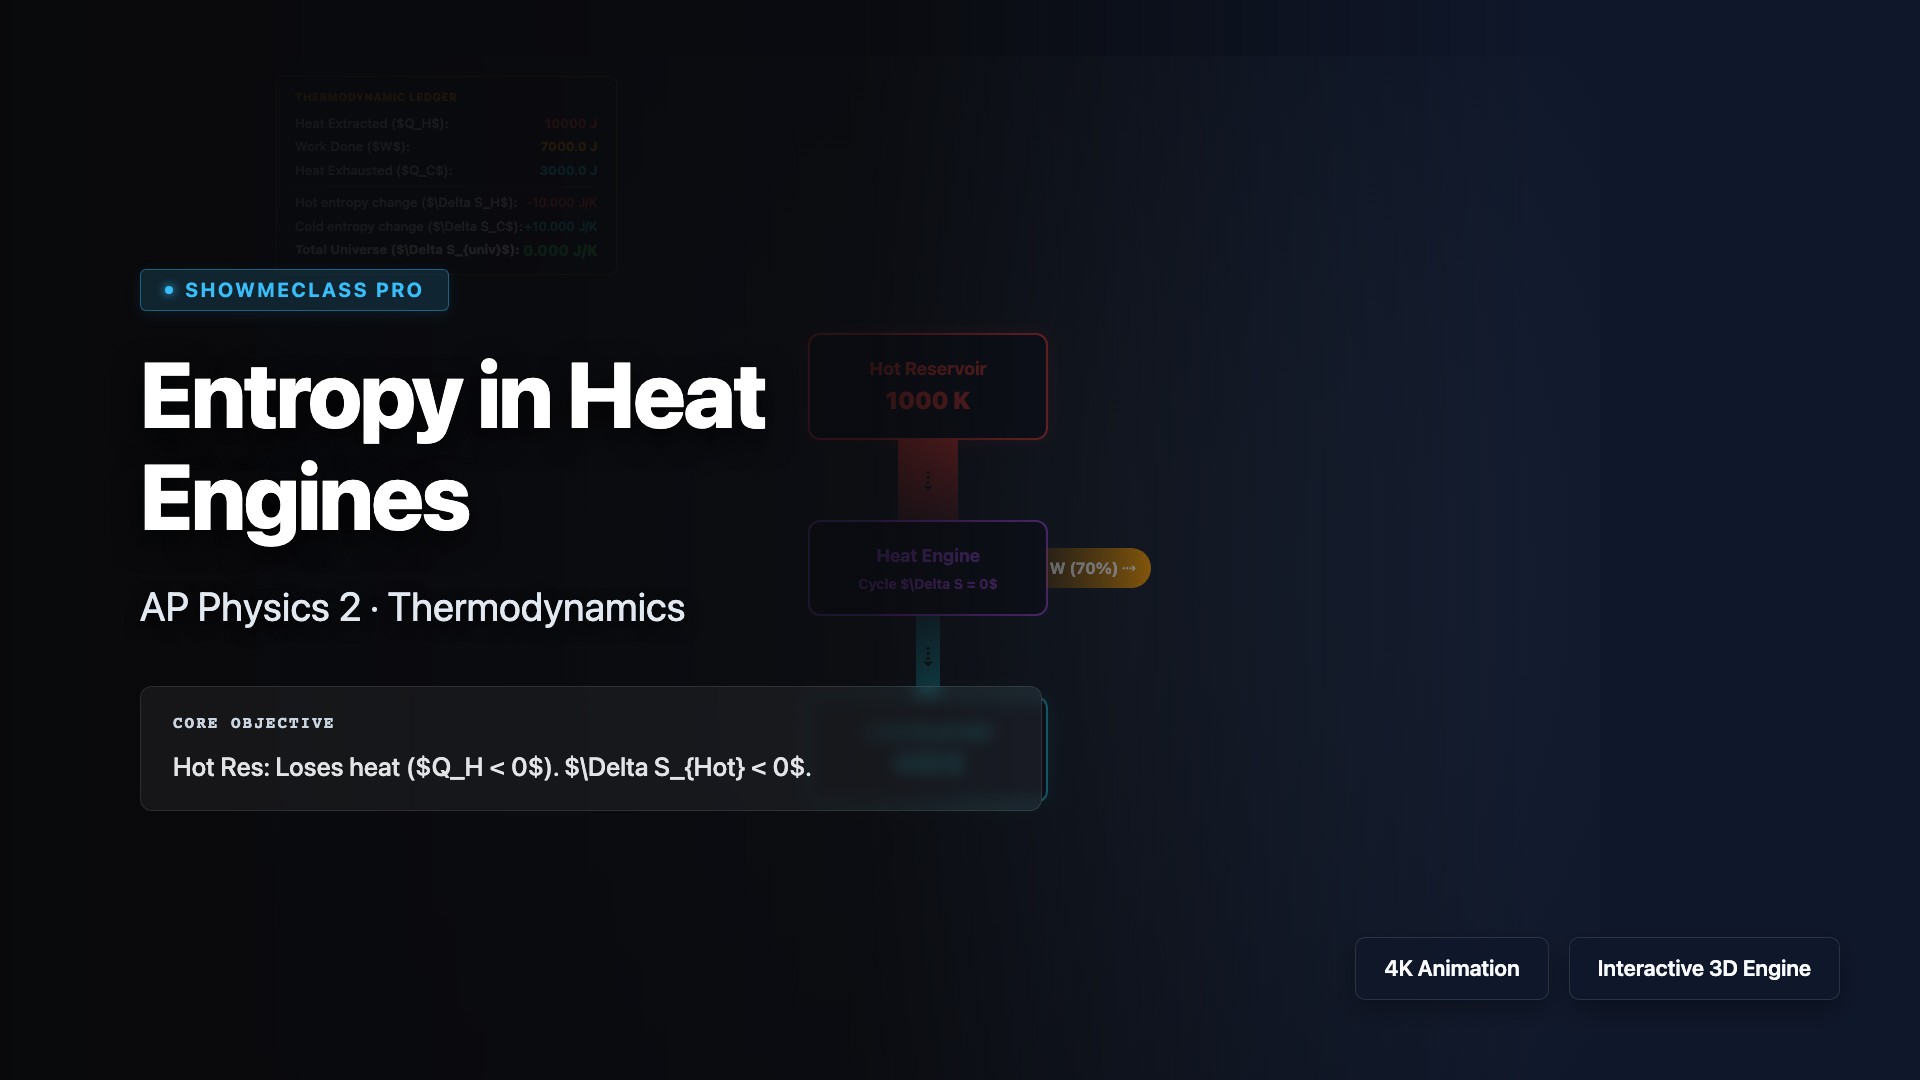
Entropy in Heat Engines
Visualize the 2nd Law of Thermodynamics. Build reversible Carnot engines and irreversible real engines to track the exact entropy changes in the hot reservoir, cold reservoir, and the universe.
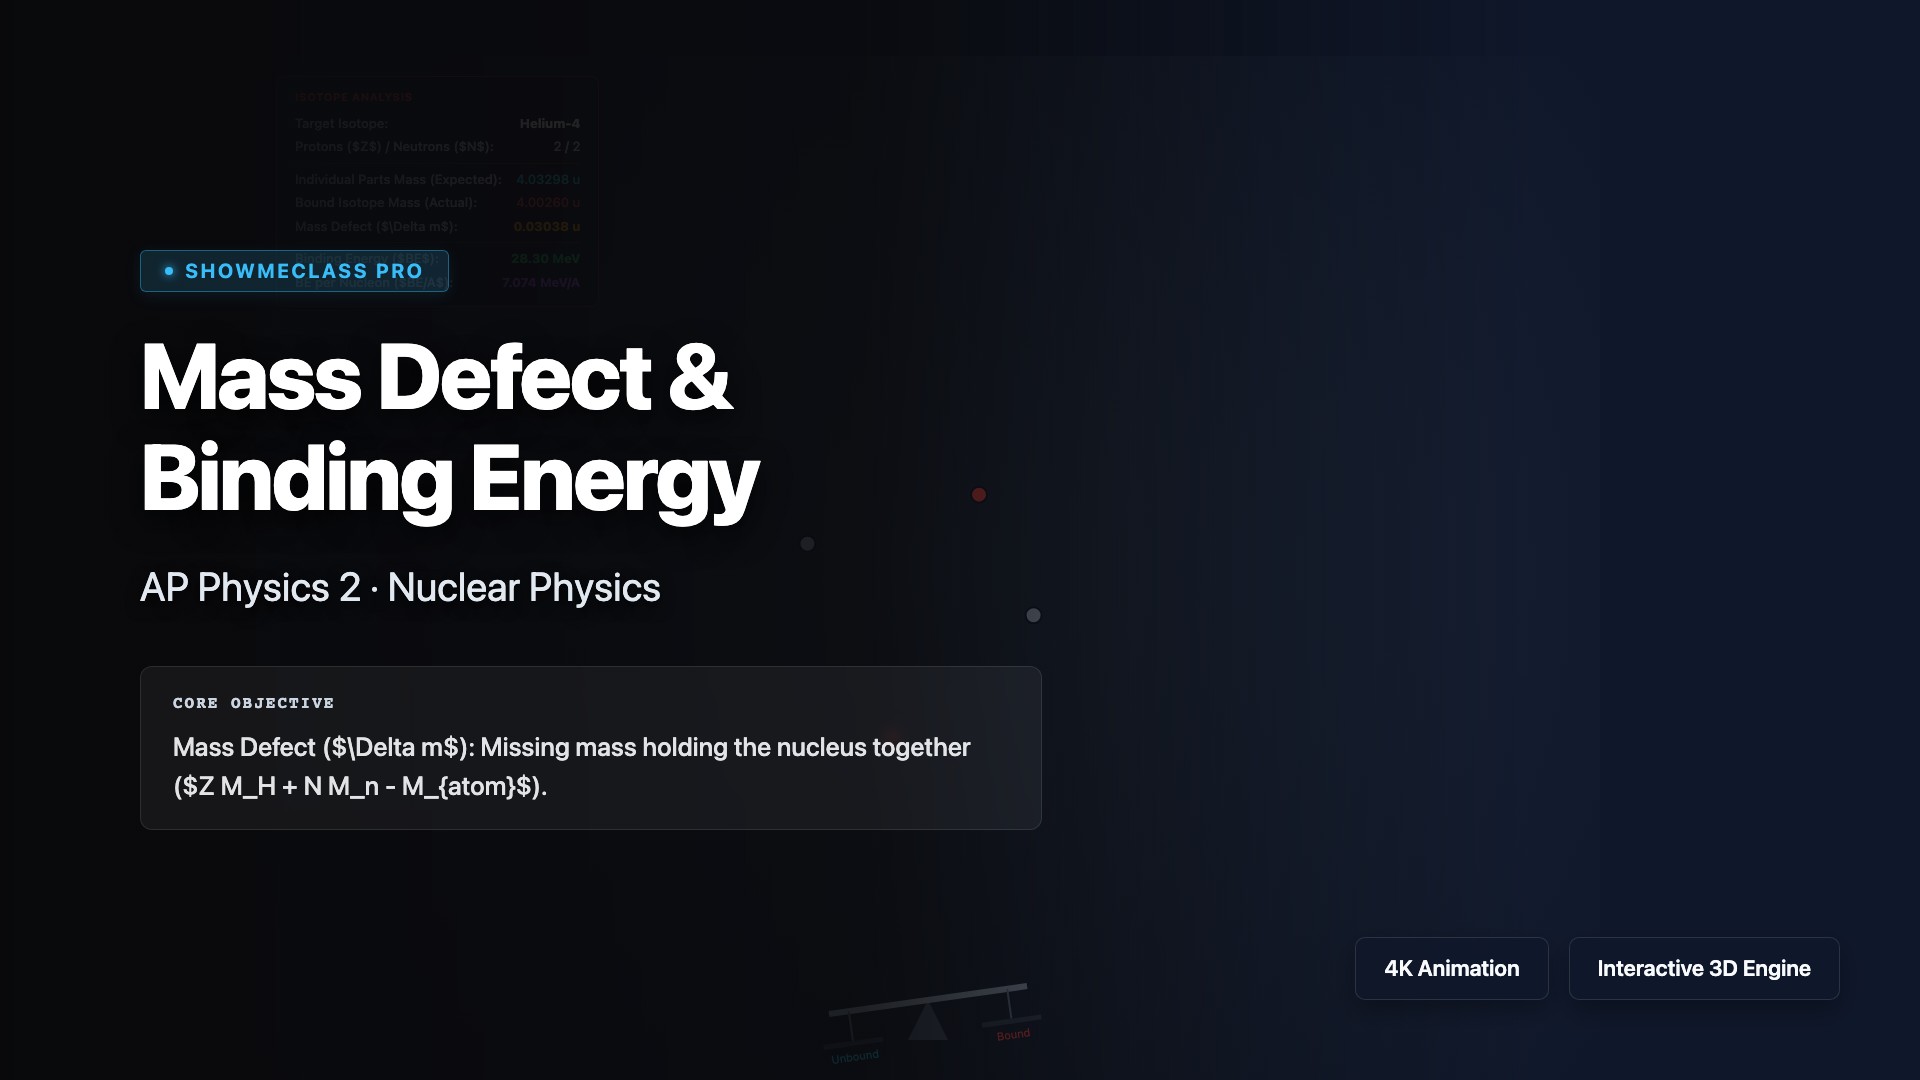
Mass Defect & Binding Energy
Weigh the separate protons and neutrons against the bound nucleus of specific isotopes. Convert the missing mass defect into nuclear strong force binding energy using E=mc².
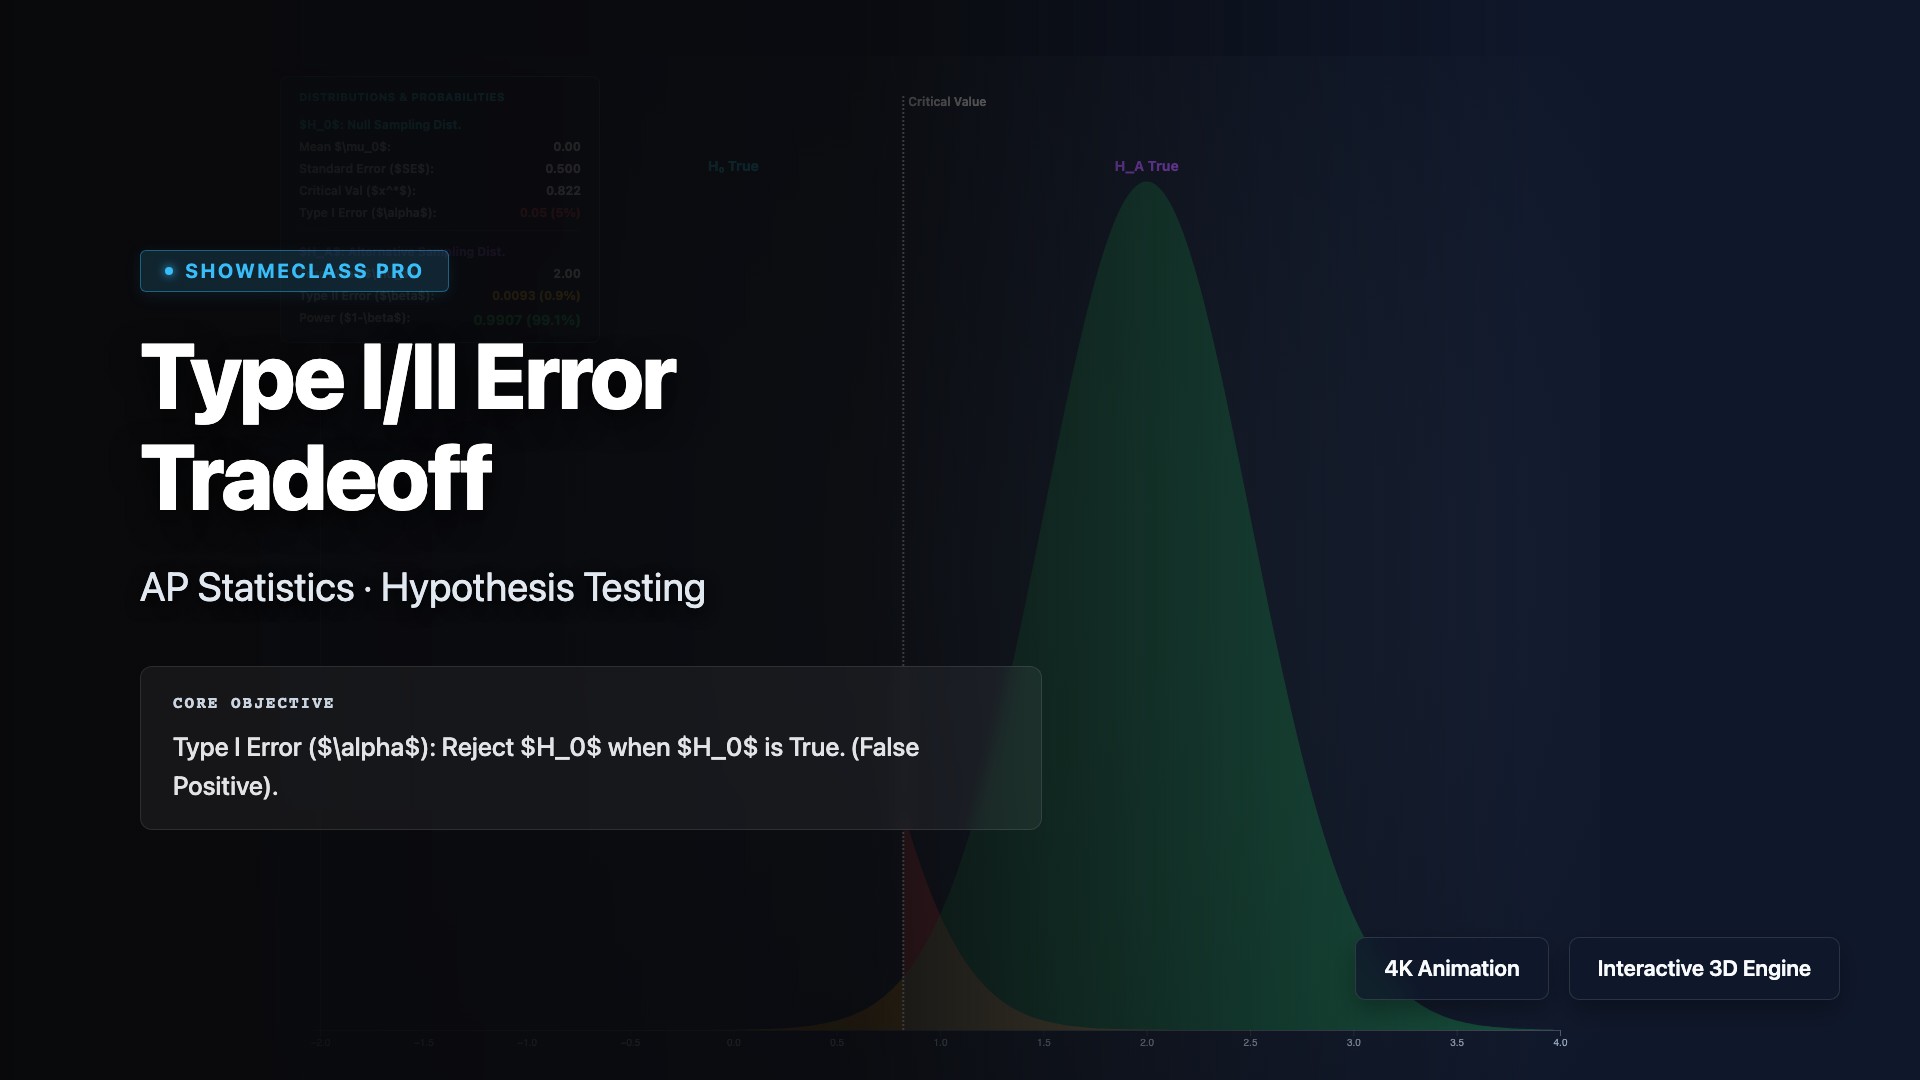
Type I/II Error Tradeoff & Power
Visualize the fundamental tradeoff between alpha, beta, and statistical power in Hypothesis Testing. Interactive normal distribution sampling curves.
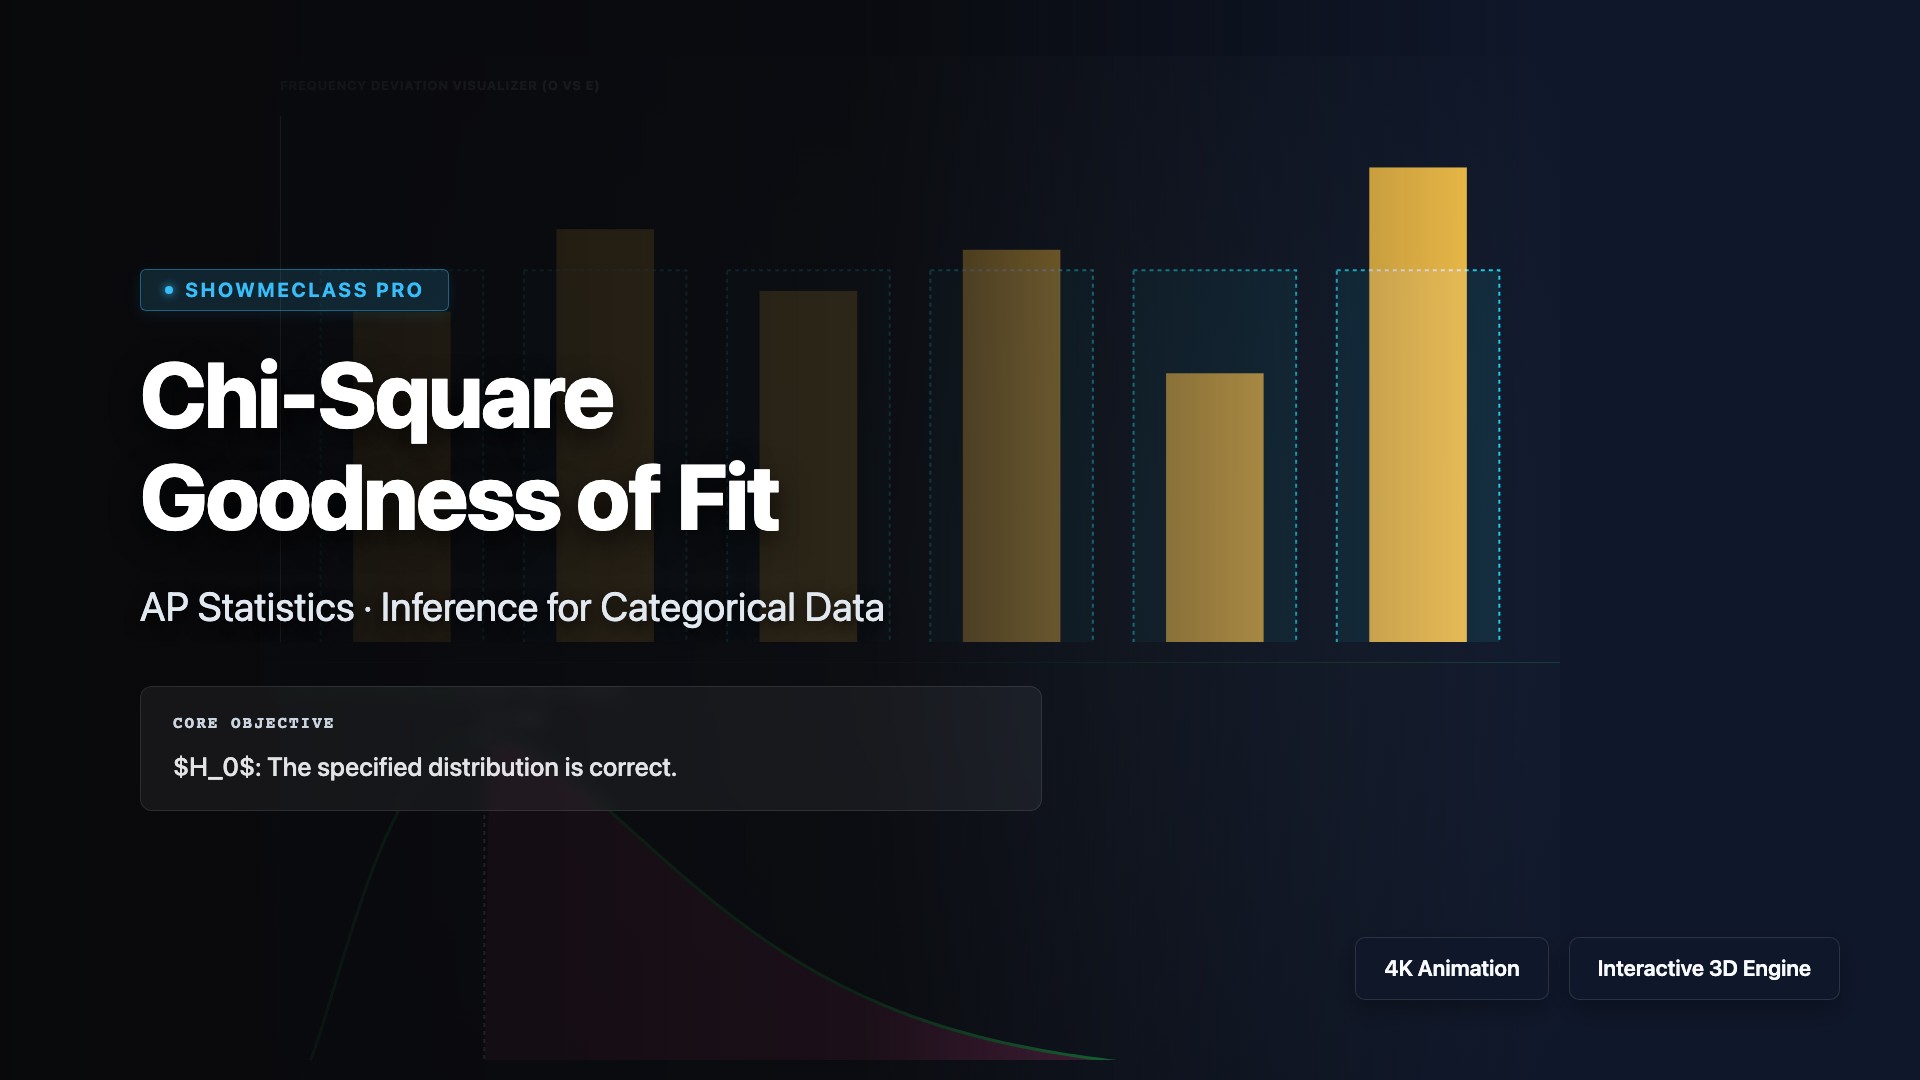
Chi-Square Goodness of Fit
Calculate and visualize deviations from expected categorical frequencies. Generates the exact right-skewed Chi-Square distribution and P-Value tail.
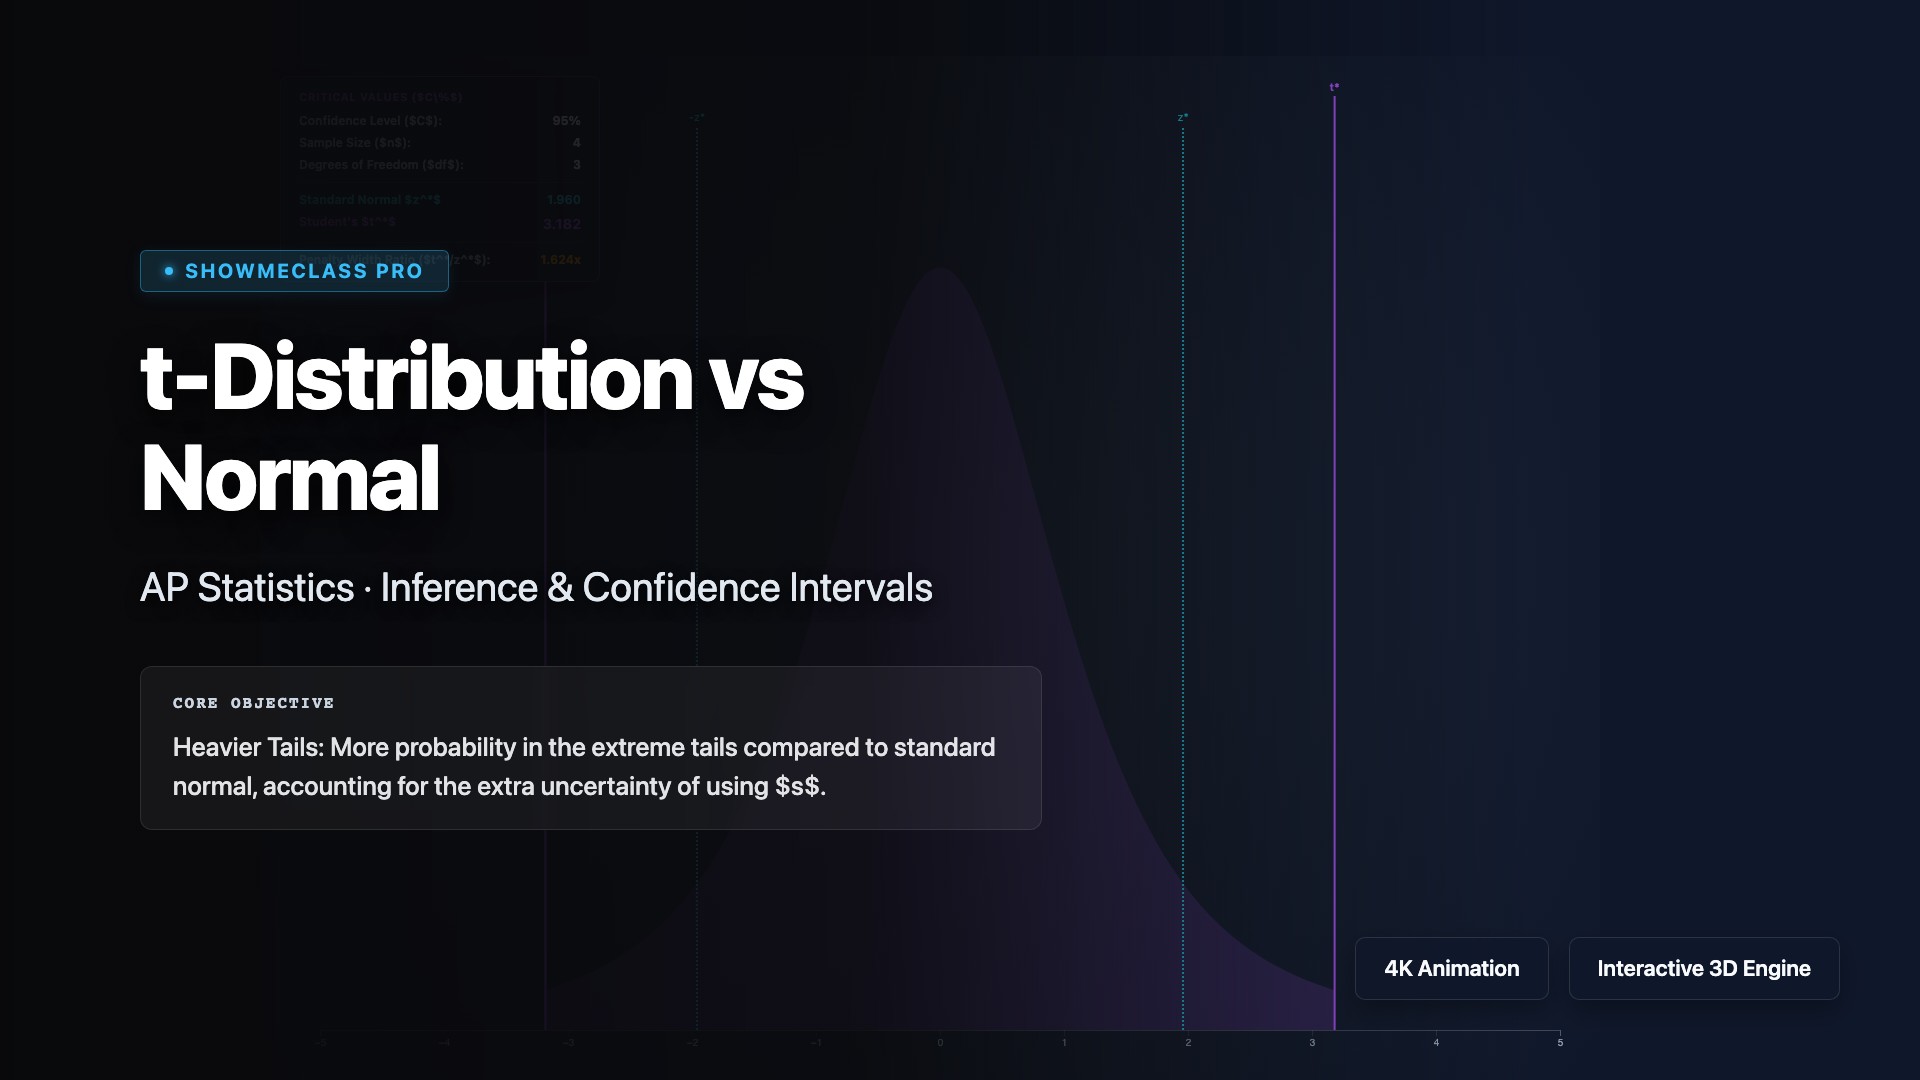
t-Distribution vs Normal
Examine the heavy-tailed Student's t-distribution. Increase degrees of freedom (df) to watch it perfectly converge into the standard normal z-distribution.
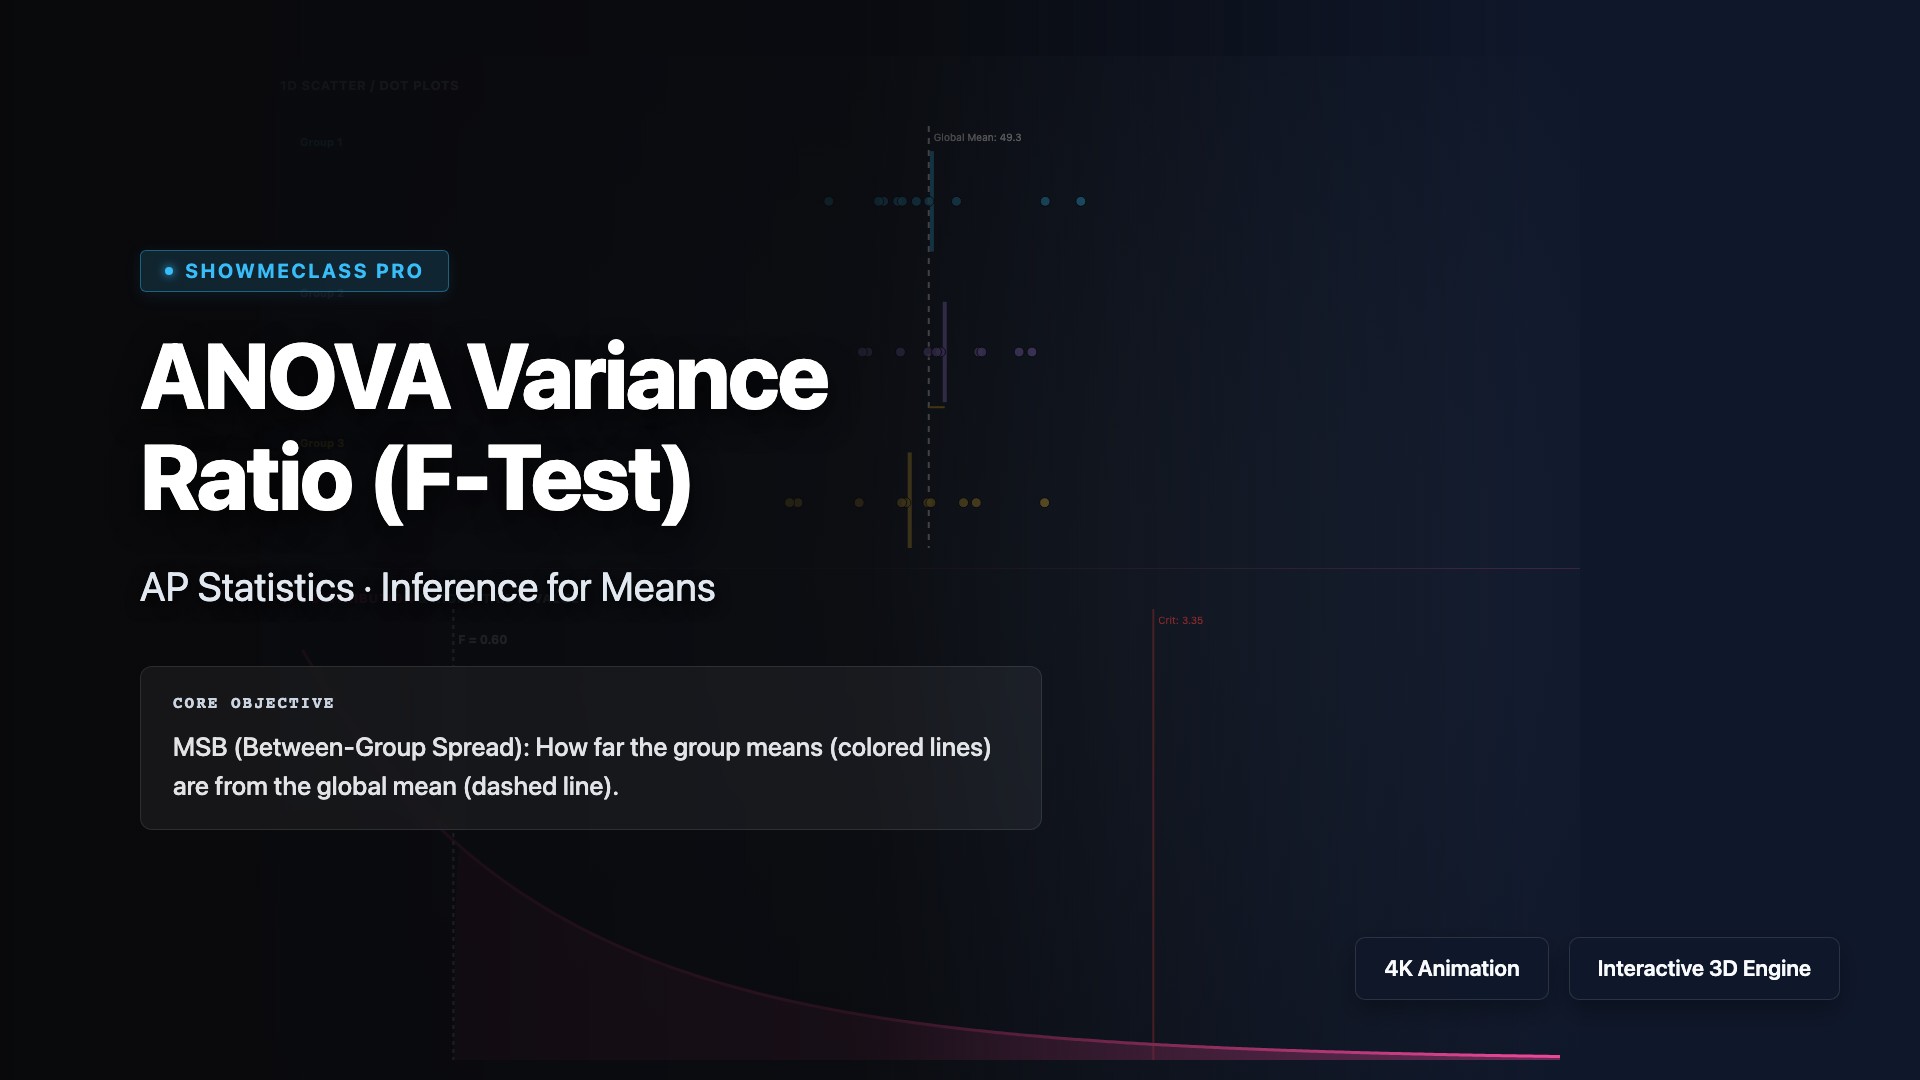
ANOVA Variance Ratio
Deconstruct Analysis of Variance geometrically. Shift group means (MSB) and internal scatter (MSW) to see the massive impact on the F-statistic and P-value.
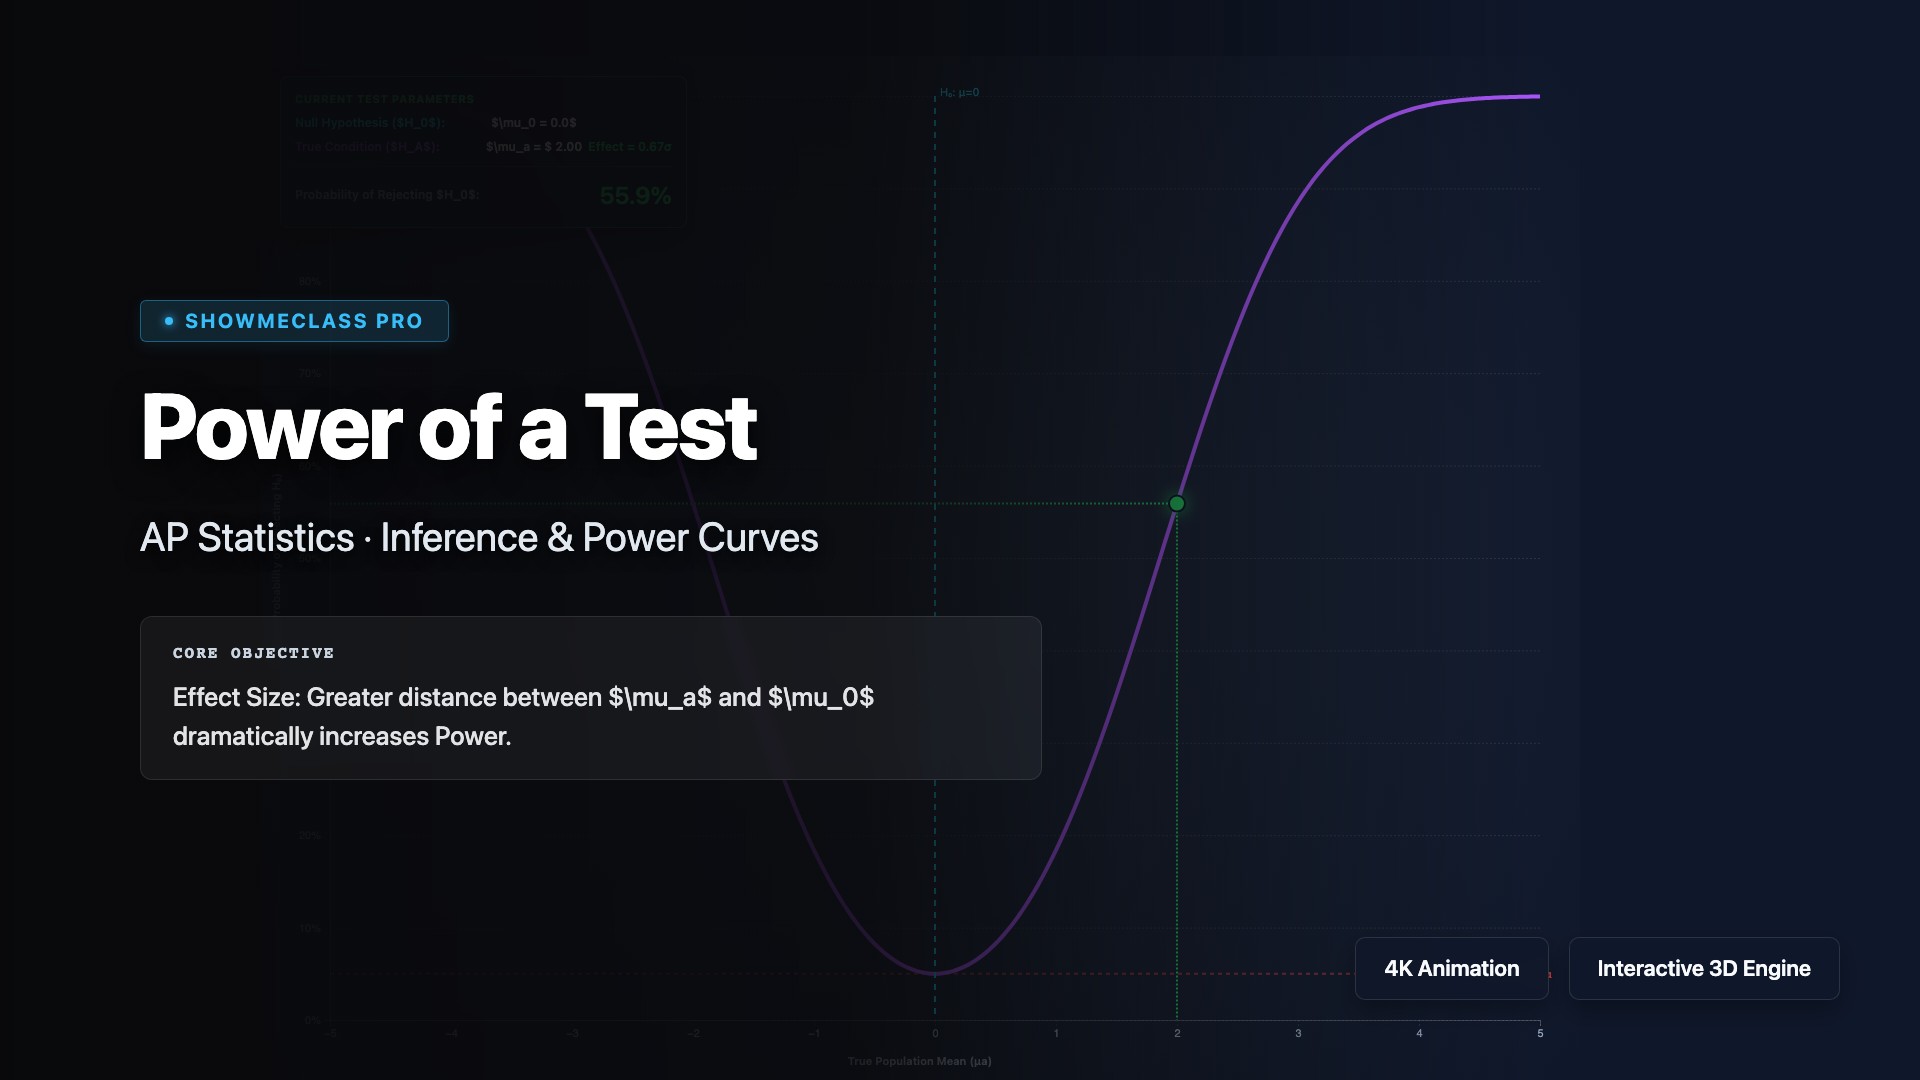
Power of a Test Curve
Visualize how Statistical Power responds dynamically to Effect Size (mu_a), Sample Size, and Alpha. Plot the complete functional power curve.
Sampling Distributions (CLT)
Struggle with the Central Limit Theorem? Draw 10,000 samples from highly skewed or bimodal parent populations and watch the perfect normal bell curve emerge.
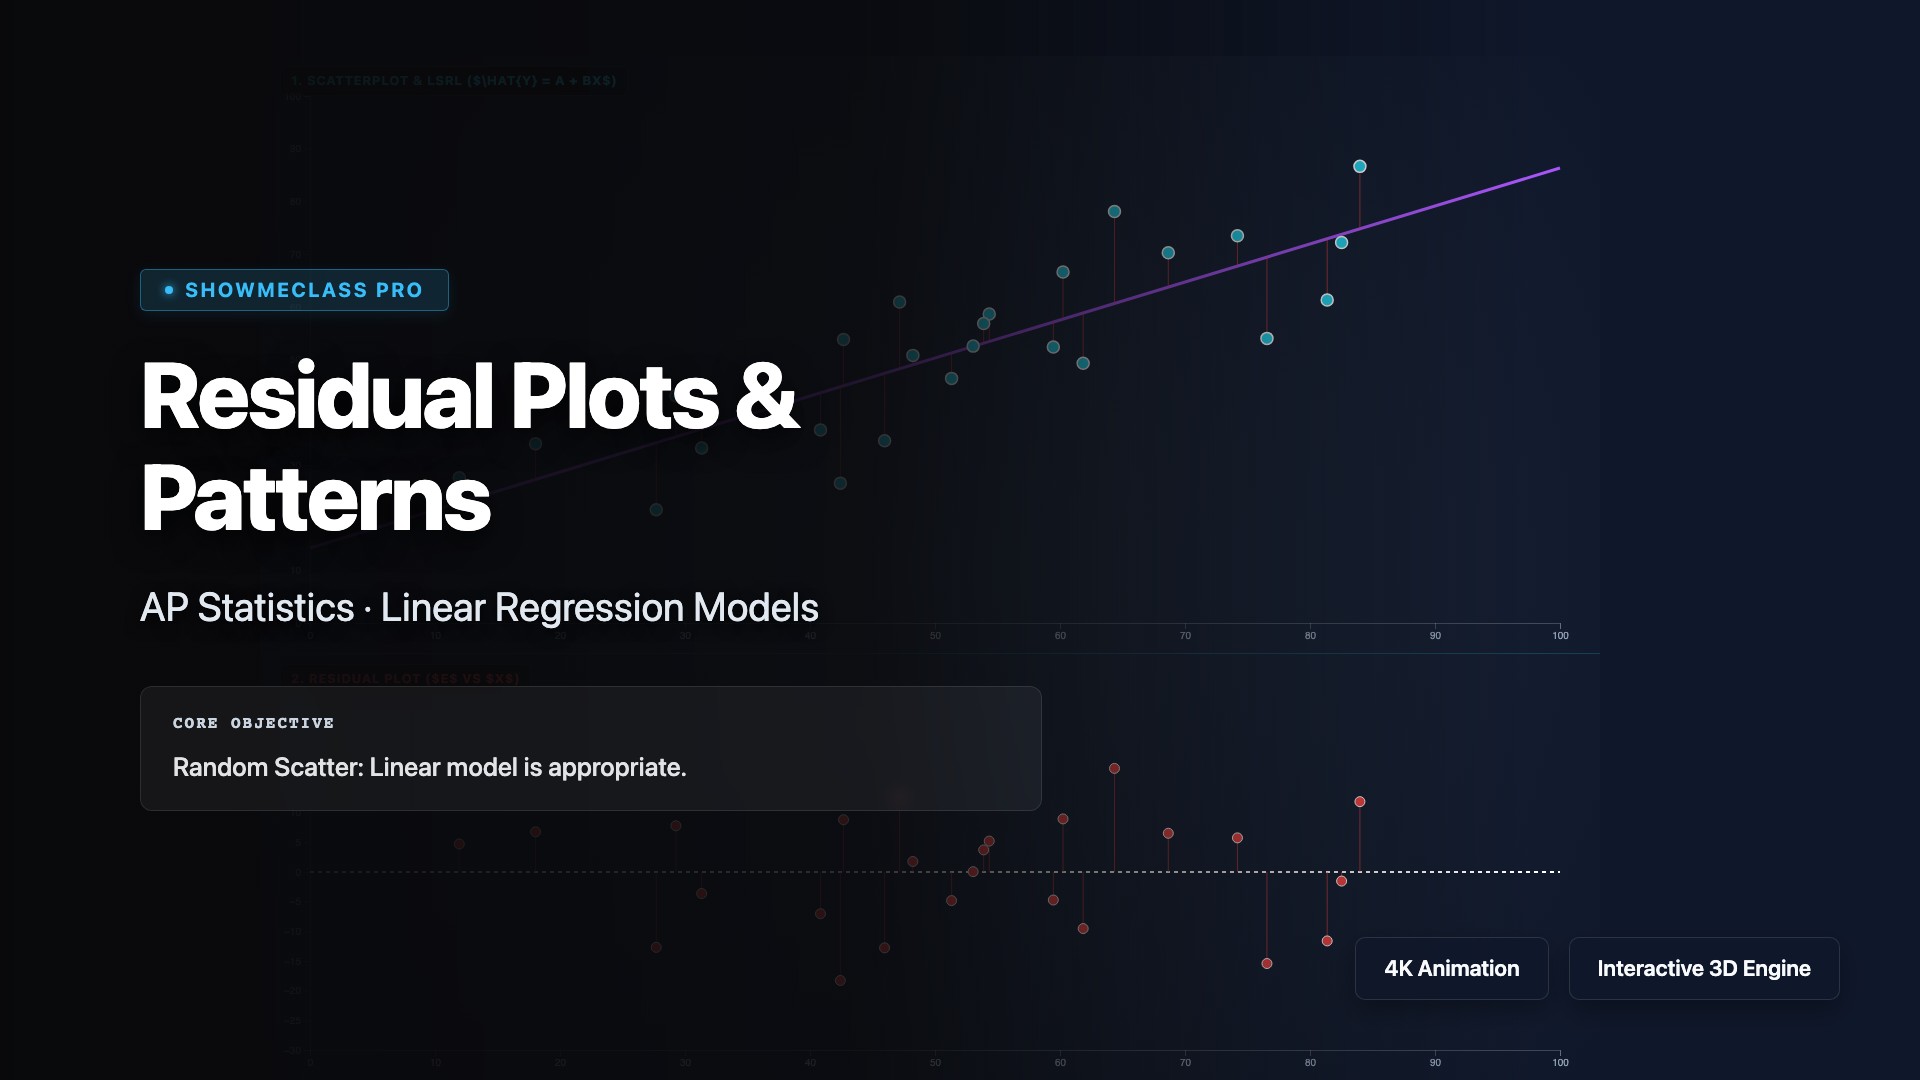
Residual Plots
Evaluate the appropriateness of Least Squares Regression Lines (LSRL). Detect curvilinear patterns, heteroscedasticity, and influential outliers.

Binary Search Tree
Construct dynamic 2D Binary Search Trees element by element. Run animated depth-first traversals (In-order, Pre-order, Post-order) stepping through the recursive call stack.