
Showing 12 results
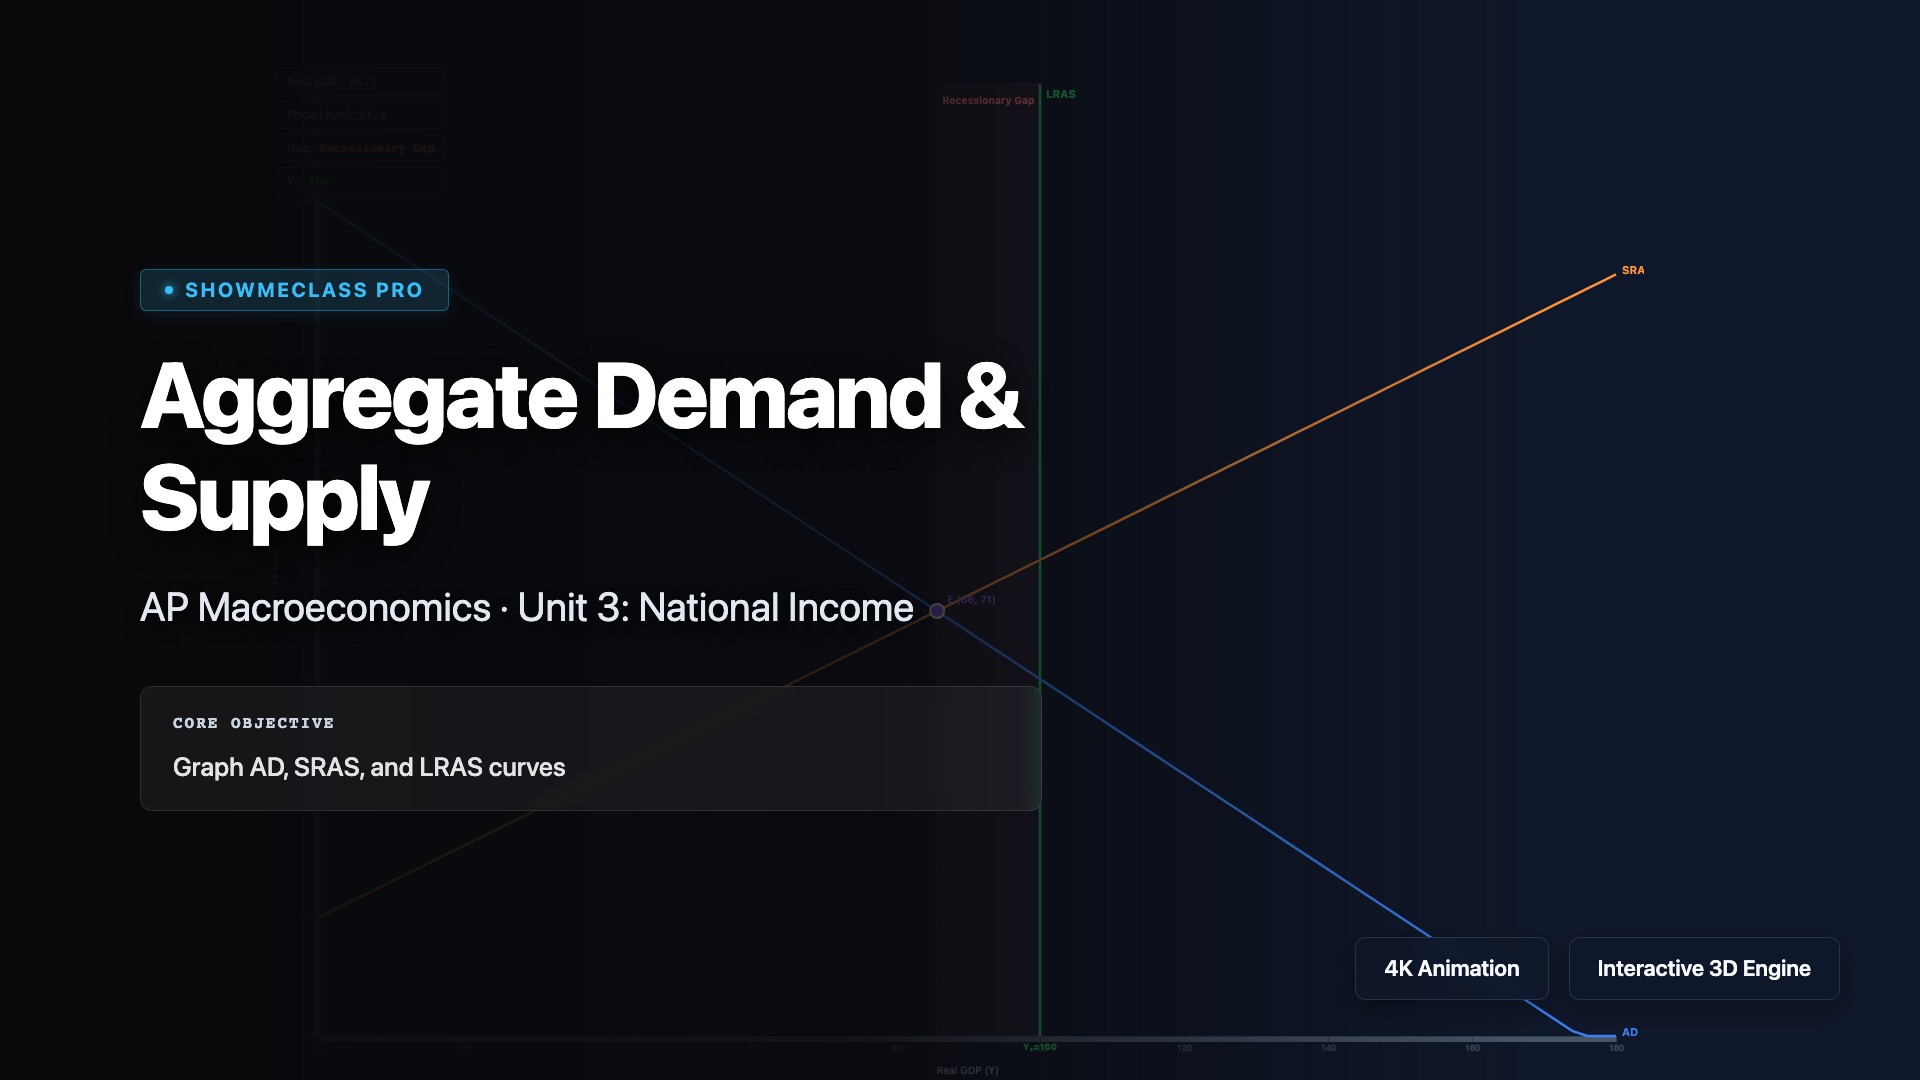
Aggregate Demand & Supply
Analyze the Aggregate Demand-Aggregate Supply (AD-AS) model that shows the relationship between overall price level and real GDP in an economy. Visualize how AD (consumption, investment, government spending, net exports) intersects with short-run and long-run AS to determine equilibrium output and price level. Understand how shifts in AD or AS cause inflation, recession, or economic growth, and how fiscal and monetary policies affect macroeconomic equilibrium.
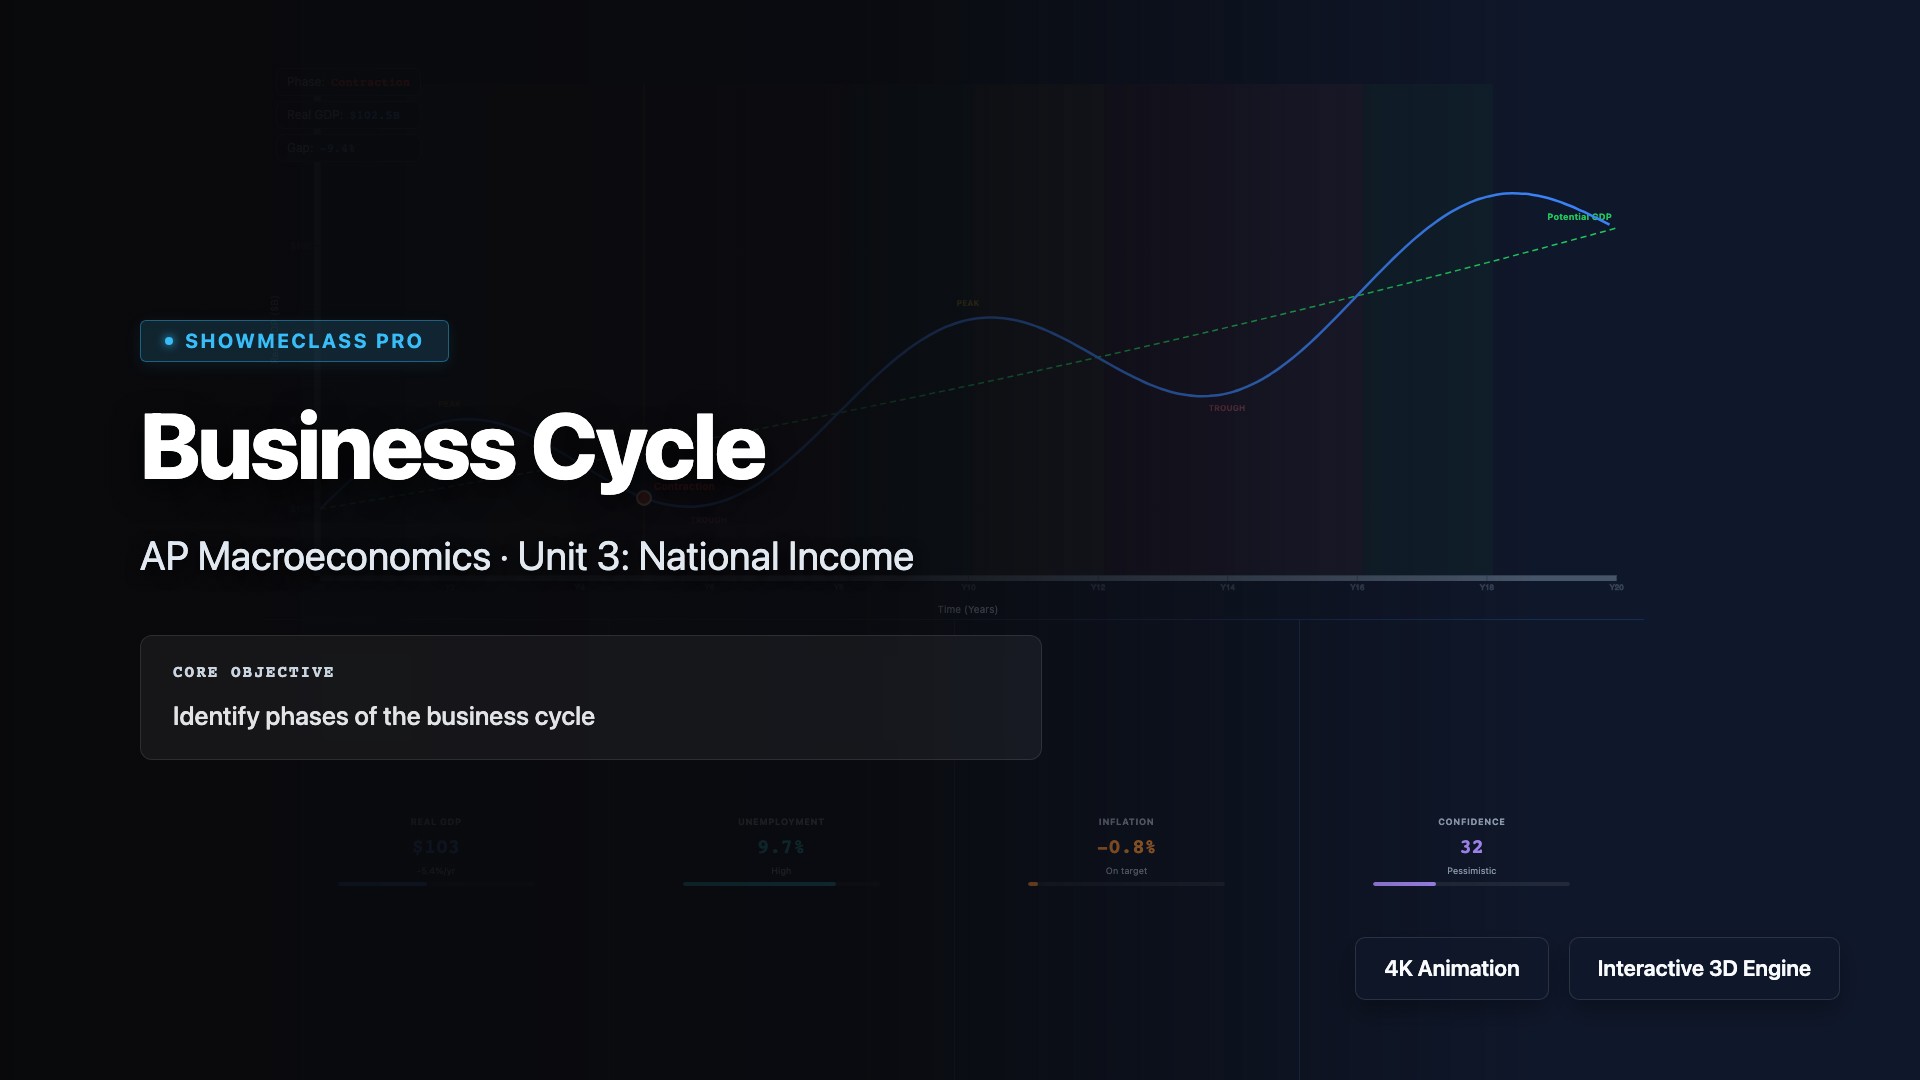
Business Cycle
Visualize the business cycle showing fluctuations in real GDP over time through four phases: expansion (rising GDP, employment, and income), peak (maximum output), contraction/recession (declining GDP for two consecutive quarters), and trough (lowest point). Understand leading indicators (stock market, consumer confidence), coincident indicators (GDP, employment), and lagging indicators (unemployment rate, inflation) used to track economic conditions and predict turning points.
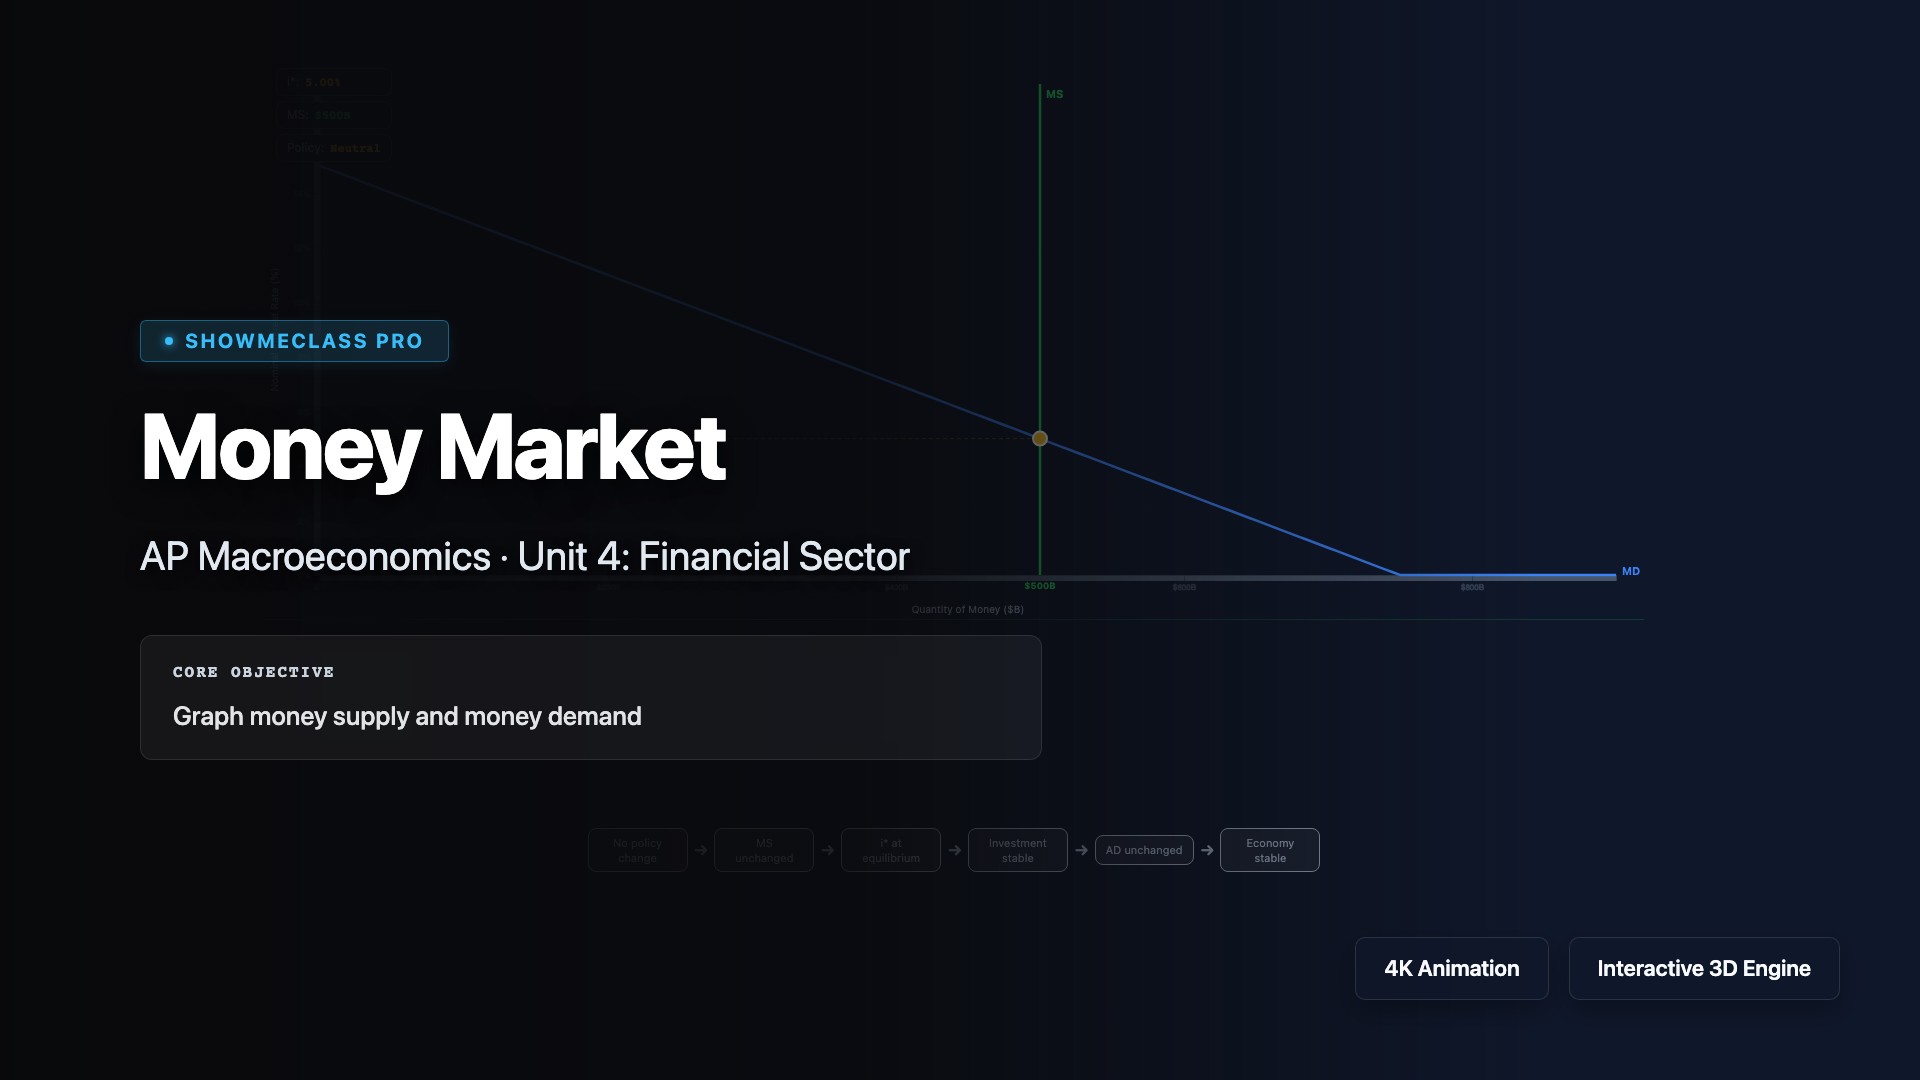
Money Market
Explore the money market where the supply and demand for money determine the nominal interest rate. Visualize how the Federal Reserve controls money supply through open market operations, reserve requirements, and the discount rate. Understand the inverse relationship between bond prices and interest rates, how changes in money supply shift the vertical MS curve, and how the Fed uses monetary policy to influence economic activity, inflation, and employment.
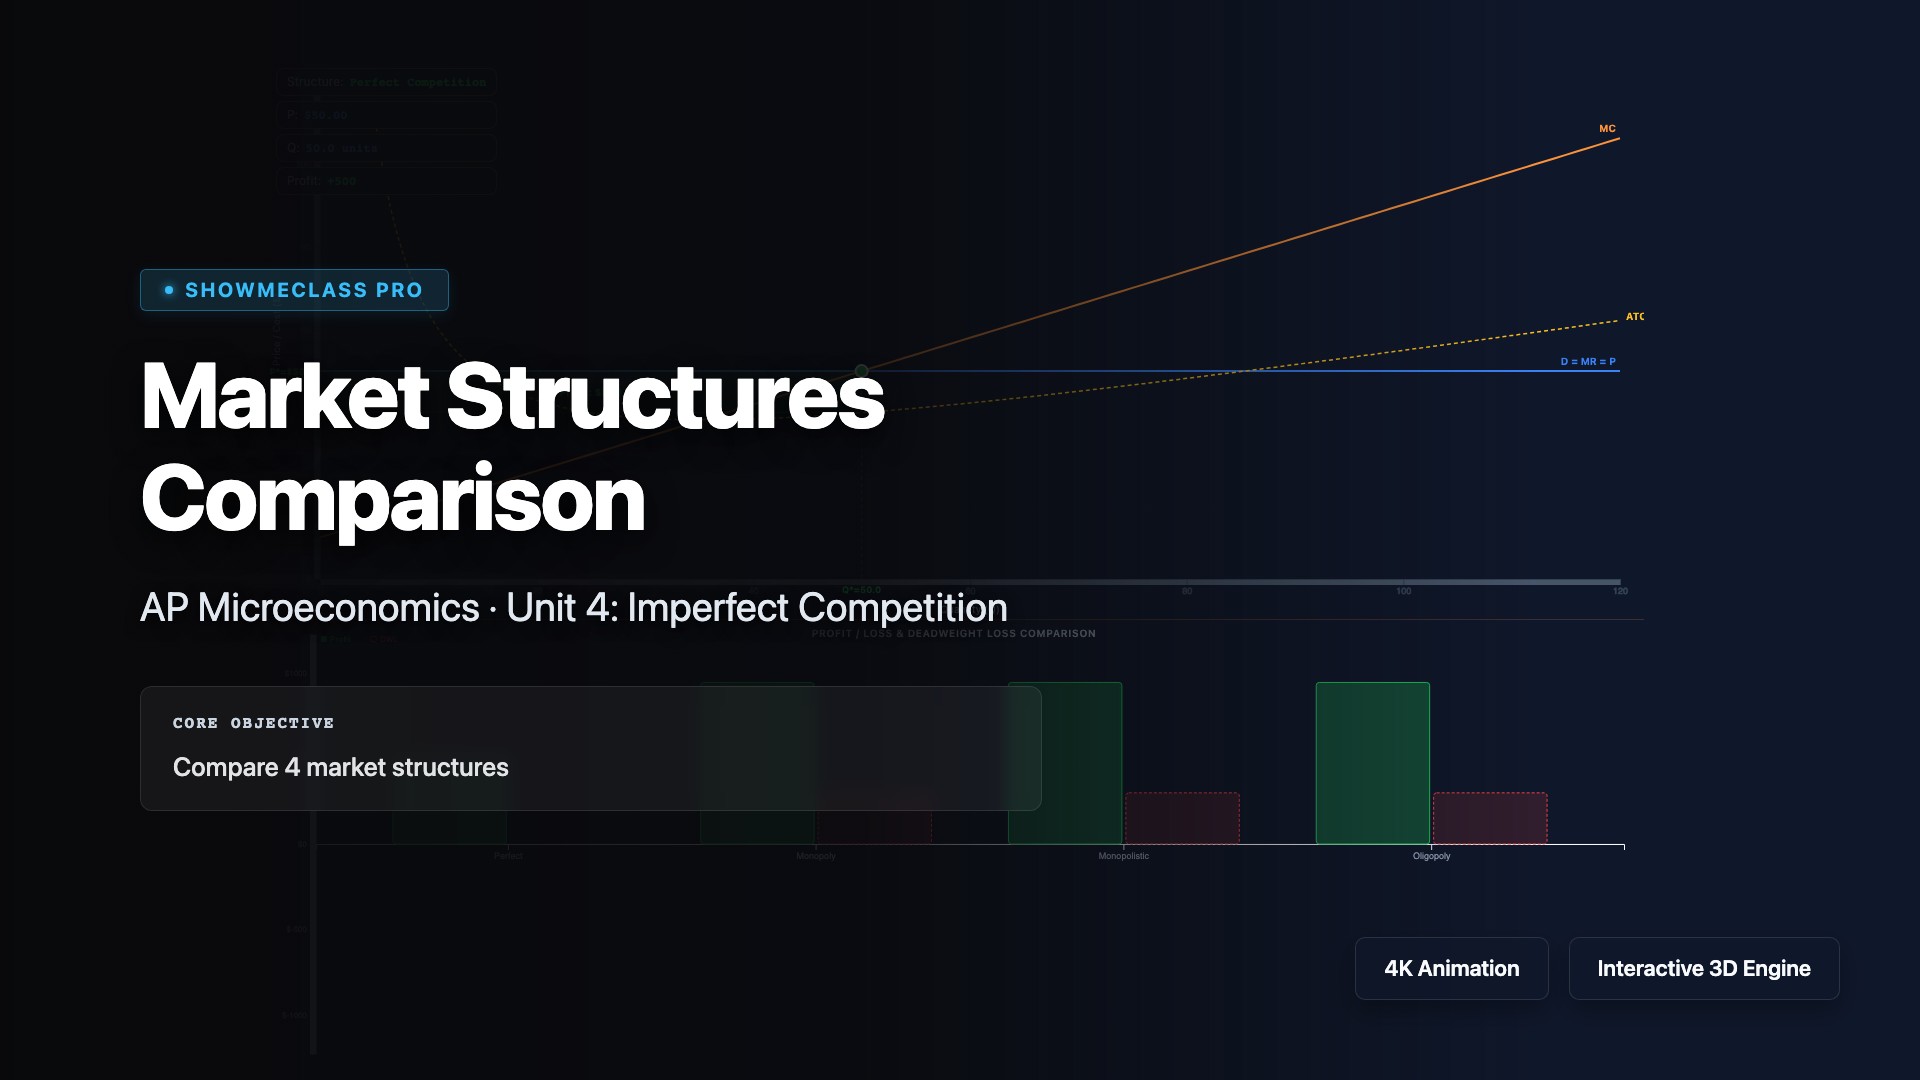
Market Structures Comparison
Compare the four market structures: perfect competition (many firms, identical products, price takers), monopolistic competition (many firms, differentiated products, some price control), oligopoly (few firms, interdependent decisions, strategic behavior), and monopoly (single firm, unique product, price maker). Understand how each structure determines pricing using MR=MC, barriers to entry, long-run economic profit, and efficiency outcomes for consumers and society.
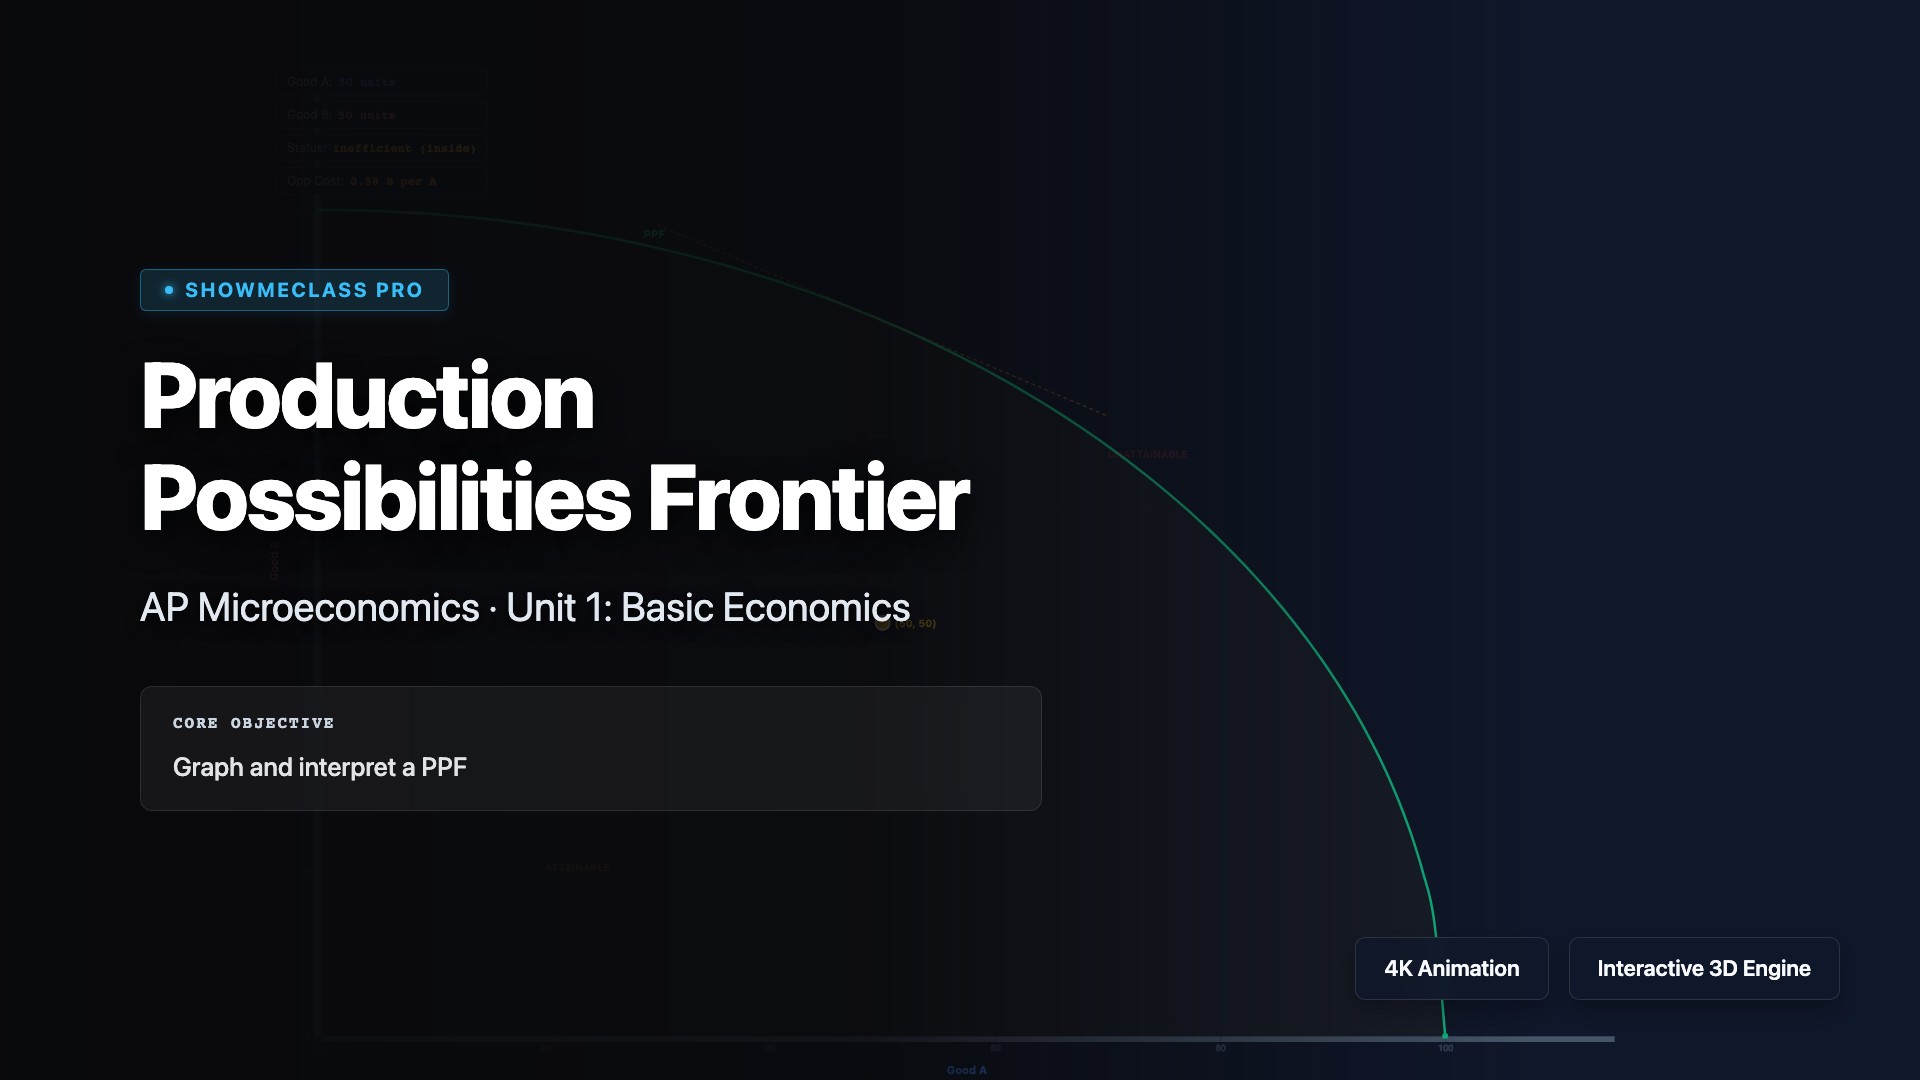
Production Possibilities Frontier
Explore the Production Possibilities Frontier (PPF) curve showing the maximum combinations of two goods an economy can produce with limited resources. Understand opportunity cost (the slope of the PPF), efficiency (points on the curve), inefficiency (points inside), and impossibility (points outside). Visualize how economic growth shifts the PPF outward, and how the law of increasing opportunity costs creates the bowed-out shape as resources are reallocated.
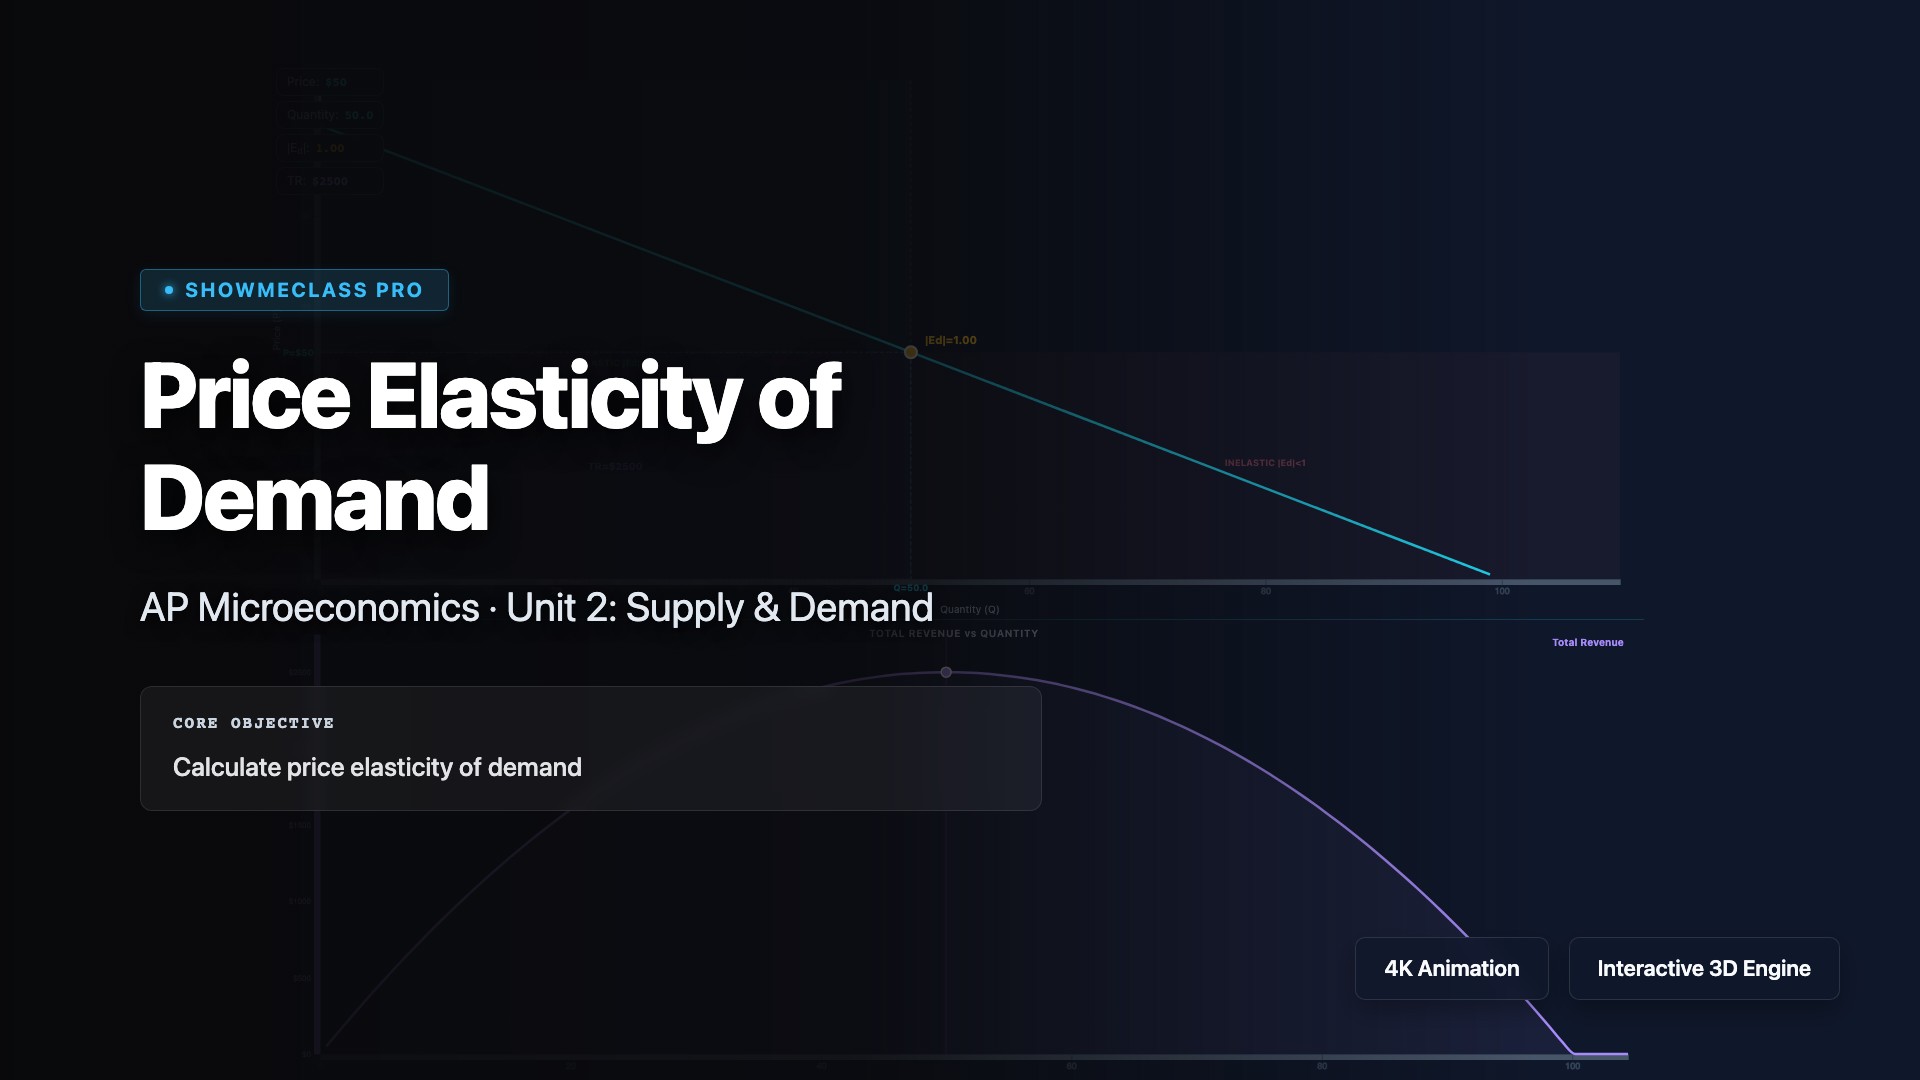
Price Elasticity of Demand
Analyze price elasticity of demand (PED) measuring how quantity demanded responds to price changes using the formula %ΔQd / %ΔP. Classify demand as elastic (|PED| > 1, price changes significantly affect quantity), inelastic (|PED| < 1, quantity relatively unresponsive), or unit elastic (|PED| = 1). Understand how elasticity affects total revenue: price increases raise revenue for inelastic goods but lower revenue for elastic goods. Explore determinants including substitutes, necessity, and time horizon.
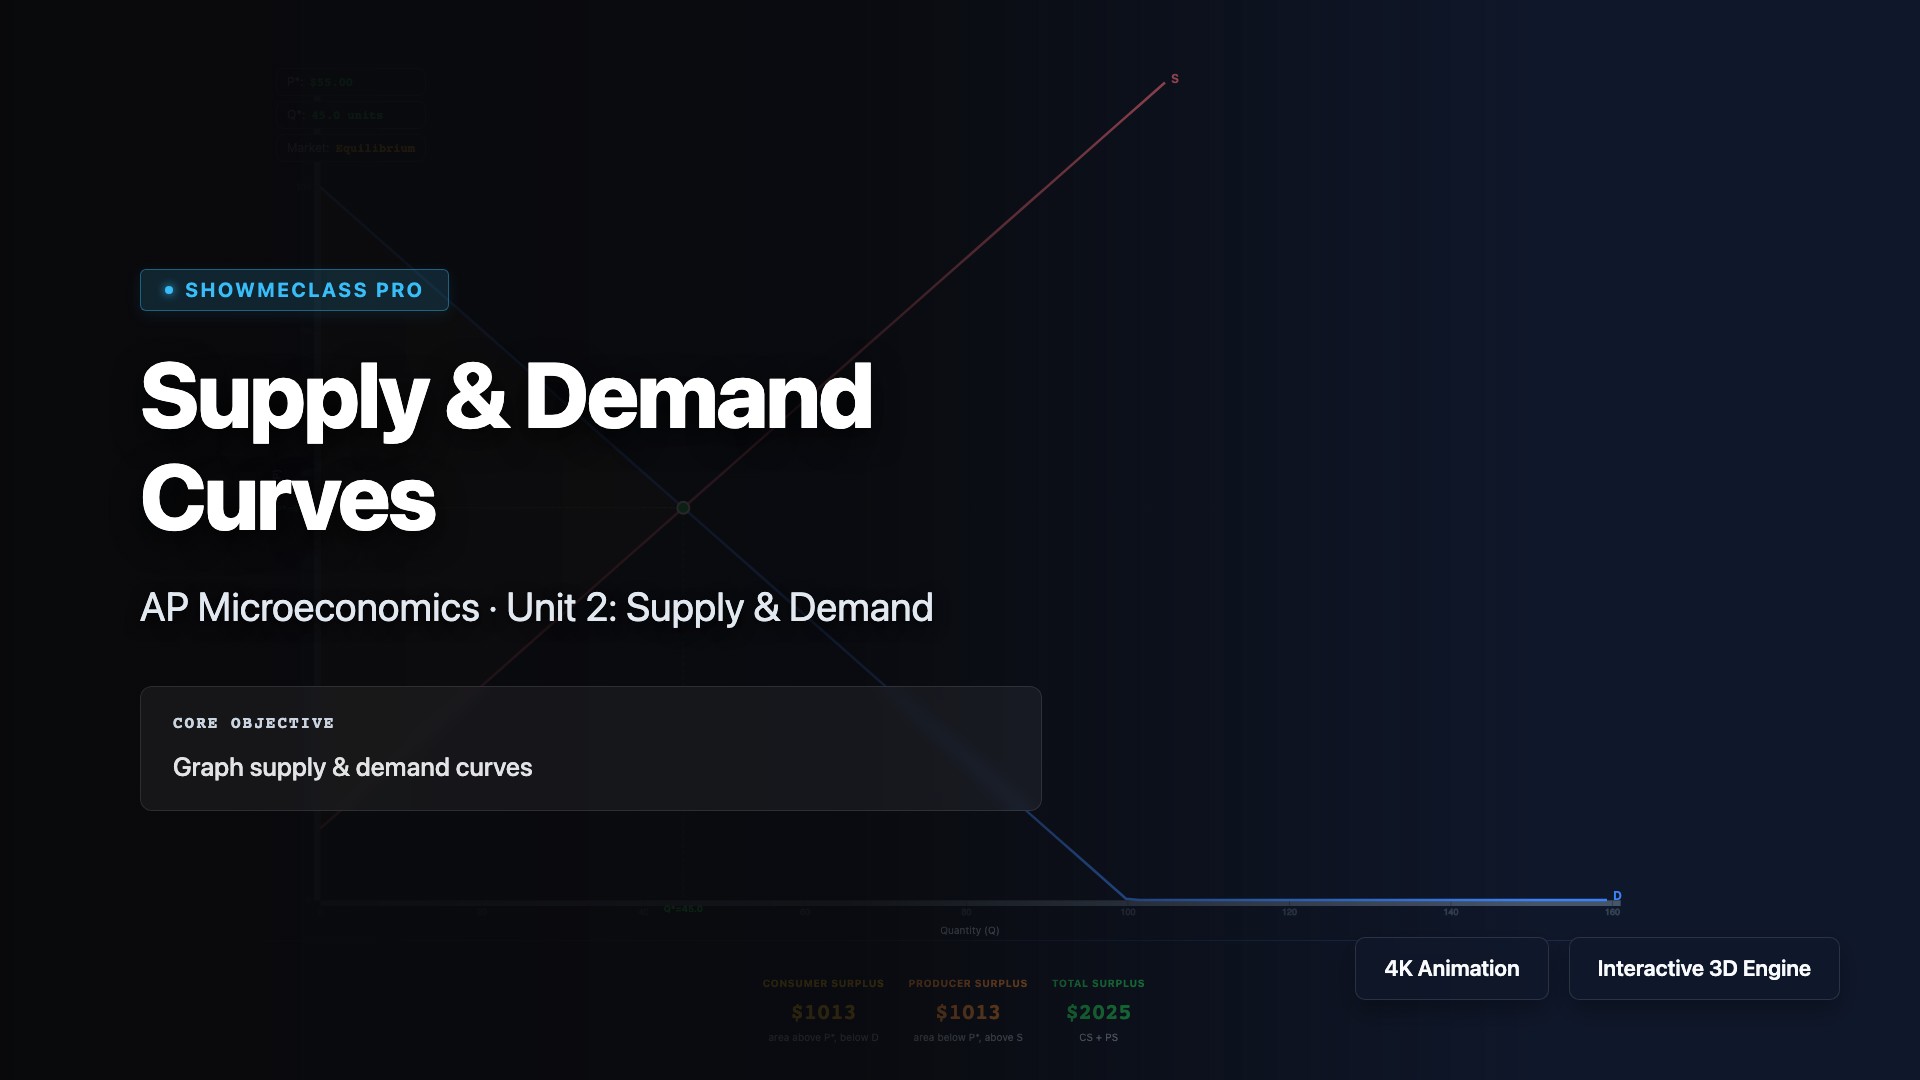
Supply & Demand Curves
Visualize supply and demand curves intersecting at market equilibrium where quantity supplied equals quantity demanded. Explore the law of demand (inverse price-quantity relationship) and law of supply (direct price-quantity relationship). Understand how shifts in demand (income, preferences, related goods) or supply (input costs, technology, expectations) create shortages or surpluses that drive price adjustments back to equilibrium. Practice analyzing how market forces allocate scarce resources efficiently.
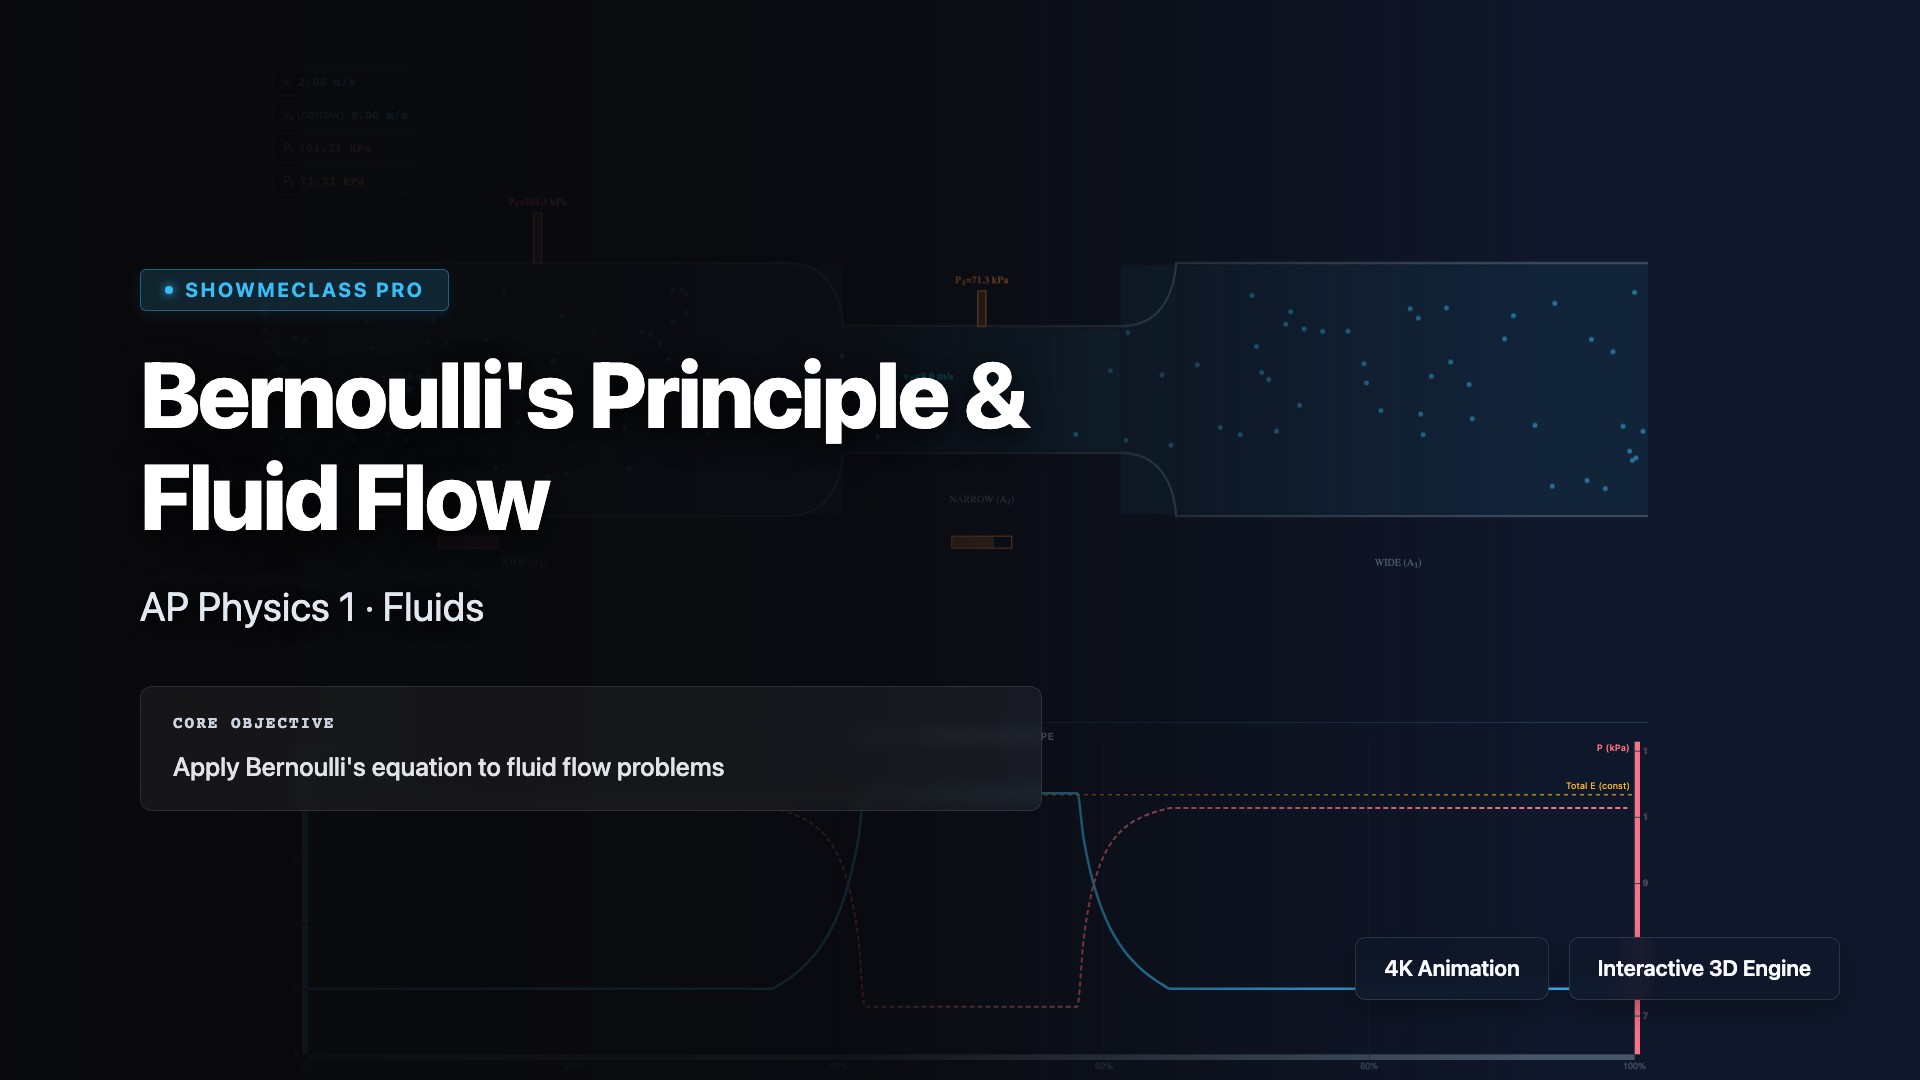
Bernoulli's Principle & Fluid Flow
Explore Bernoulli's principle stating that as fluid velocity increases, pressure decreases, derived from energy conservation in flowing fluids. Visualize the equation P + ½ρv² + ρgh = constant along a streamline. Understand applications including airplane lift (faster airflow over curved wing creates lower pressure), venturi effect in carburetors, and how the continuity equation A₁v₁ = A₂v₂ relates to Bernoulli's principle in explaining fluid behavior through varying pipe diameters.
Binary Star System (Barycenter Orbits)
Interactive 3D simulation of a binary star system. Understand center of mass (barycenter), orbital periods, and universal gravitation.

Conservation of Energy
Visualize the law of conservation of energy stating that total mechanical energy (kinetic + potential) remains constant in isolated systems without friction. Explore energy transformations between gravitational potential energy (mgh), elastic potential energy (½kx²), and kinetic energy (½mv²). Understand how work done by non-conservative forces like friction converts mechanical energy to thermal energy, and apply energy conservation to solve problems involving pendulums, roller coasters, and springs.

Elastic & Inelastic Collisions
Compare elastic collisions (both momentum and kinetic energy conserved) with inelastic collisions (only momentum conserved, kinetic energy lost to deformation, heat, sound). Visualize perfectly inelastic collisions where objects stick together after impact. Apply conservation of momentum p₁ᵢ + p₂ᵢ = p₁f + p₂f to calculate final velocities. Understand the coefficient of restitution, and analyze real-world collisions including car crashes, billiard balls, and atomic particle interactions.
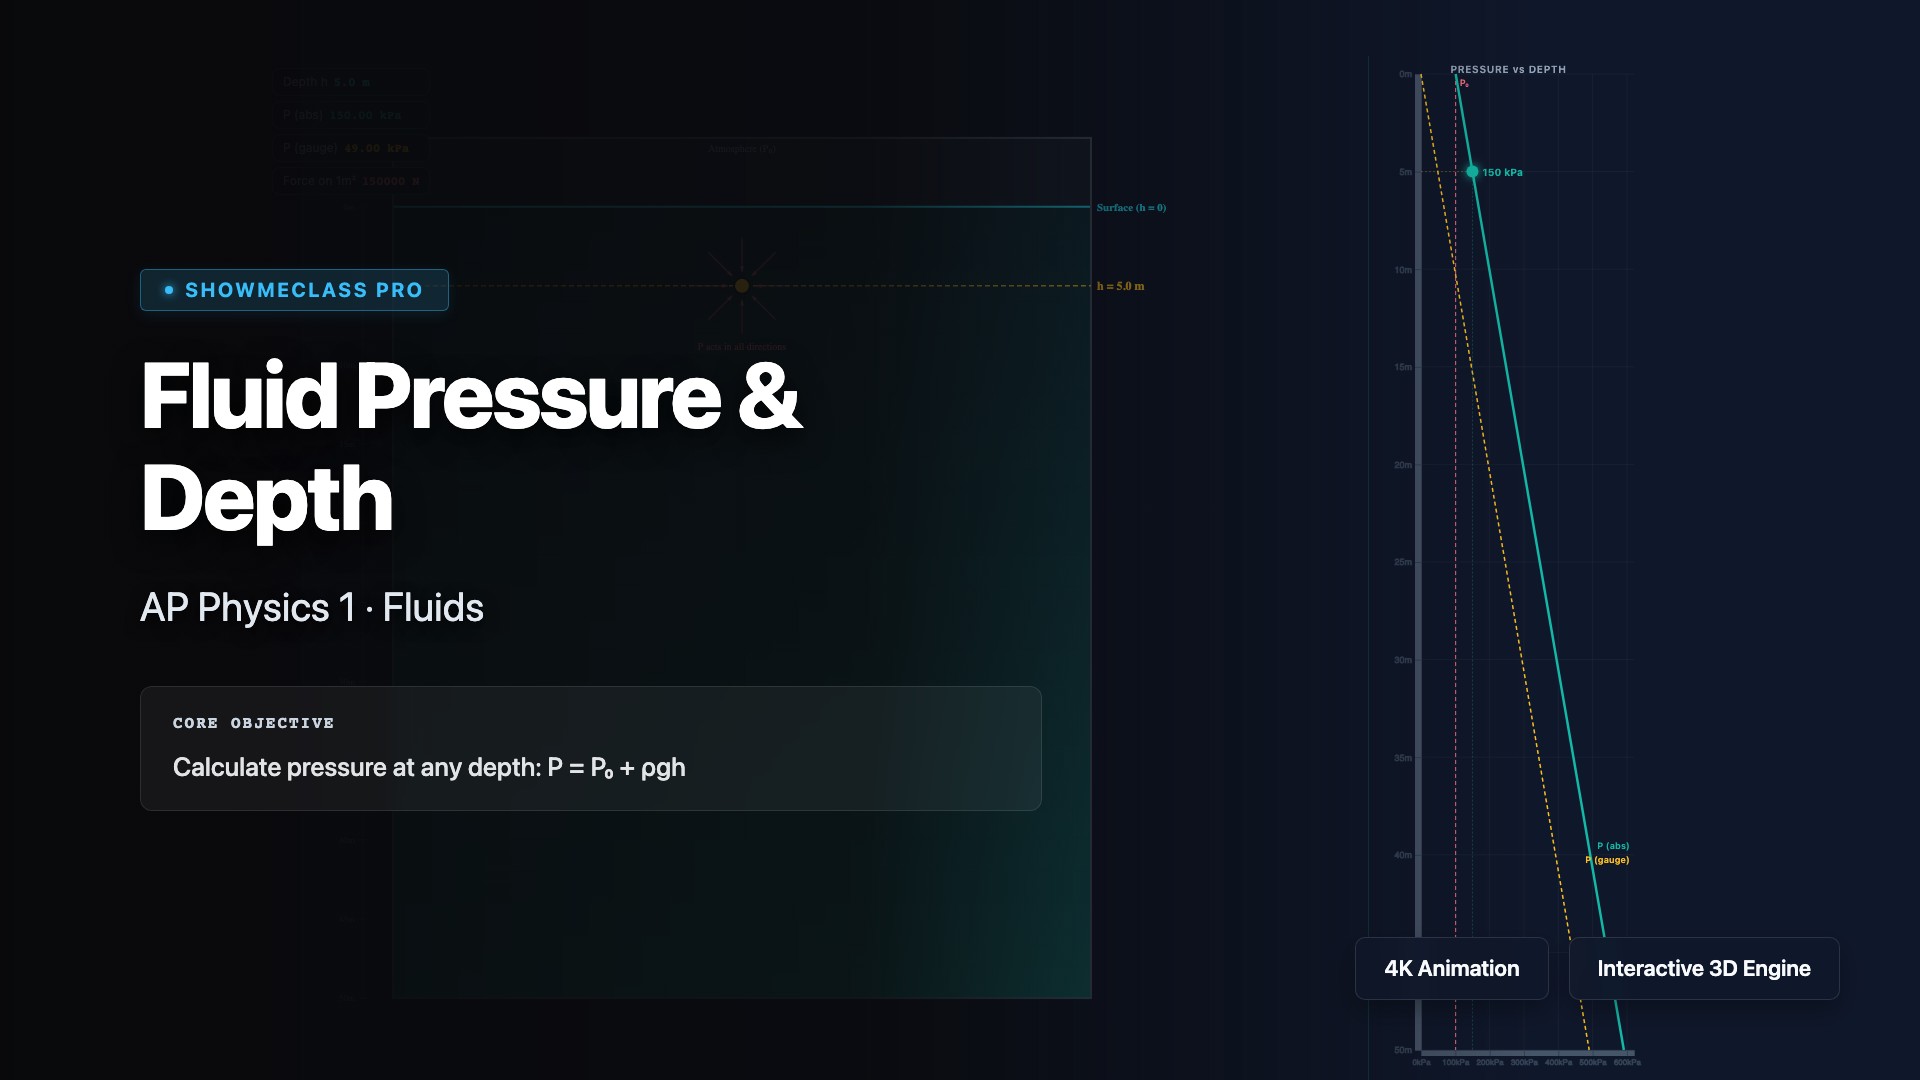
Fluid Pressure & Depth
Explore how fluid pressure increases with depth according to P = P₀ + ρgh, where P₀ is atmospheric pressure, ρ is fluid density, g is gravitational acceleration, and h is depth. Understand Pascal's principle stating that pressure applied to a confined fluid is transmitted equally throughout the fluid. Visualize applications including hydraulic lifts, dam design, submarine pressure limits, and why water pressure increases as divers descend deeper underwater.