
Showing 12 results
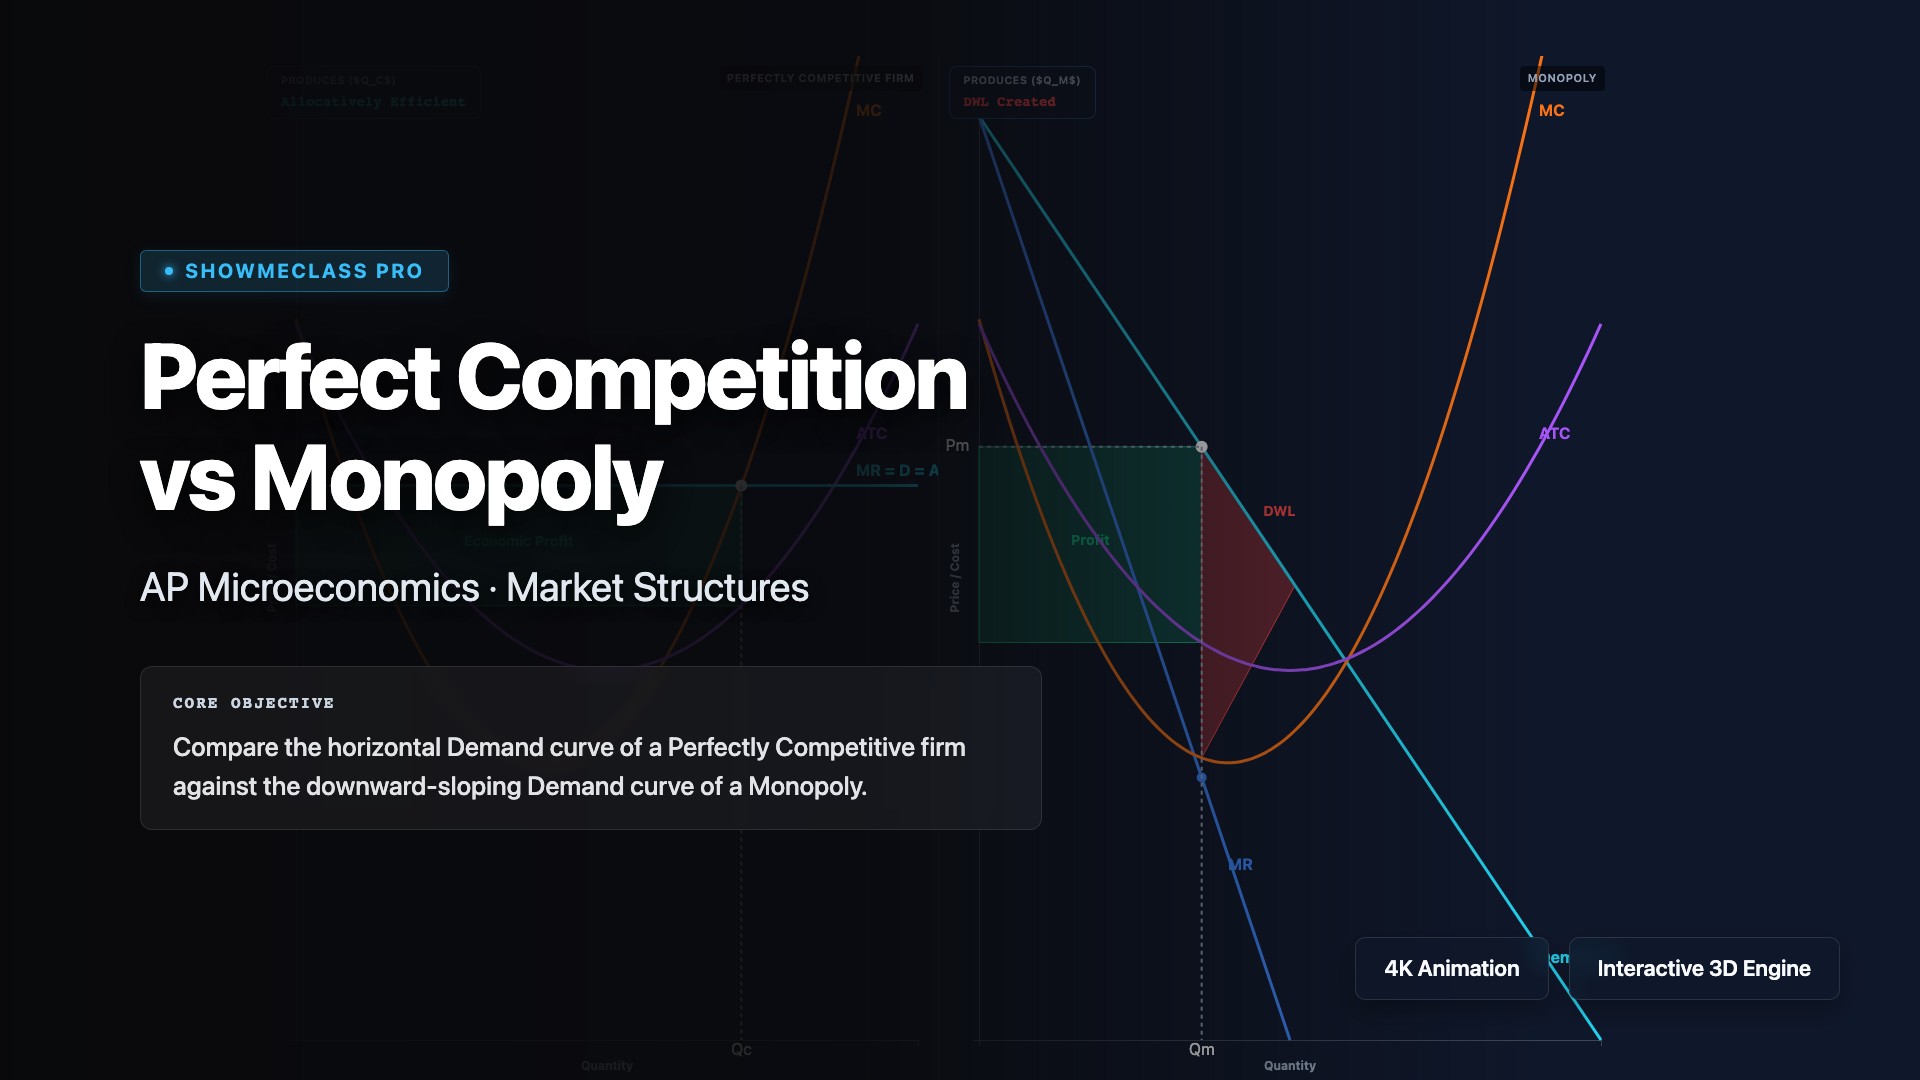
Perfect Competition vs Monopoly
Compare the horizontal Demand curve of a Perfectly Competitive firm against the downward-sloping Demand curve of a Monopoly to locate Deadweight Loss (DWL).
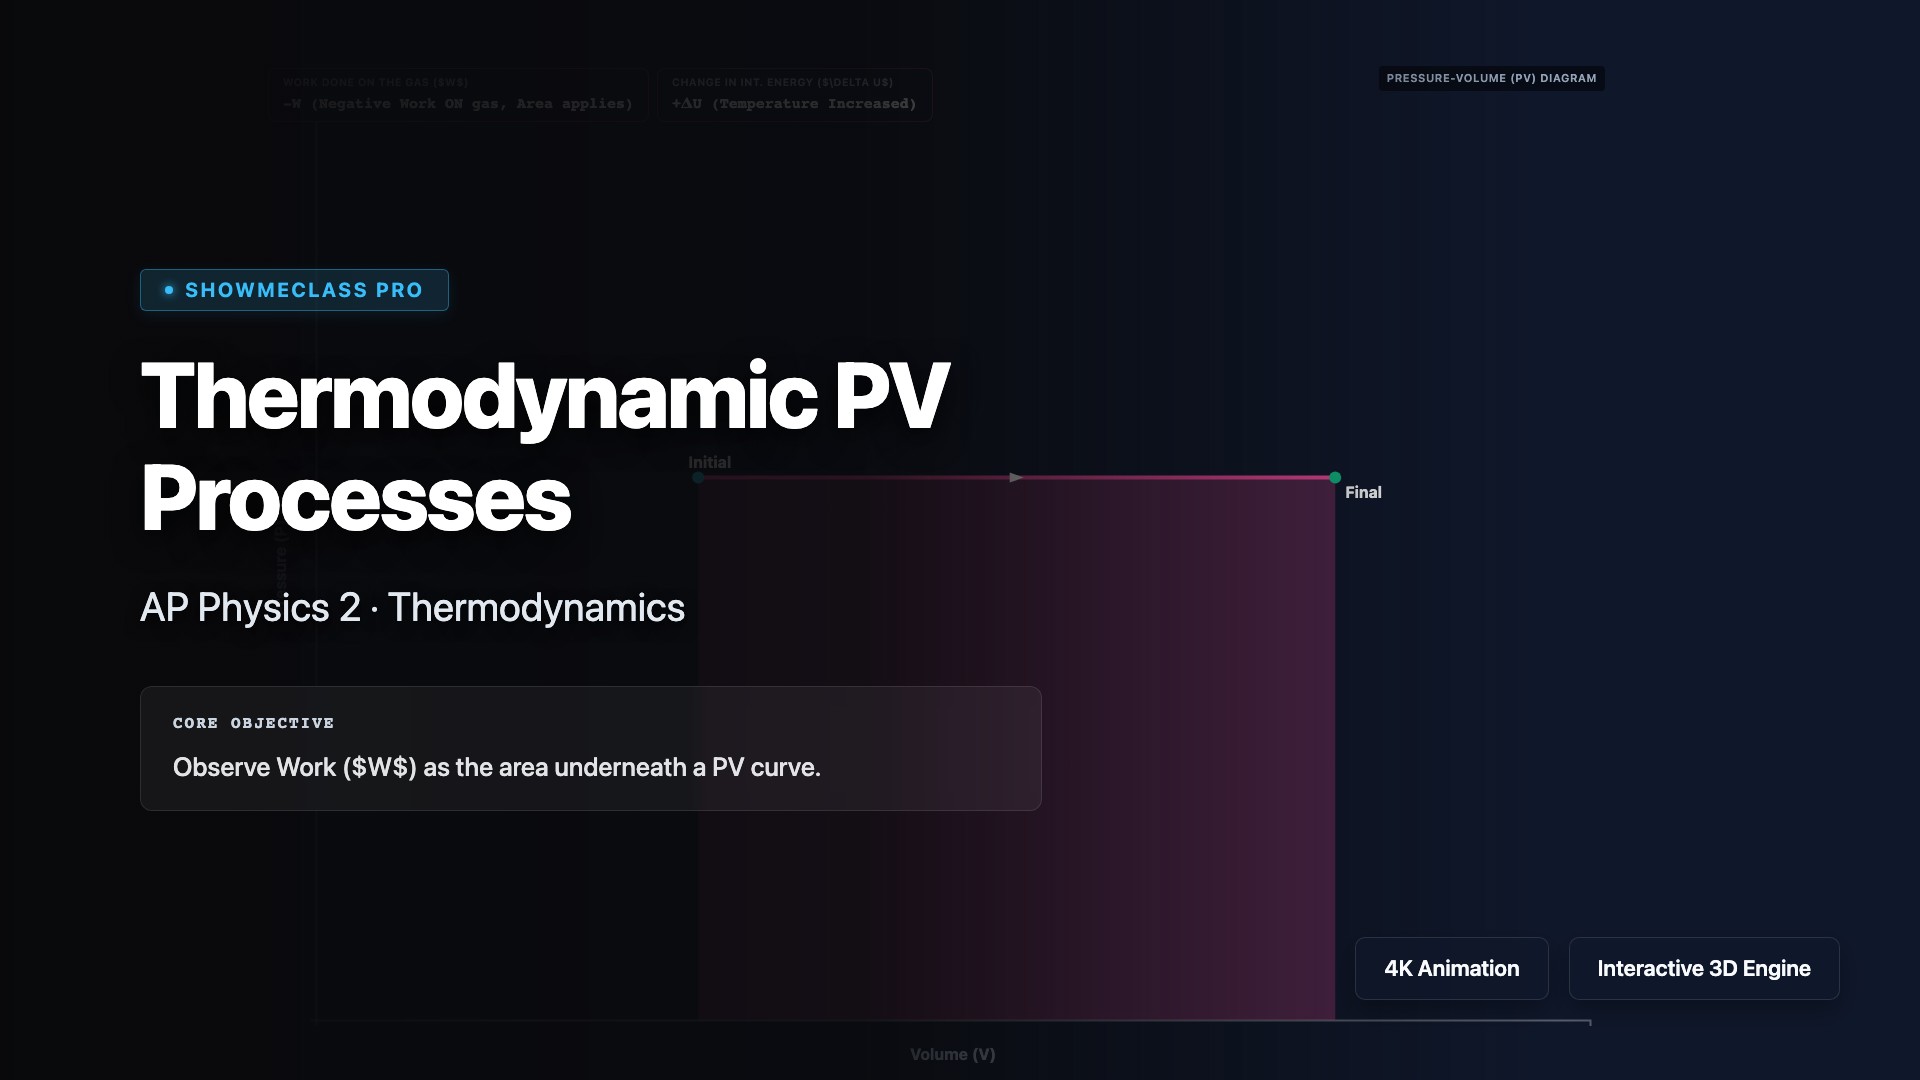
Isobaric & Isochoric PV Processes
Visualize work as the area underneath a PV curve. Discover why an Isochoric process performs zero work while an Isobaric process expands or compresses.

Recursive Fibonacci Call Tree
Visualize how a single recursive method spawns a massive Call Tree of overlapping sub-problems. Observe exponential O(2^n) inefficiency.

How a Bill Becomes a Law
Navigate the legislative obstacle course. Understand the complex pipeline designed by the founders to filter out and kill most legislation before reaching the President.
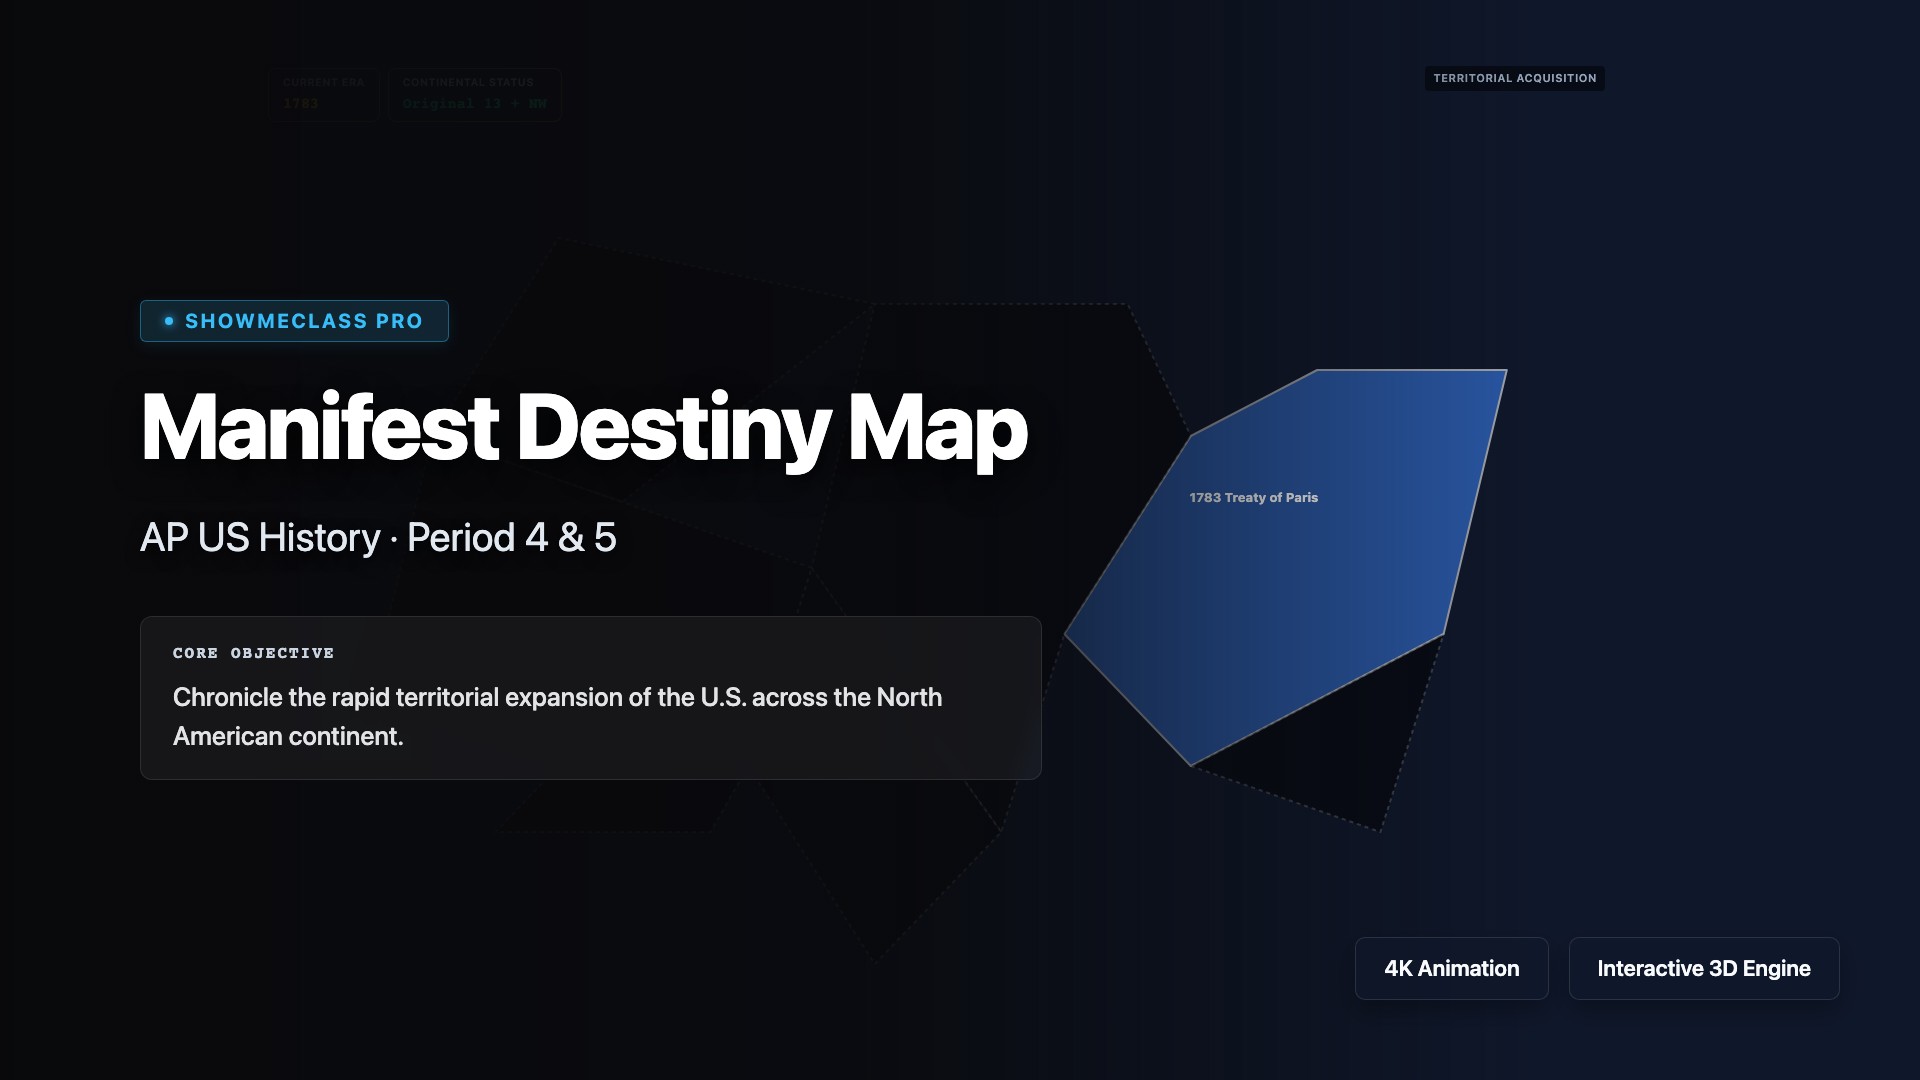
Manifest Destiny Map
Visualize the territorial expansion of the U.S. across North America and understand how each acquisition ignited debates over slavery.
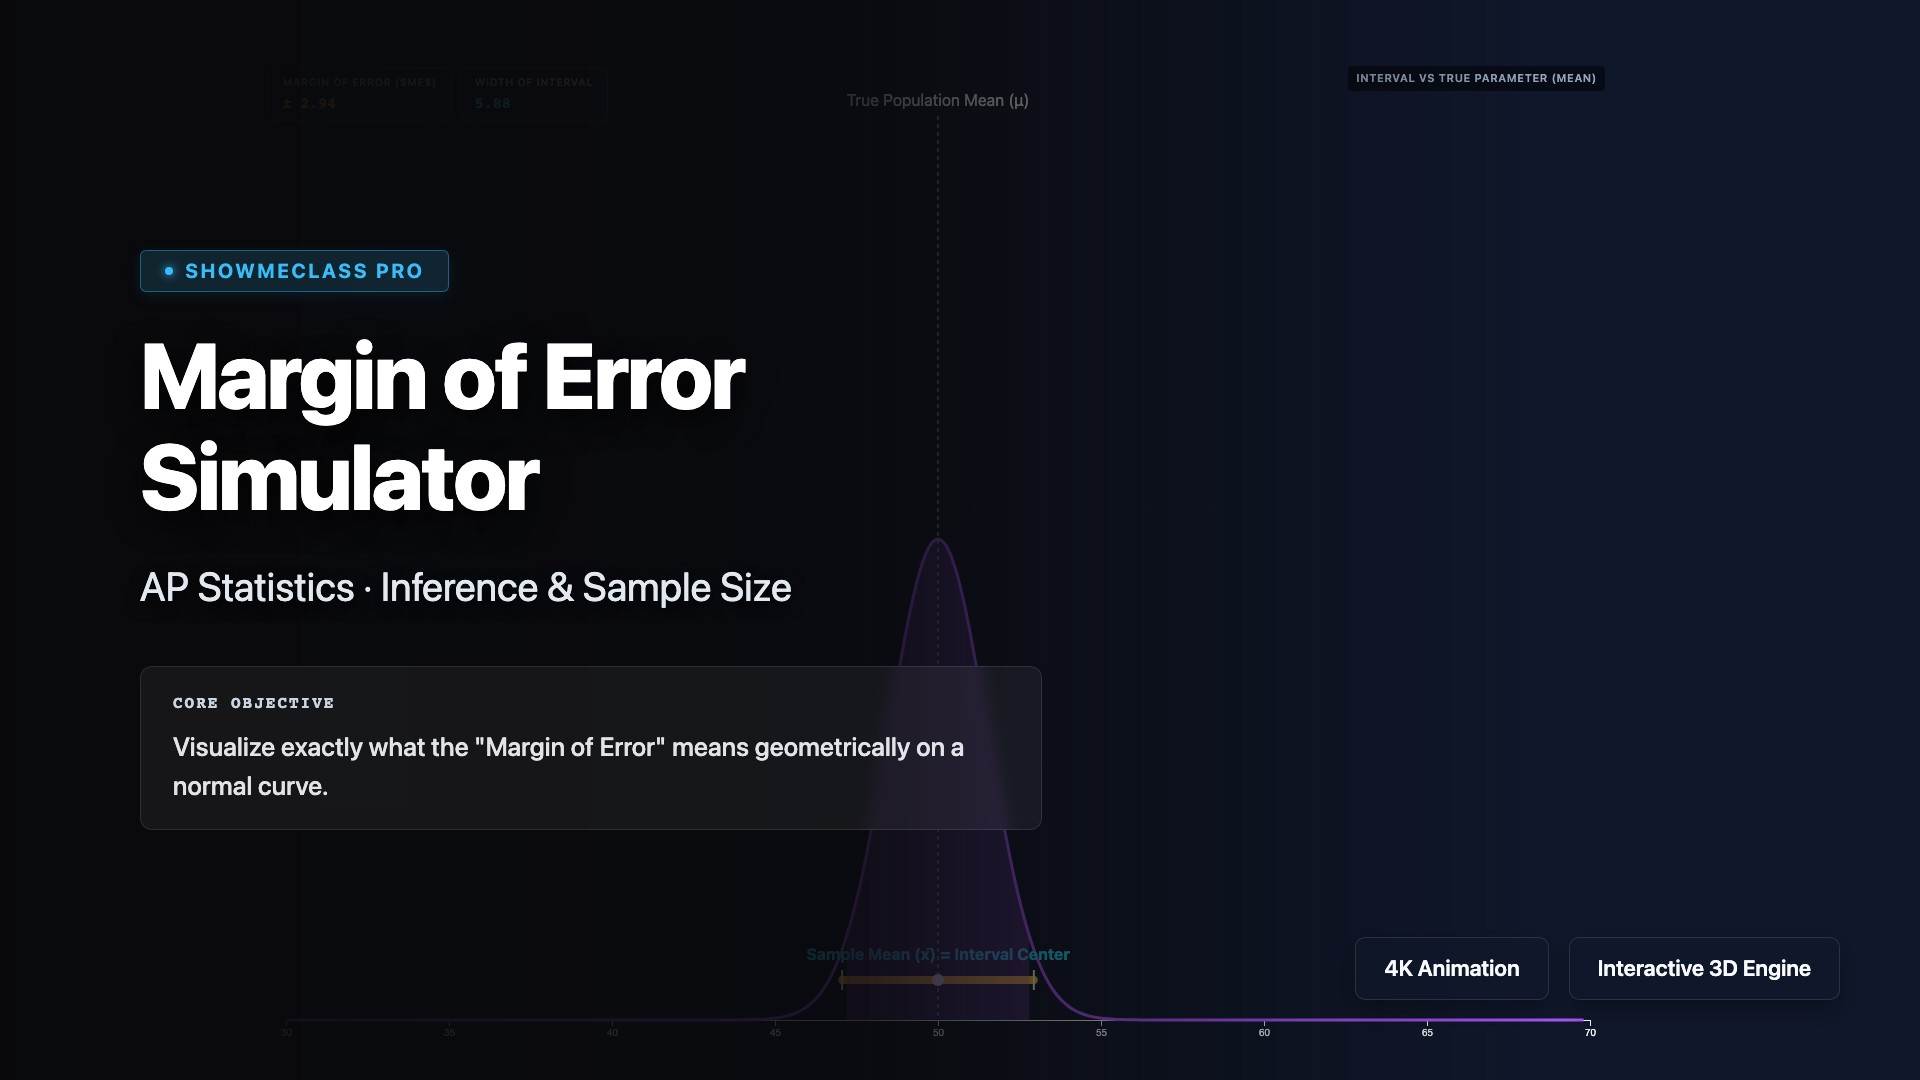
Margin of Error Simulator
Visualize exactly what the Margin of Error means geometrically. Observe how increasing sample size shrinks it while demanding higher confidence widens it.
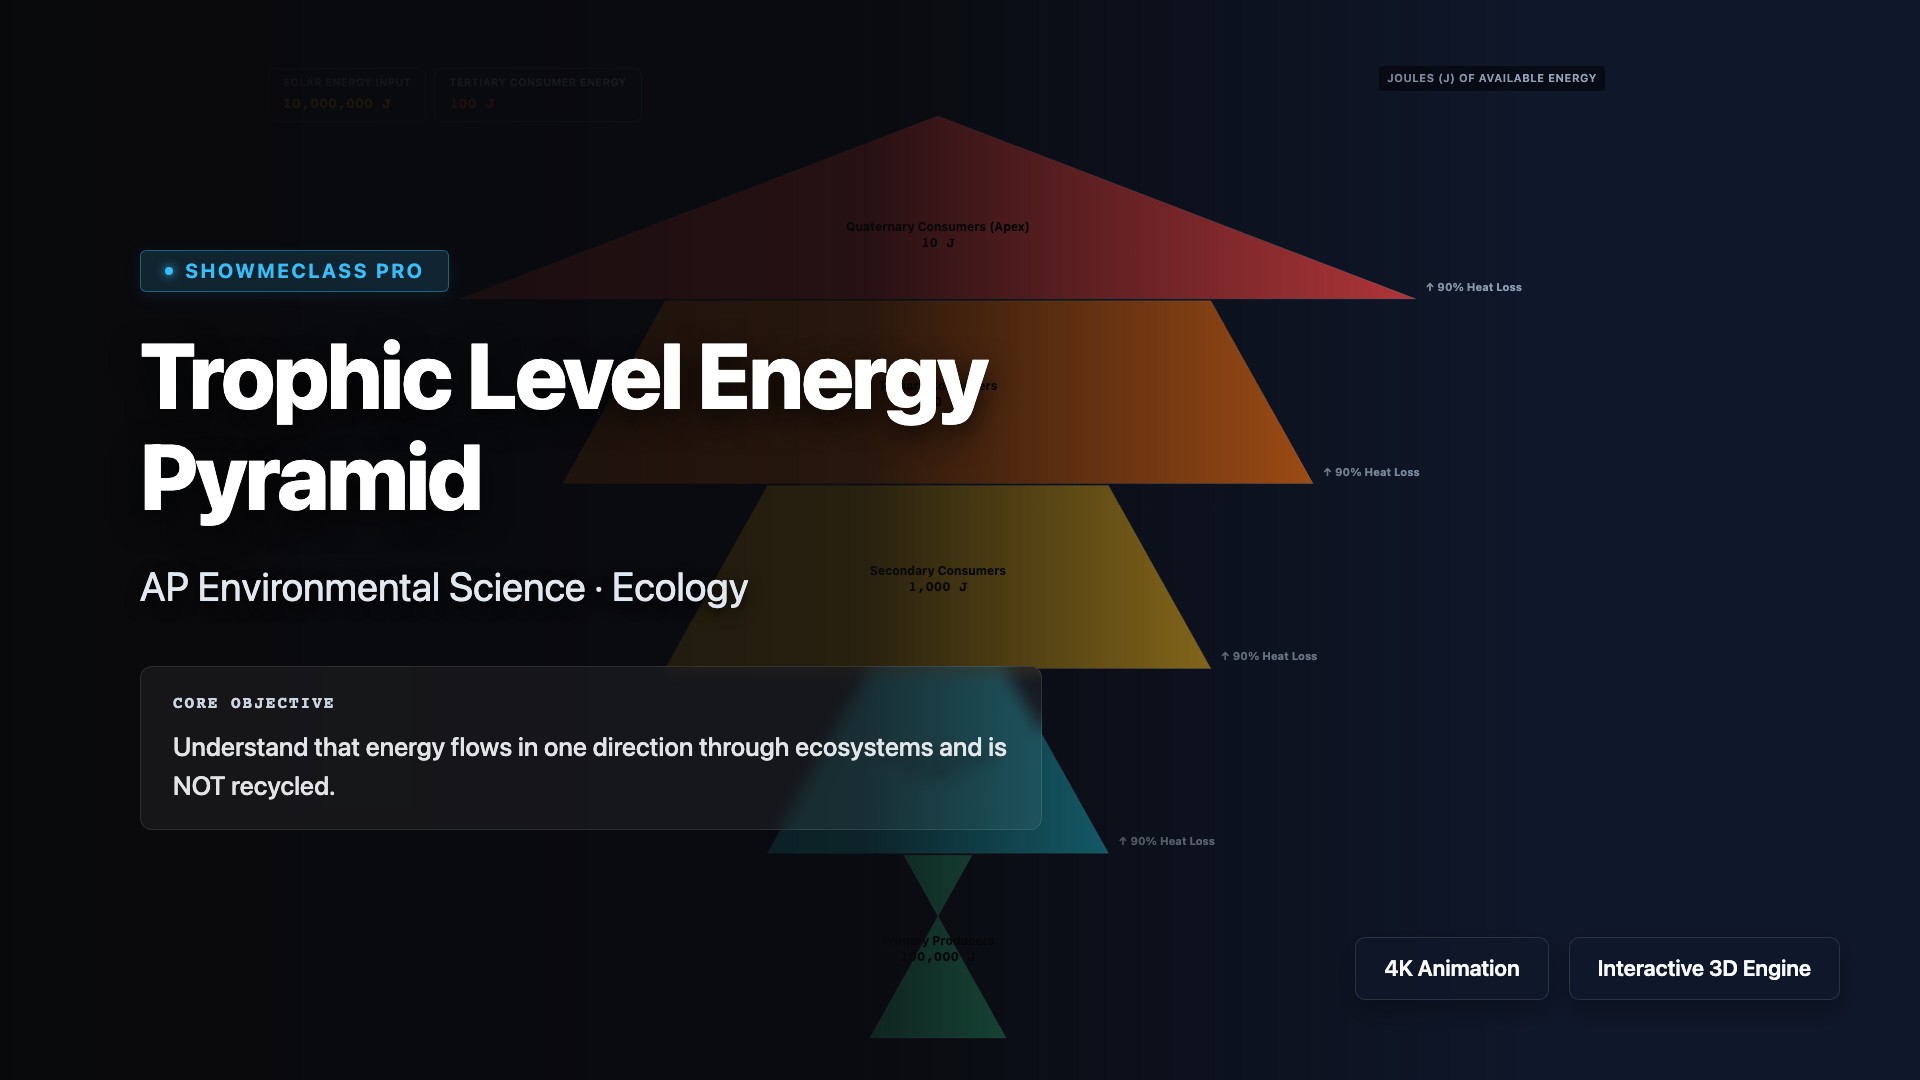
Trophic Energy Pyramid
Observe the 10% Rule in action: Energy flows in one direction and 90% is lost at each step, explaining why ecosystems rarely support chains longer than 5 levels.
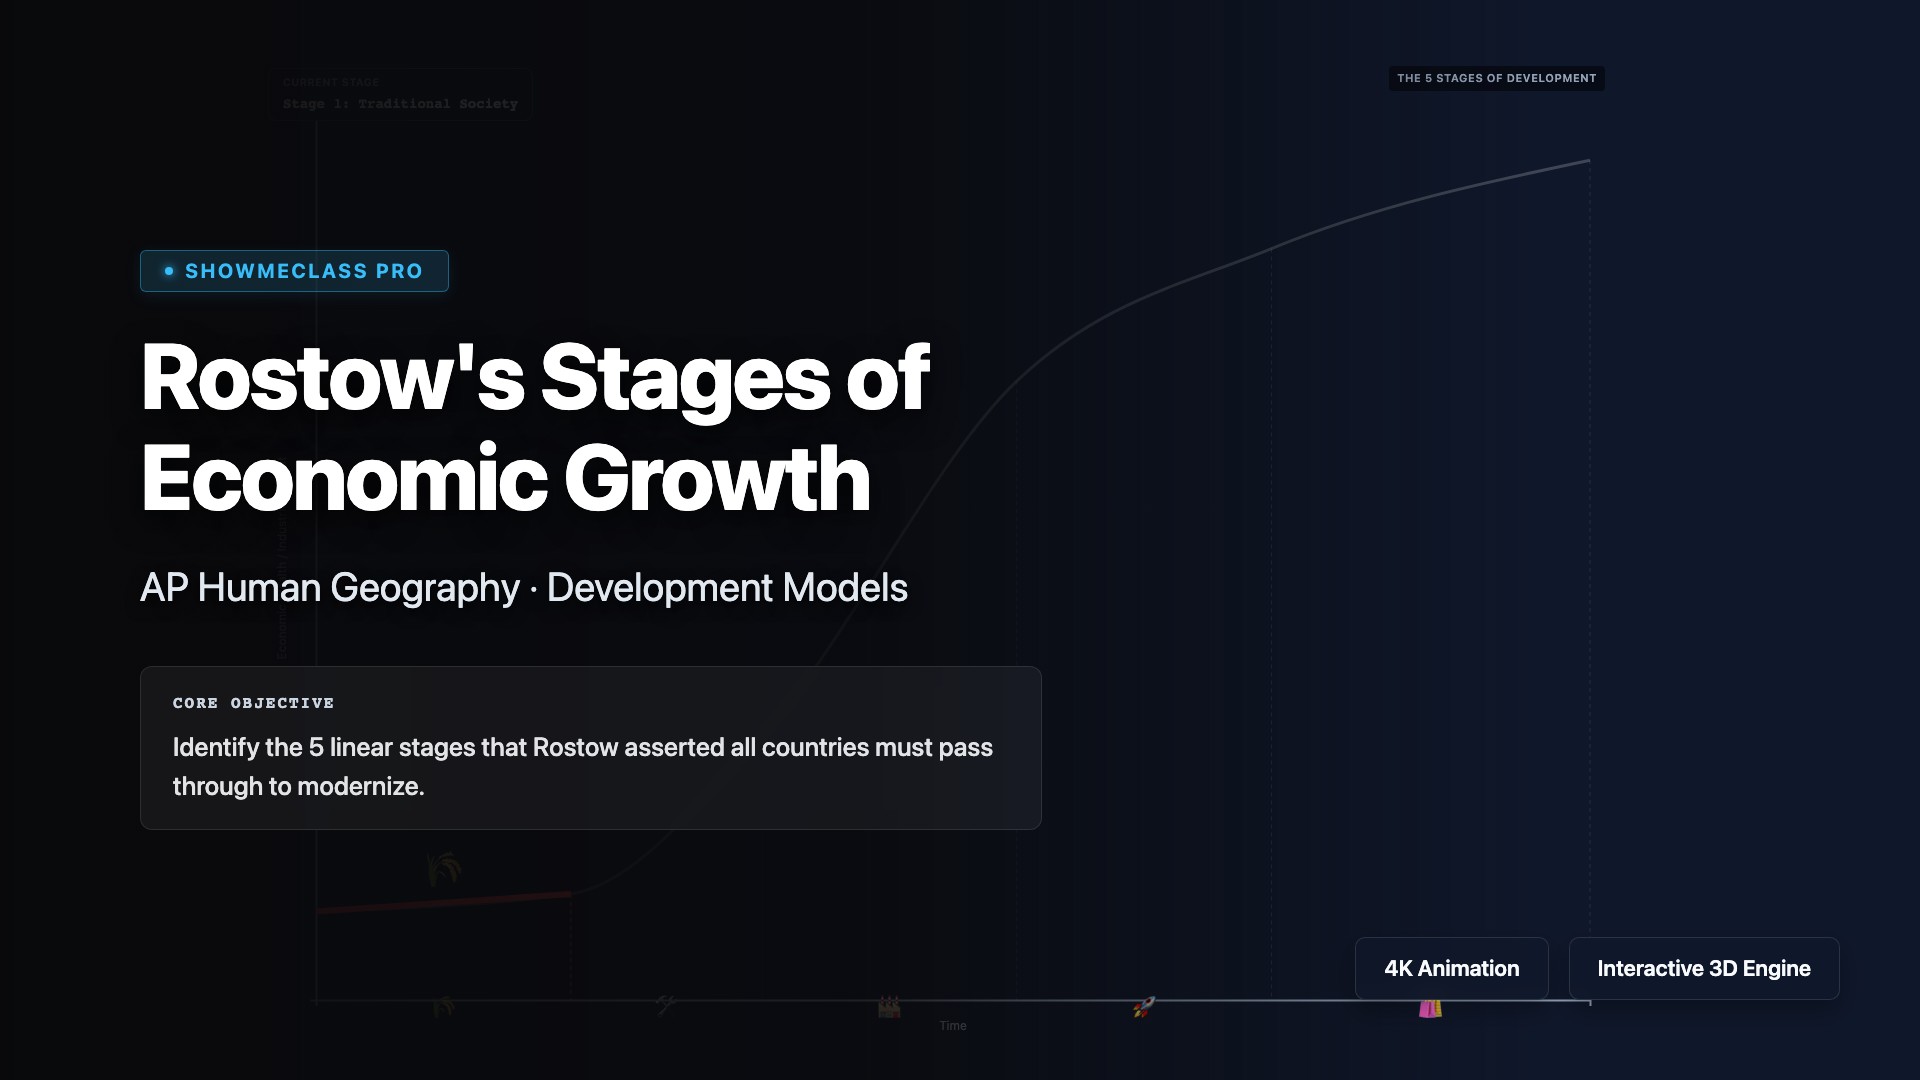
Rostow's Stages of Growth
Navigate the 5 linear stages W.W. Rostow asserted all countries must pass through to modernize, from Traditional Society to High Mass Consumption.
Limits & Continuity Explorer
Interactive limit evaluation (left-hand, right-hand, absolute) and 3-step continuity logical check tool simulating removable, jump, infinite, and oscillating discontinuities.
Definition of the Derivative
Interactive secant-to-tangent limit convergence visualizing the formal definition of the derivative with dynamic dx collapsing.
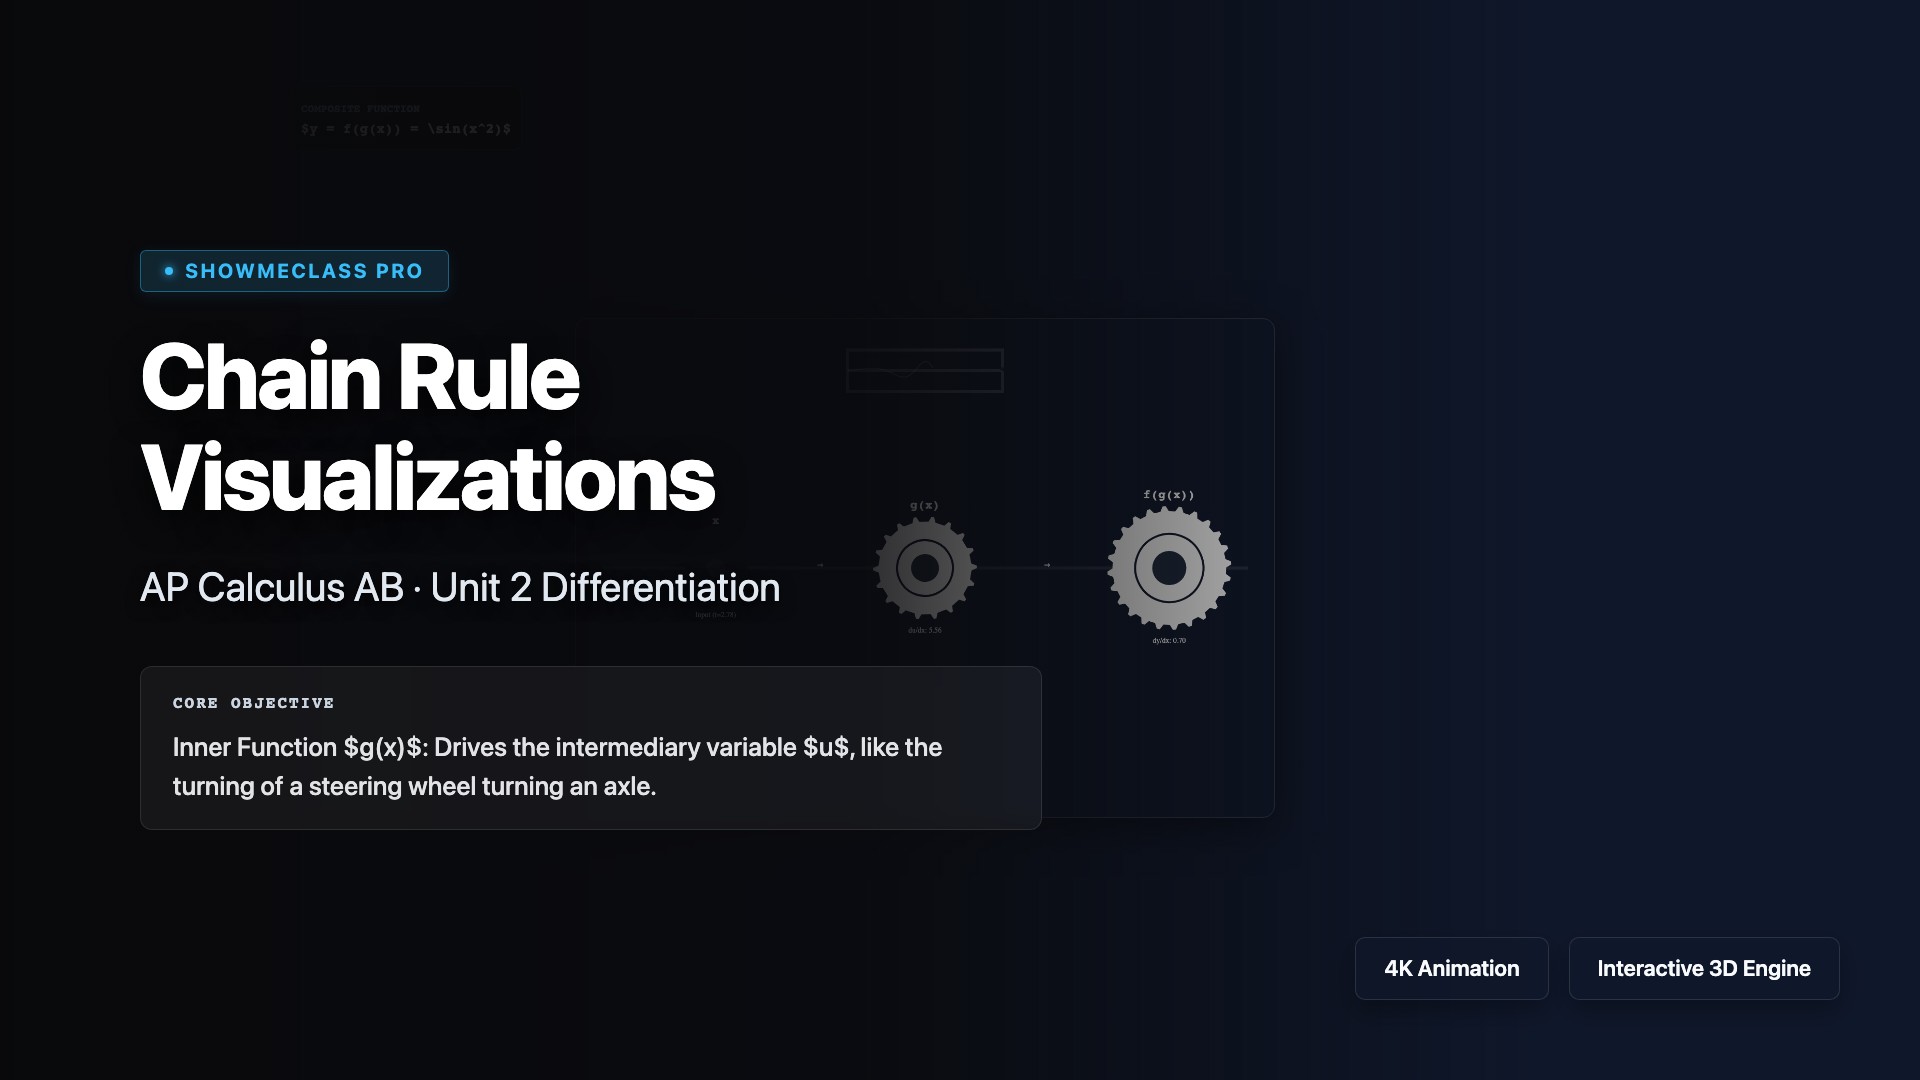
Chain Rule Visualizations
Mechanical gear visualization translating the abstract composite derivative multiplication f'(g(x)) * g'(x) into physical rotational interlocking.
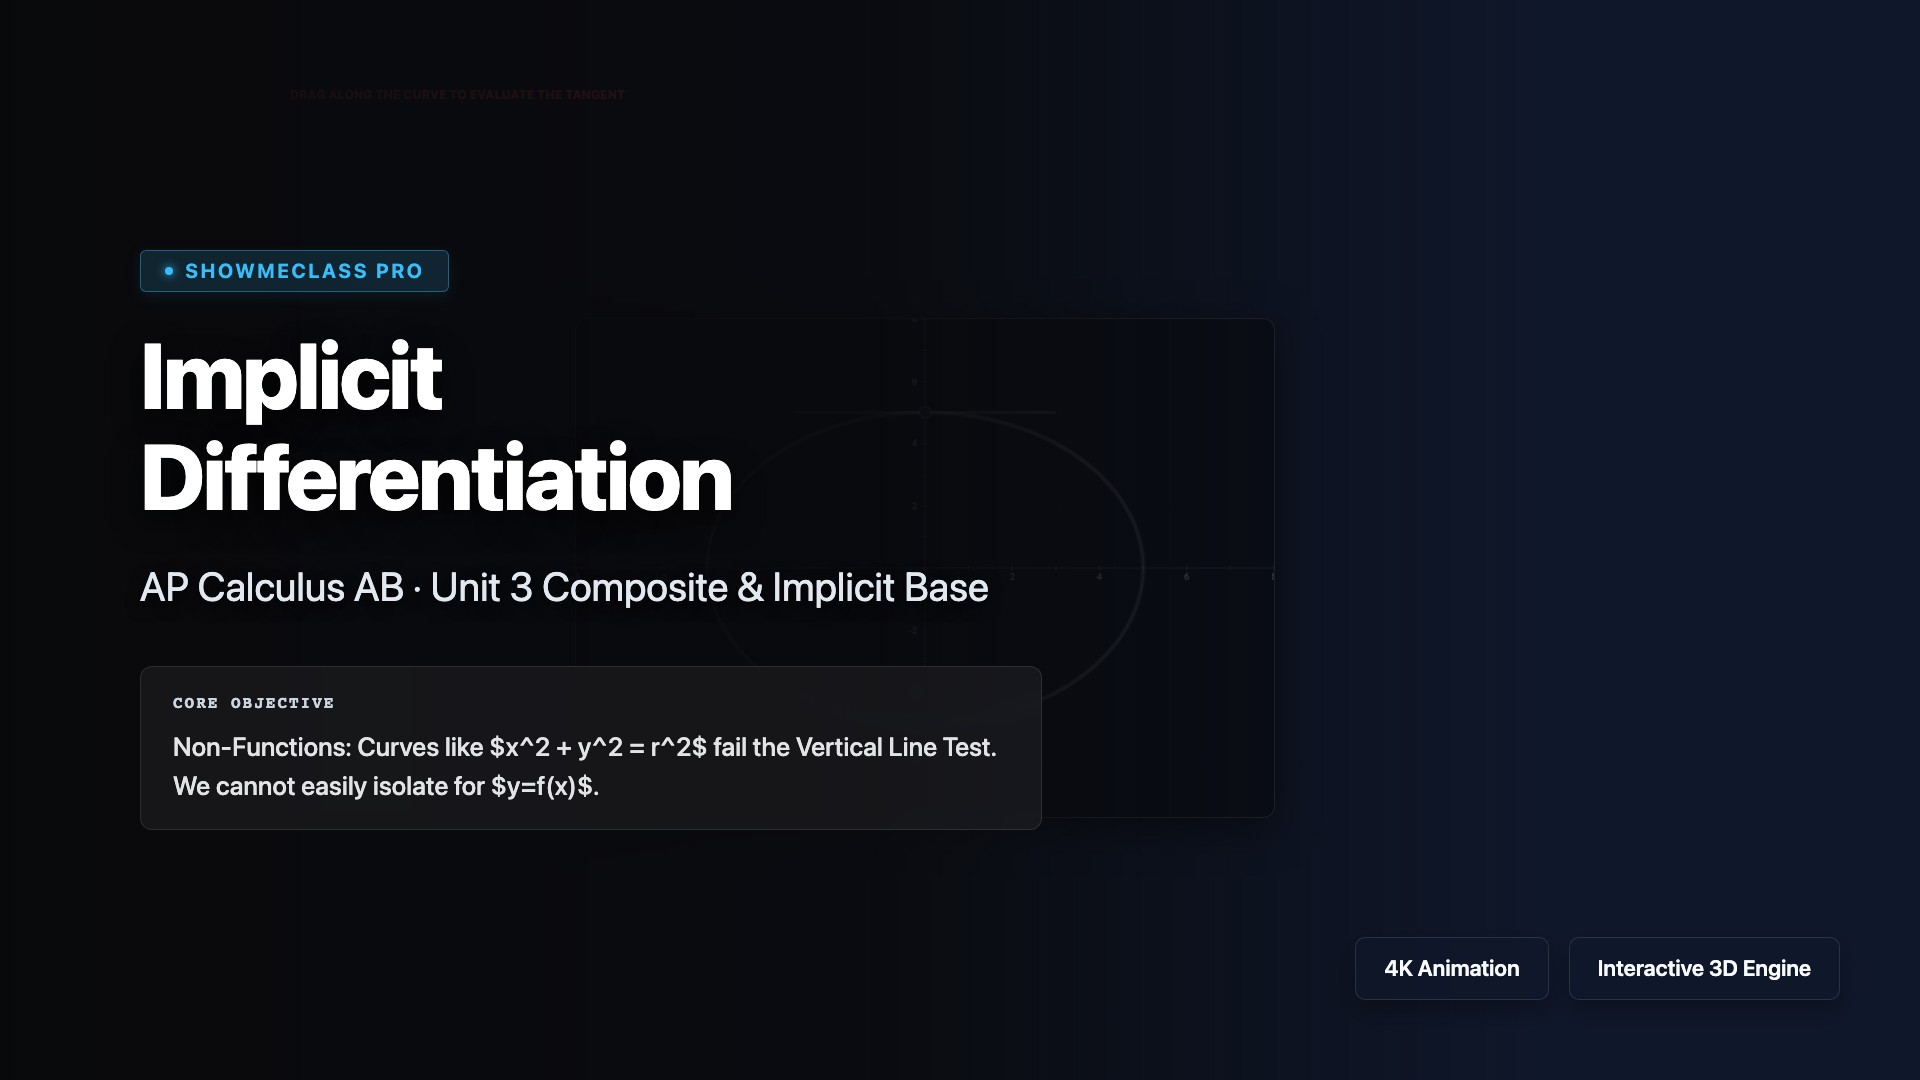
Implicit Differentiation
Implicit differentiation analyzer for non-functions (Circles, Ellipses, Foliums). Evaluates dy/dx dynamically, reacting to both x and y inputs to map vertical and horizontal tangents.