
Showing 12 results
Terminal Velocity & Drag Force
Examine the differential equations of falling objects experiencing linear and quadratic air resistance. Compare velocity-time graphs and asymptotes.
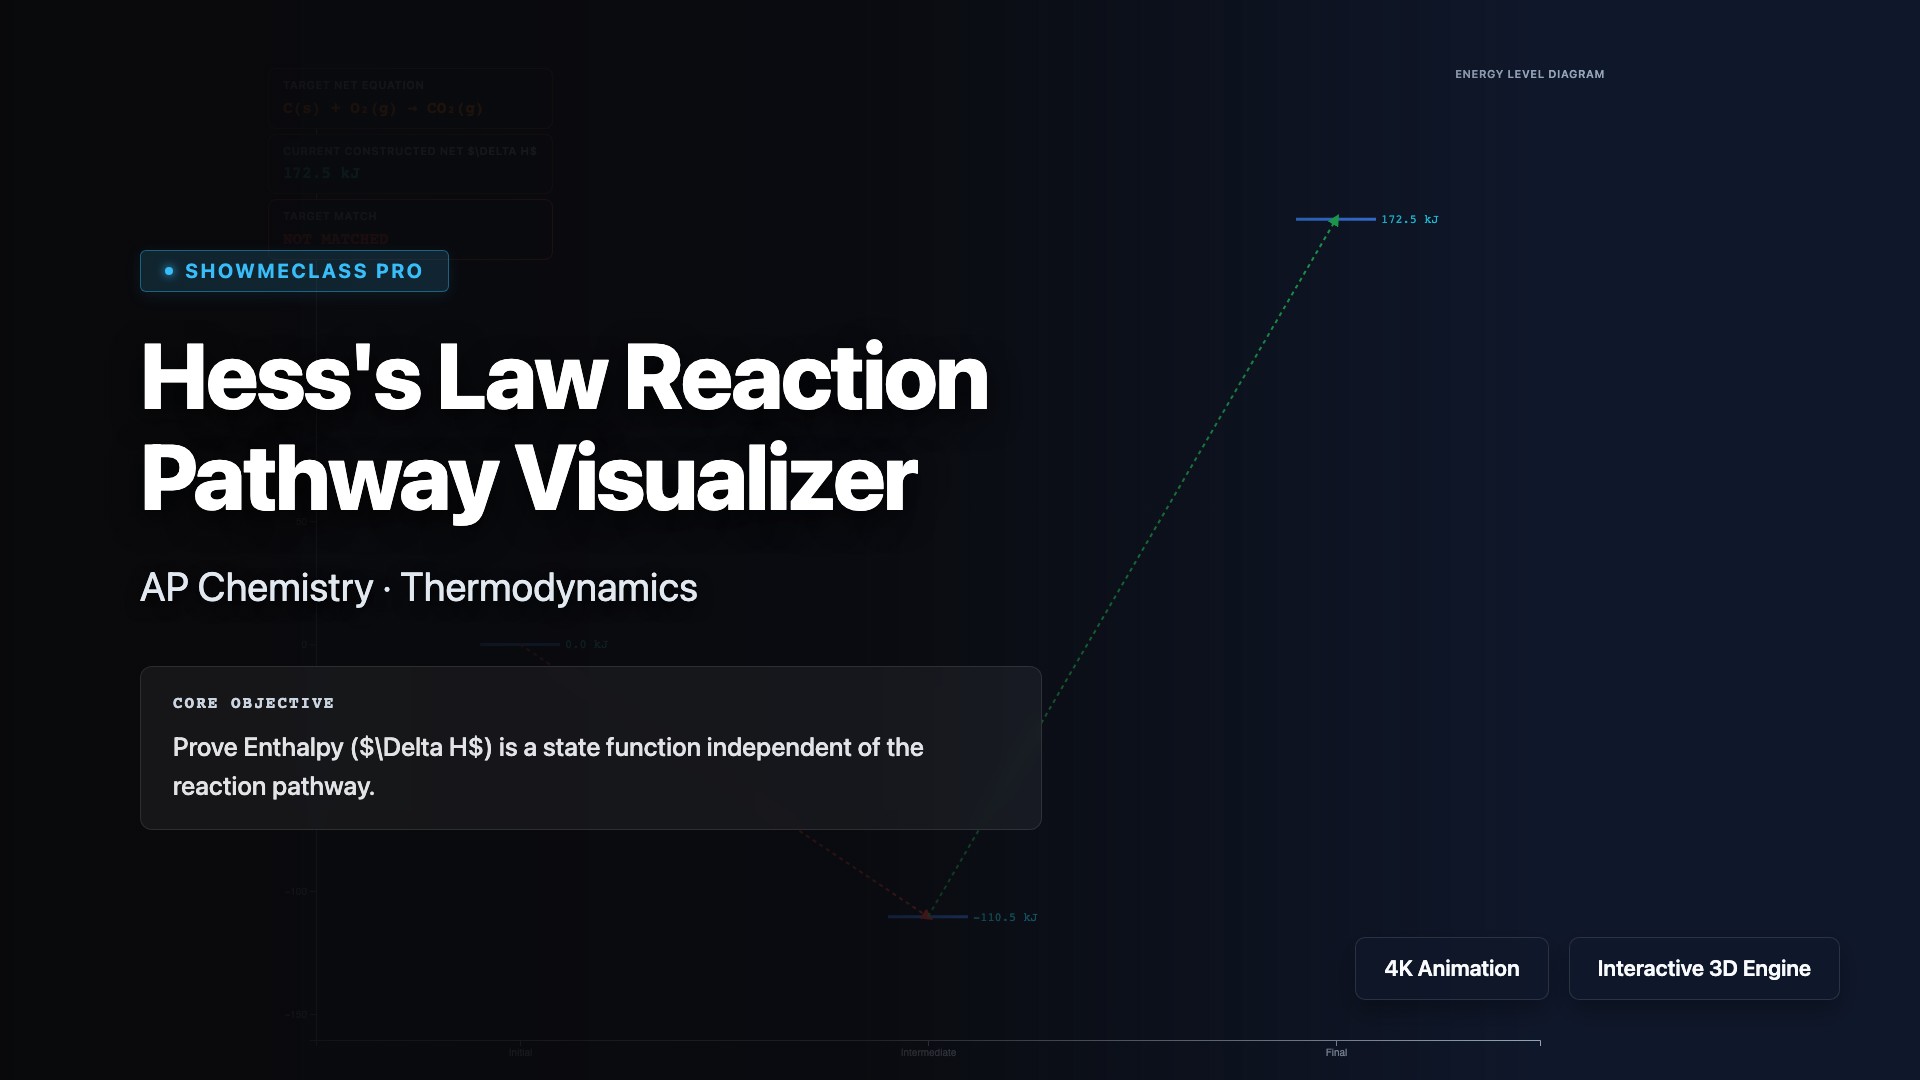
Hess's Law Reaction Pathway Visualizer
Build an algebraic pathway for enthalpy by reversing reactions, scaling stoichiometric coefficients, and adding step energies to find the net reaction.

Bohr Shift & Hemoglobin Oxygen Dissociation
Chart the sigmoidal oxygen binding curve of hemoglobin. Discover how lower pH, higher $CO_2$, and elevated temperatures cause a Right Shift in active muscle tissues.
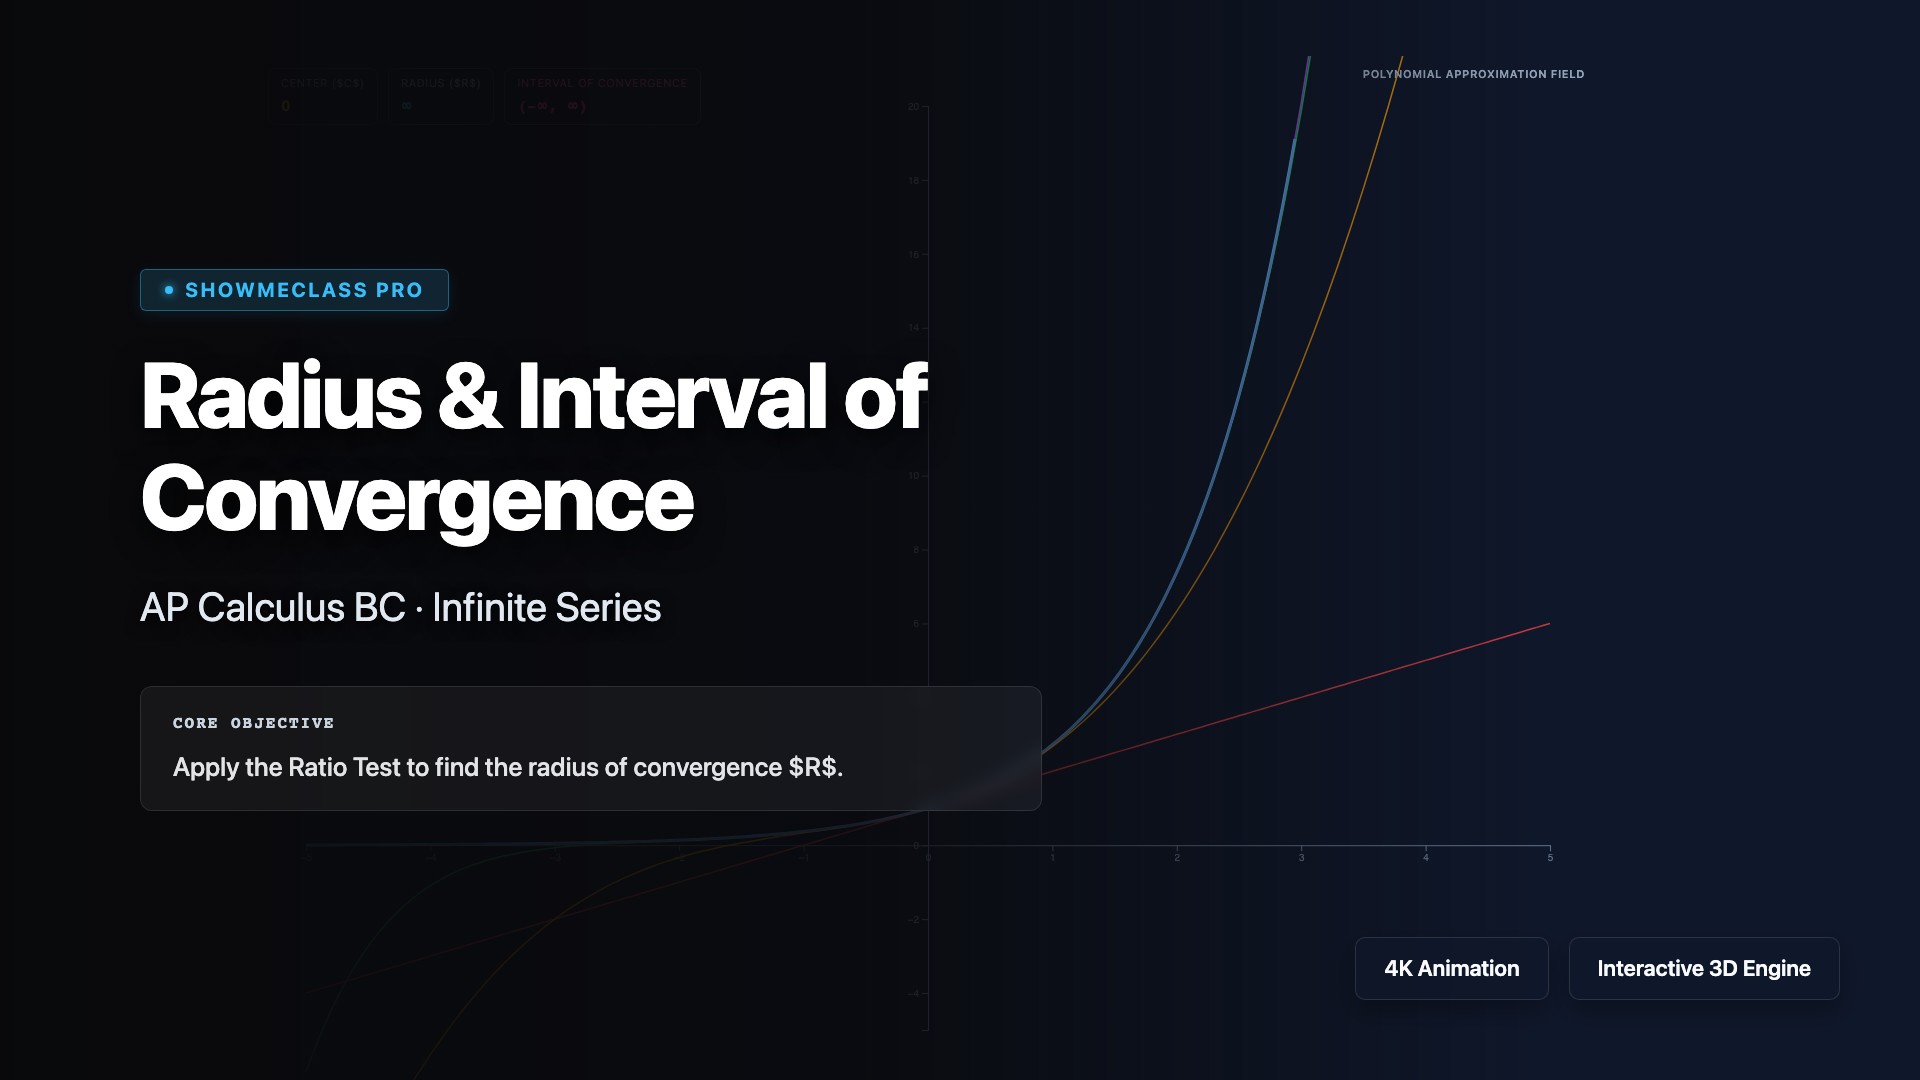
Radius of Convergence (Ratio Test)
Evaluate Taylor series limits to determine radii of convergence. Visually observe the divergence explosion outside the open boundaries of polynomials.

El Niño Southern Oscillation (ENSO)
Visualize the Pacific Ocean trade winds, thermocline shift, and upwelling mechanisms that govern El Niño and La Niña climate phases.

Electric Field & Equipotential Mapper
Interactive Gaussian graph paper. Map directional vectors of Electric Fields and prove they are perpendicular to drawn Equipotential surfaces.

Retinal Disparity & Binocular Cues
Simulate how the left and right eyes receive slightly different 2D images, allowing the brain to compute 3D depth and convergence angles.
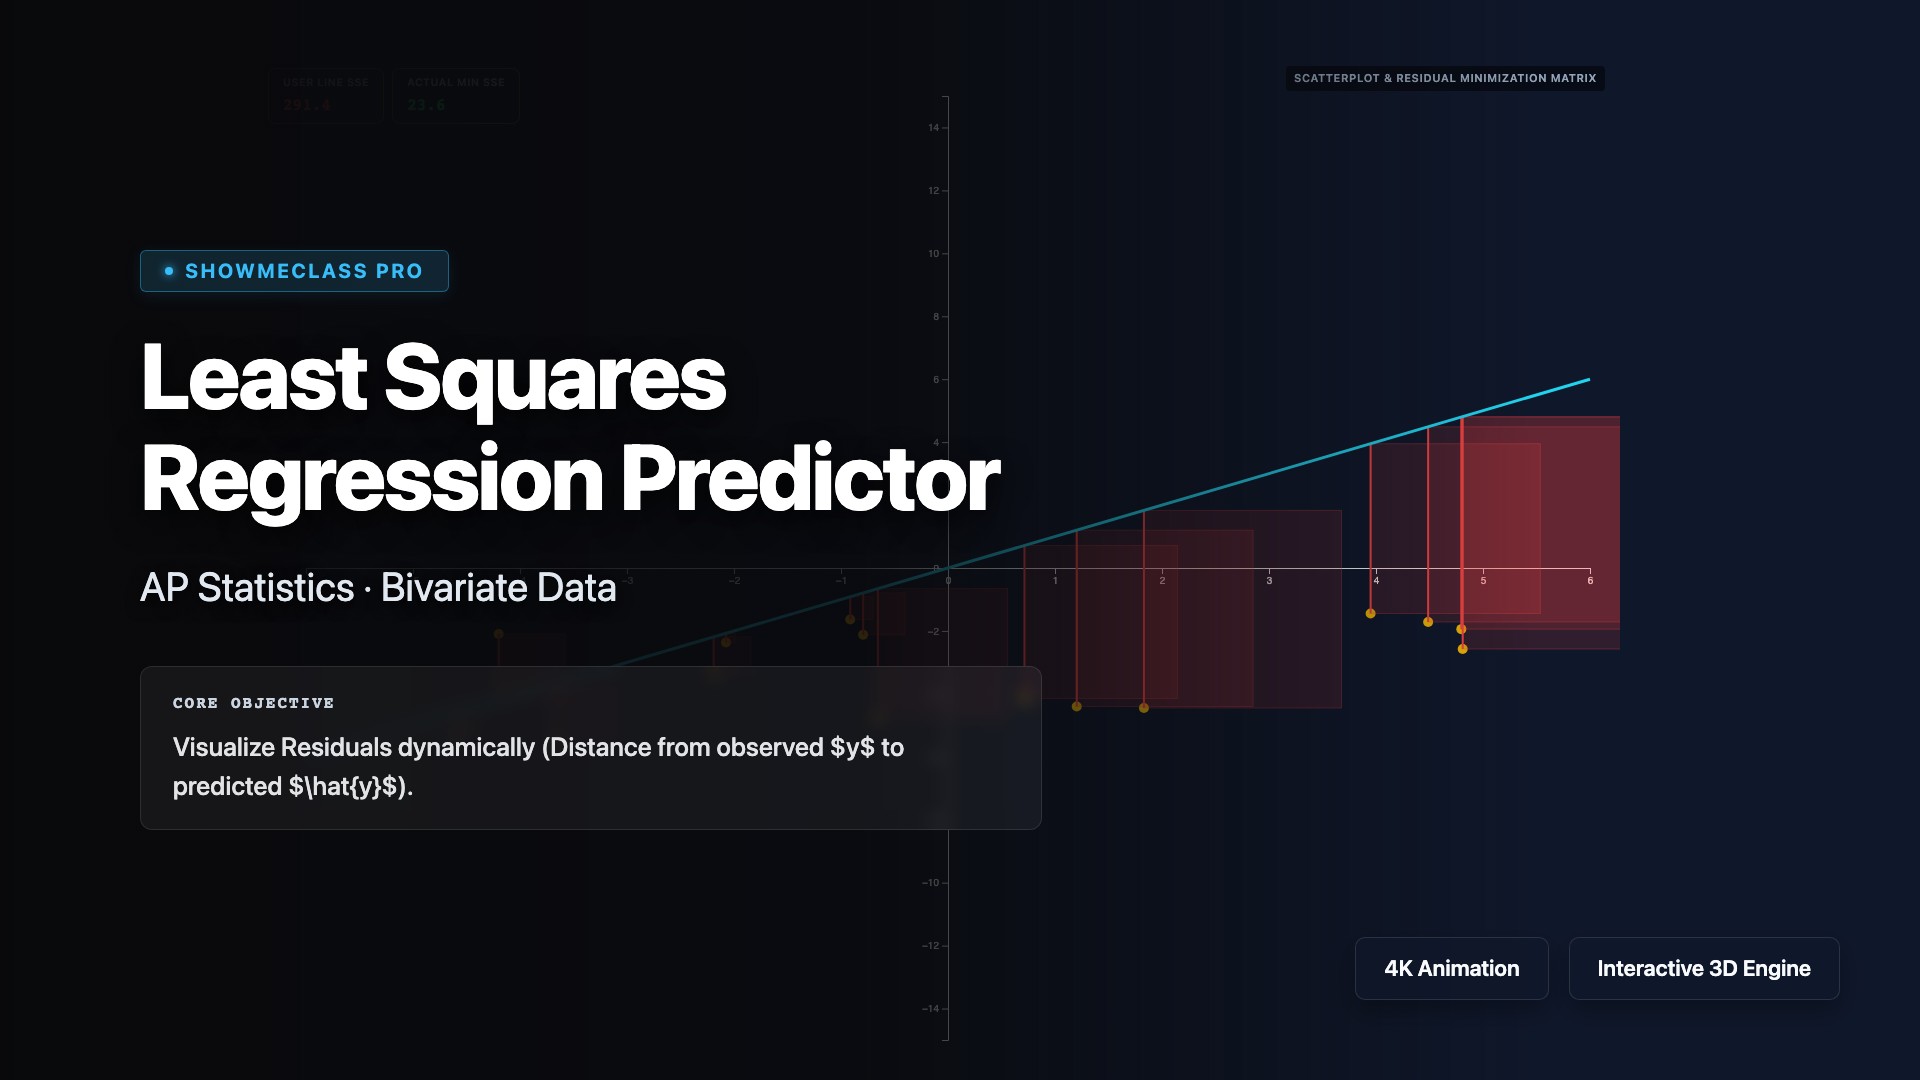
Least Squares Regression Predictor
Dynamically adjust a line of best fit to actively minimize the sum of squared residuals (SSE) compared to the true OLS regression model.
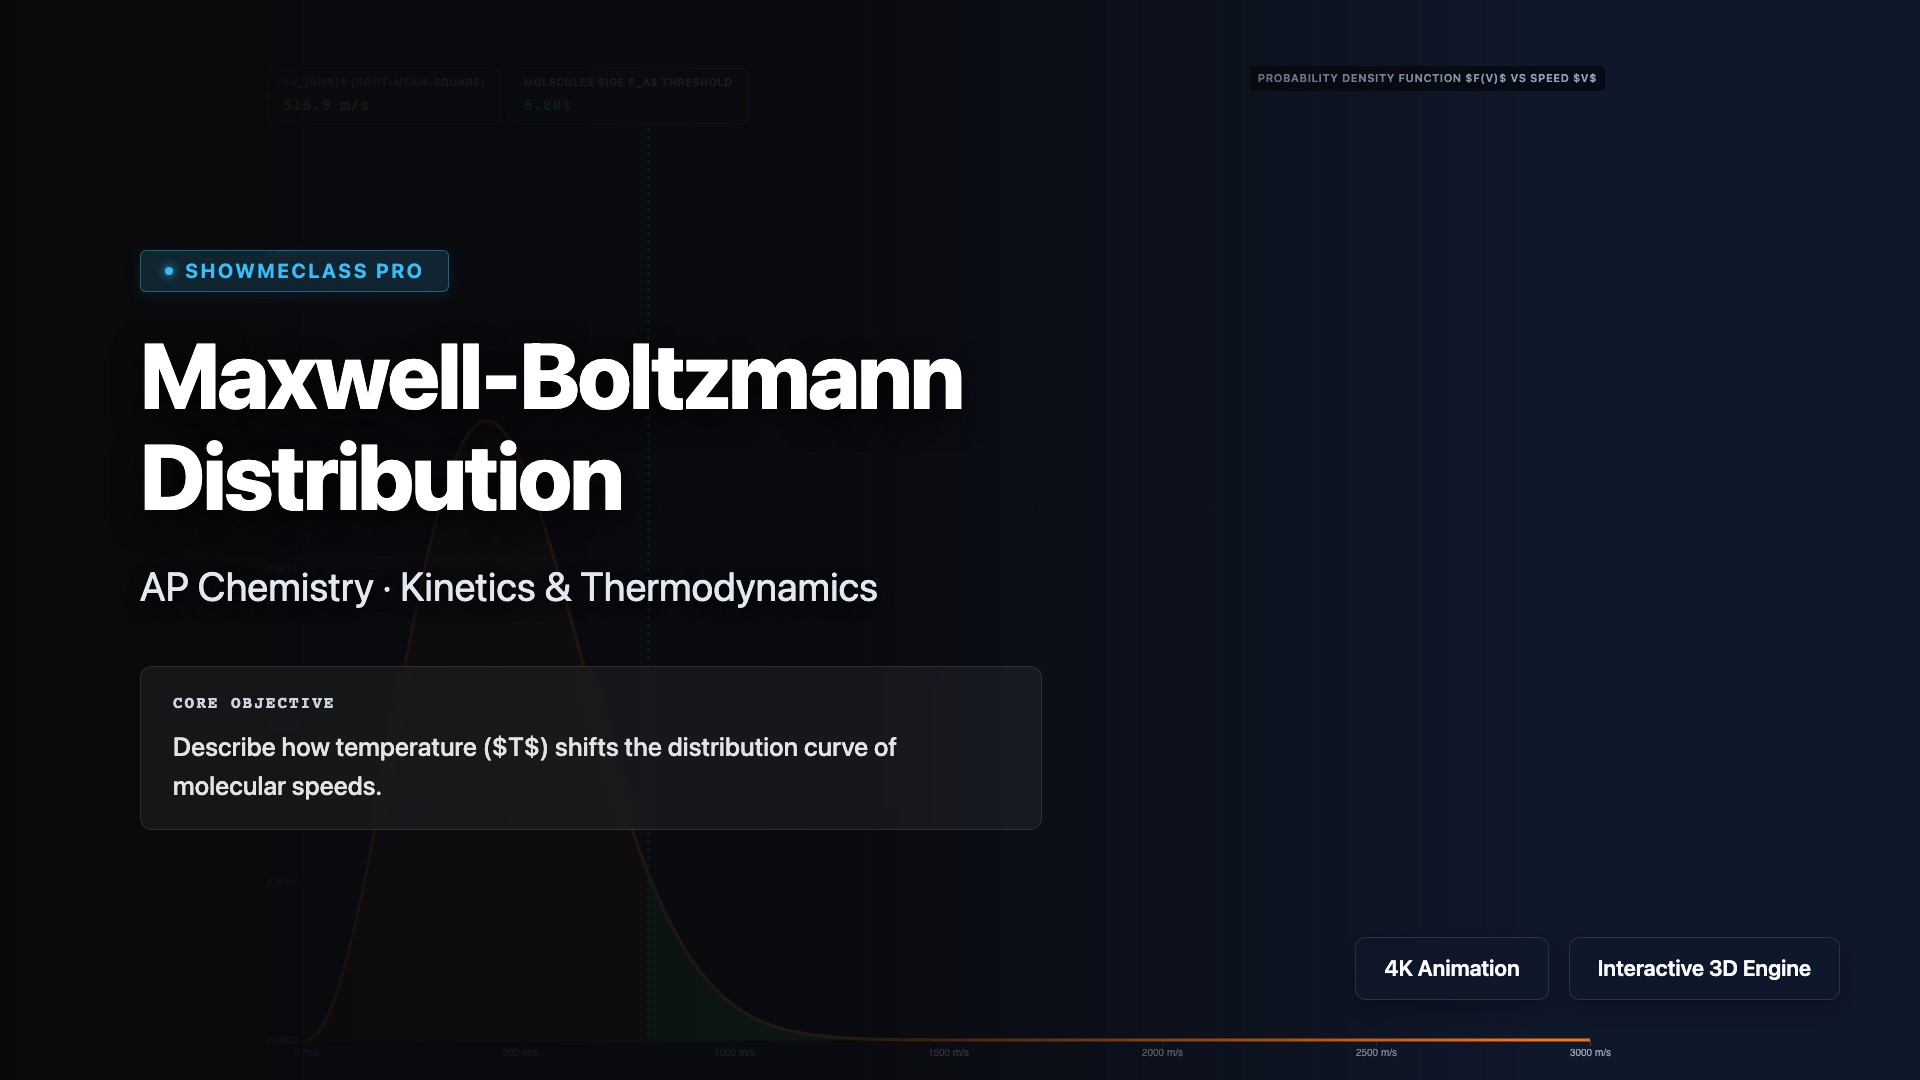
Maxwell-Boltzmann Distribution
Visualize how temperature and molar mass shift the kinetic energy distribution of particles, affecting the proportion that overcome the Activation Energy.
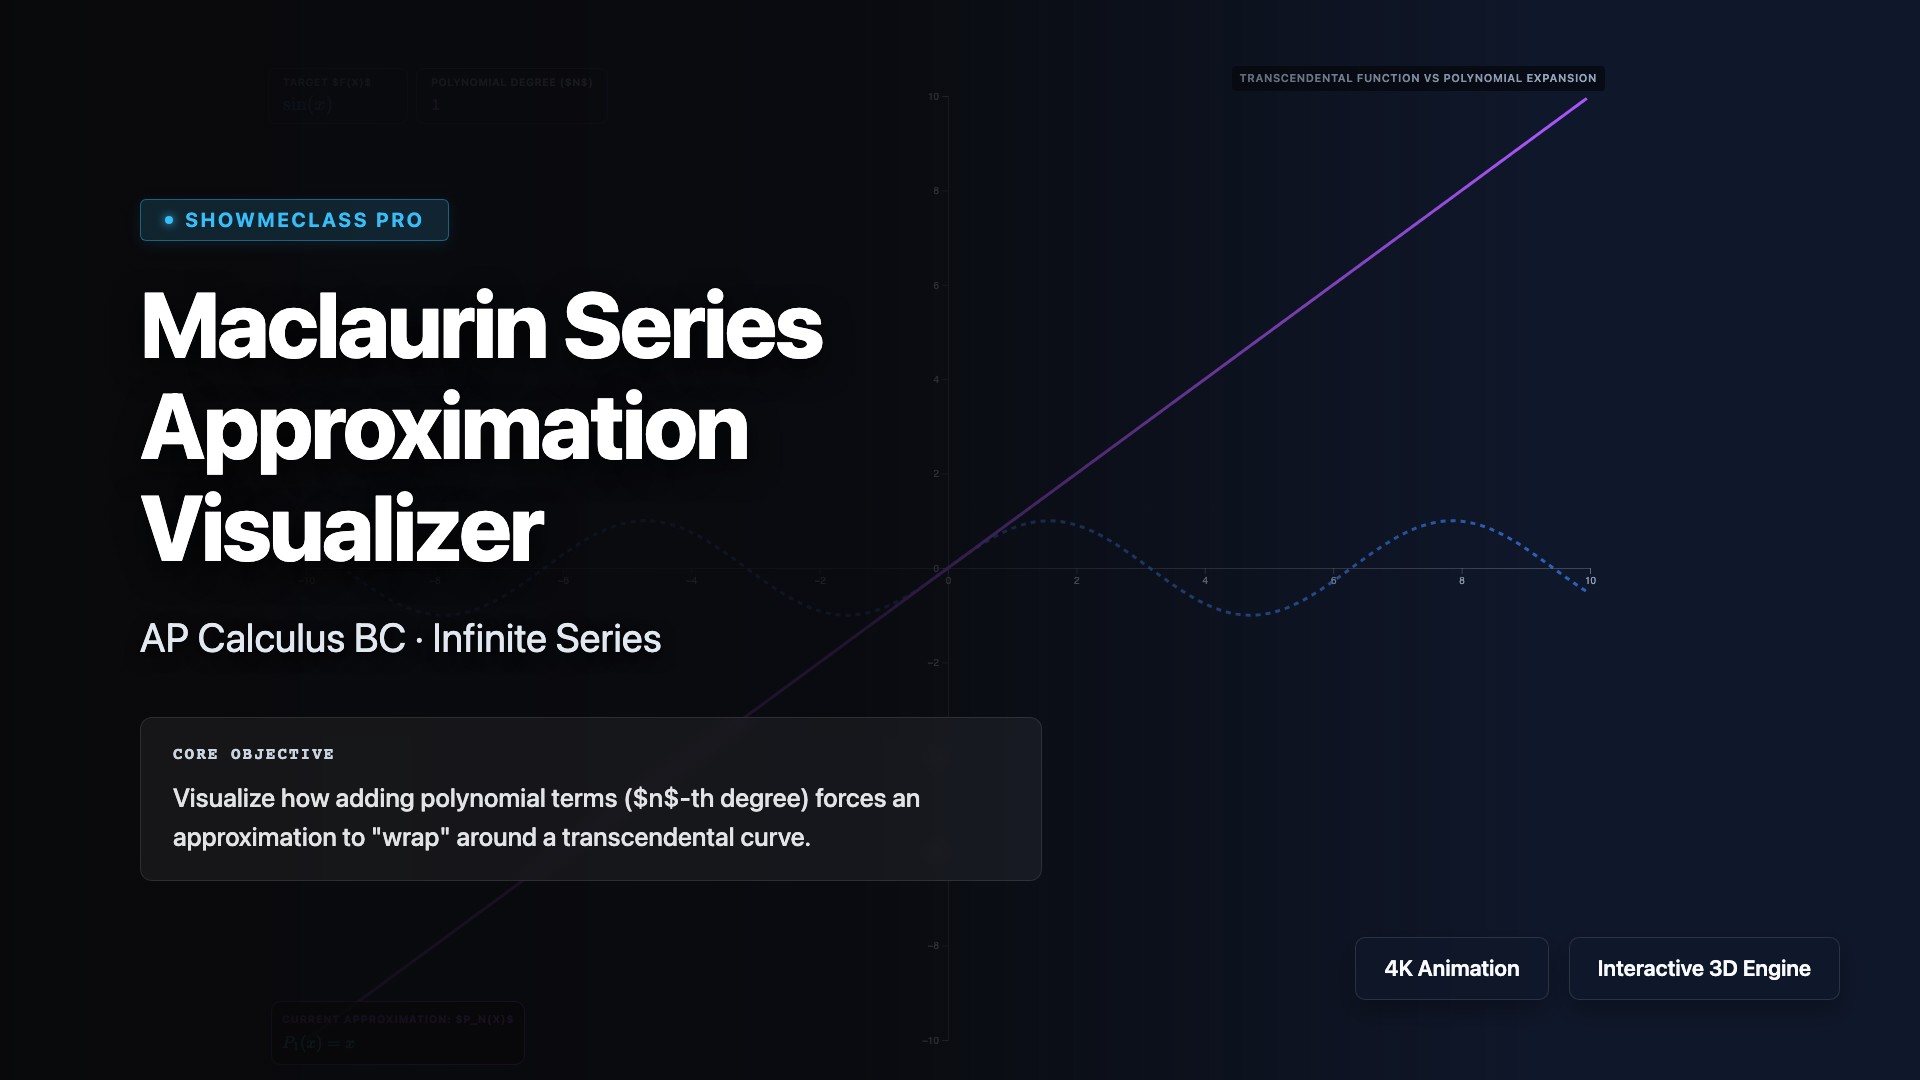
Maclaurin Series Visualizer
Increase the polynomial degree to observe how Taylor/Maclaurin series mathematically trace transcendental functions like sin(x) and e^x.

The Calvin Cycle
Track the fixation of Carbon Dioxide by Rubisco and the energy transfer from Light-Dependent ATP/NADPH to synthesize G3P.
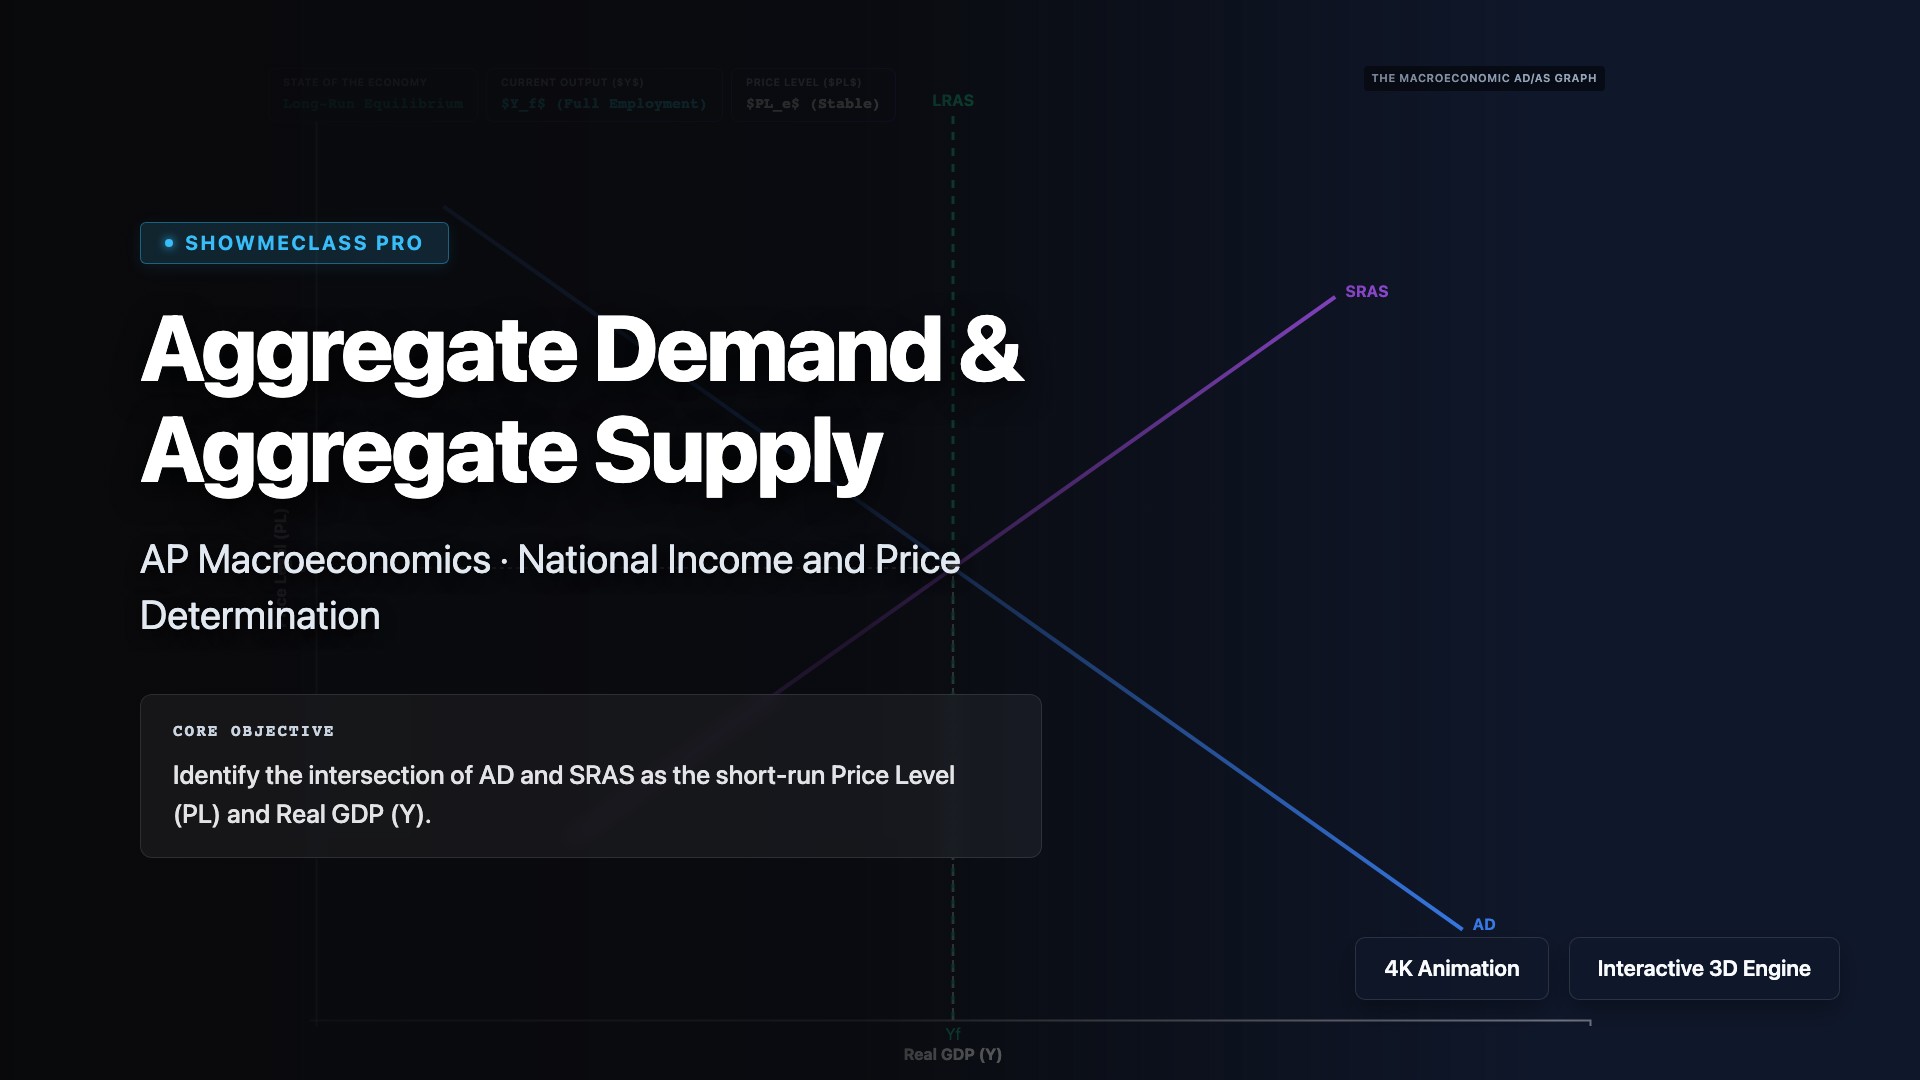
Aggregate Demand & Supply Model
Shift the AD and SRAS curves to visually create Recessionary Gaps, Inflationary Gaps, and Stagflation relative to the LRAS full employment boundary.