
Showing 12 results

Series Convergence Tests
Convergence testing interactive engine visually exposing the logical divergence of p-series compared with Alternating boundaries (AST bounce) and absolute factorial crushes dictated by Ratio limit laws.
Taylor/Maclaurin Polynomials
Taylor/Maclaurin generator interactively layering $n$-degree $f^{(n)}/n!$ polynomial sweeps over transcendental seeds ($\sin(x), e^x, \ln(1+x)$). Demonstrates active radius of convergence limits dynamically via Center-$c$ shifting.
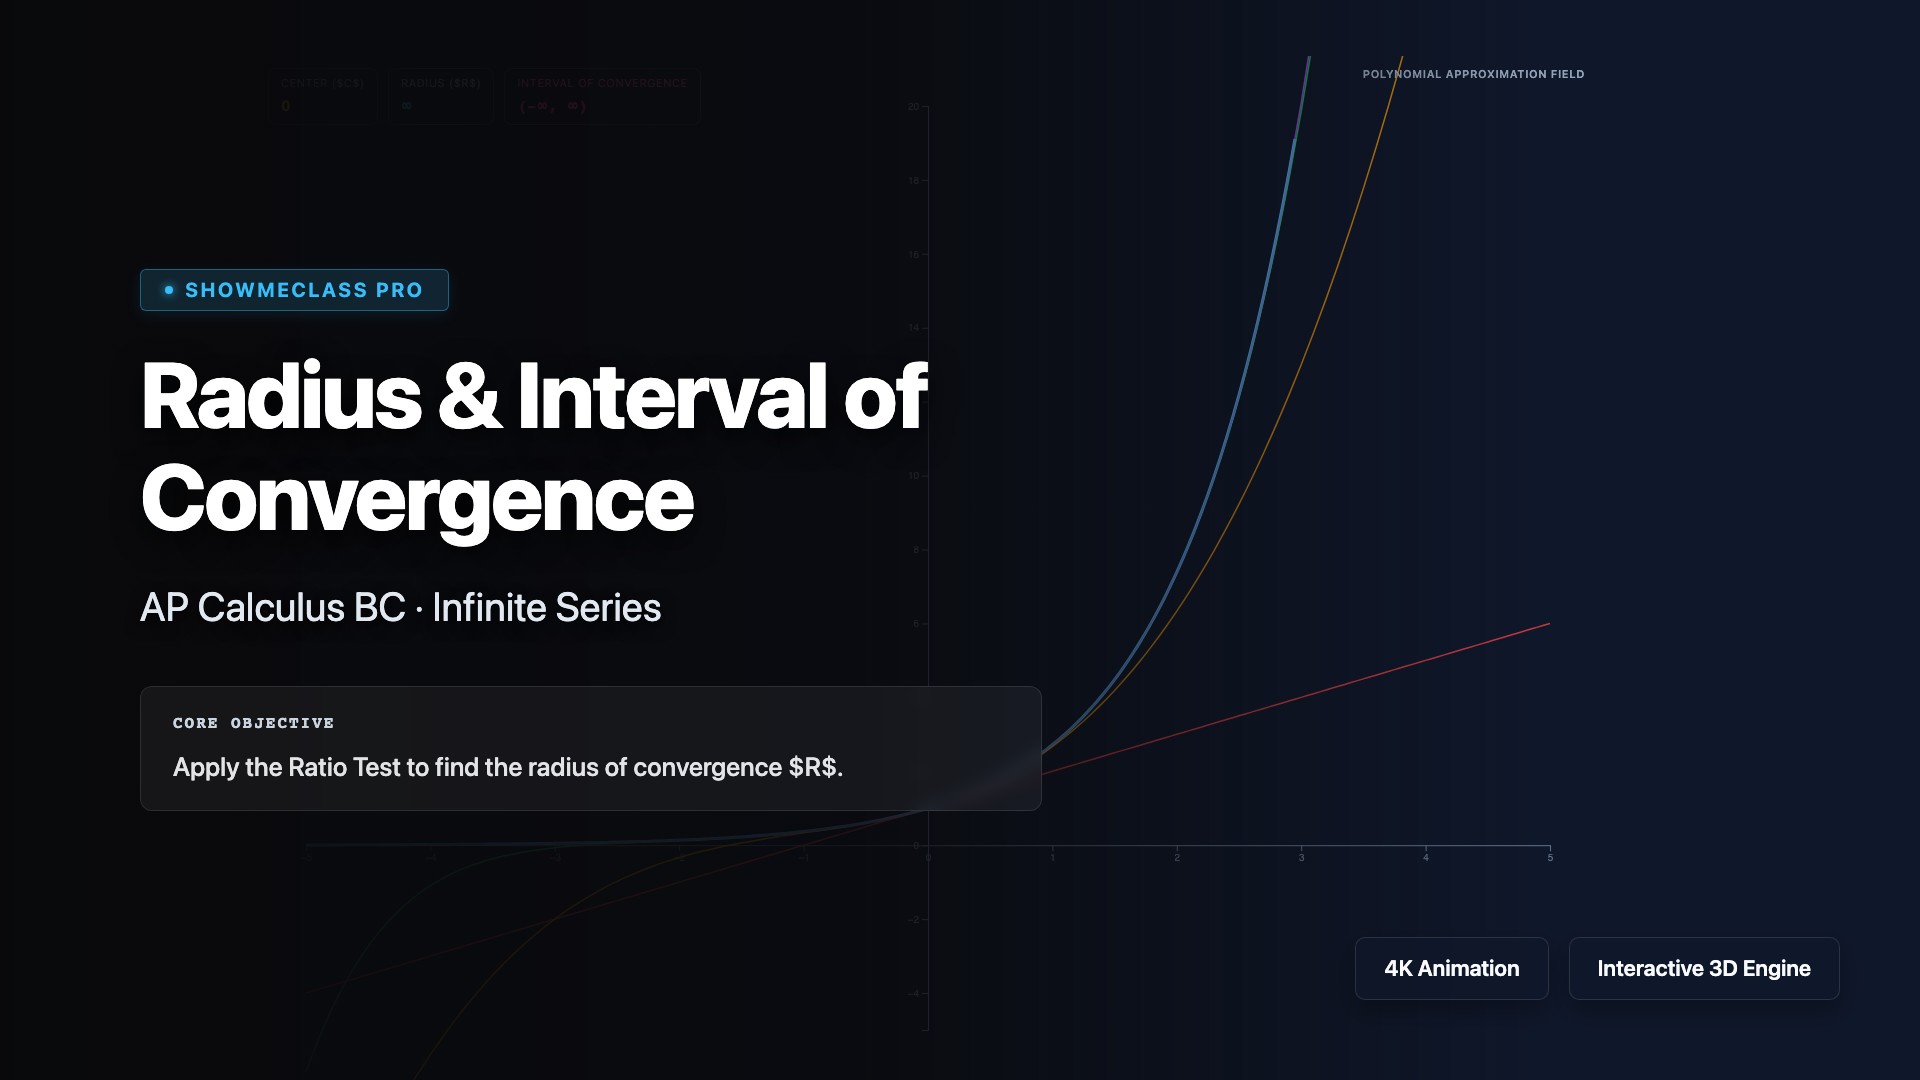
Radius of Convergence
Convergence mapping UI tracking power series expansion endpoints. Computes spatial Ratio test limits rendering absolute, conditional intervals visually over 1D axis coordinate models to distinguish $[a, b)$ limits structurally.
Arc Length Geometry
Integration geometric summation modeling arc length via continuous reduction of $ds = \sqrt{dx^2 + dy^2}$ discrete limits approaching exact mathematical integrals. Reveals consistent finite approximation underestimation behavior against true curved lines.
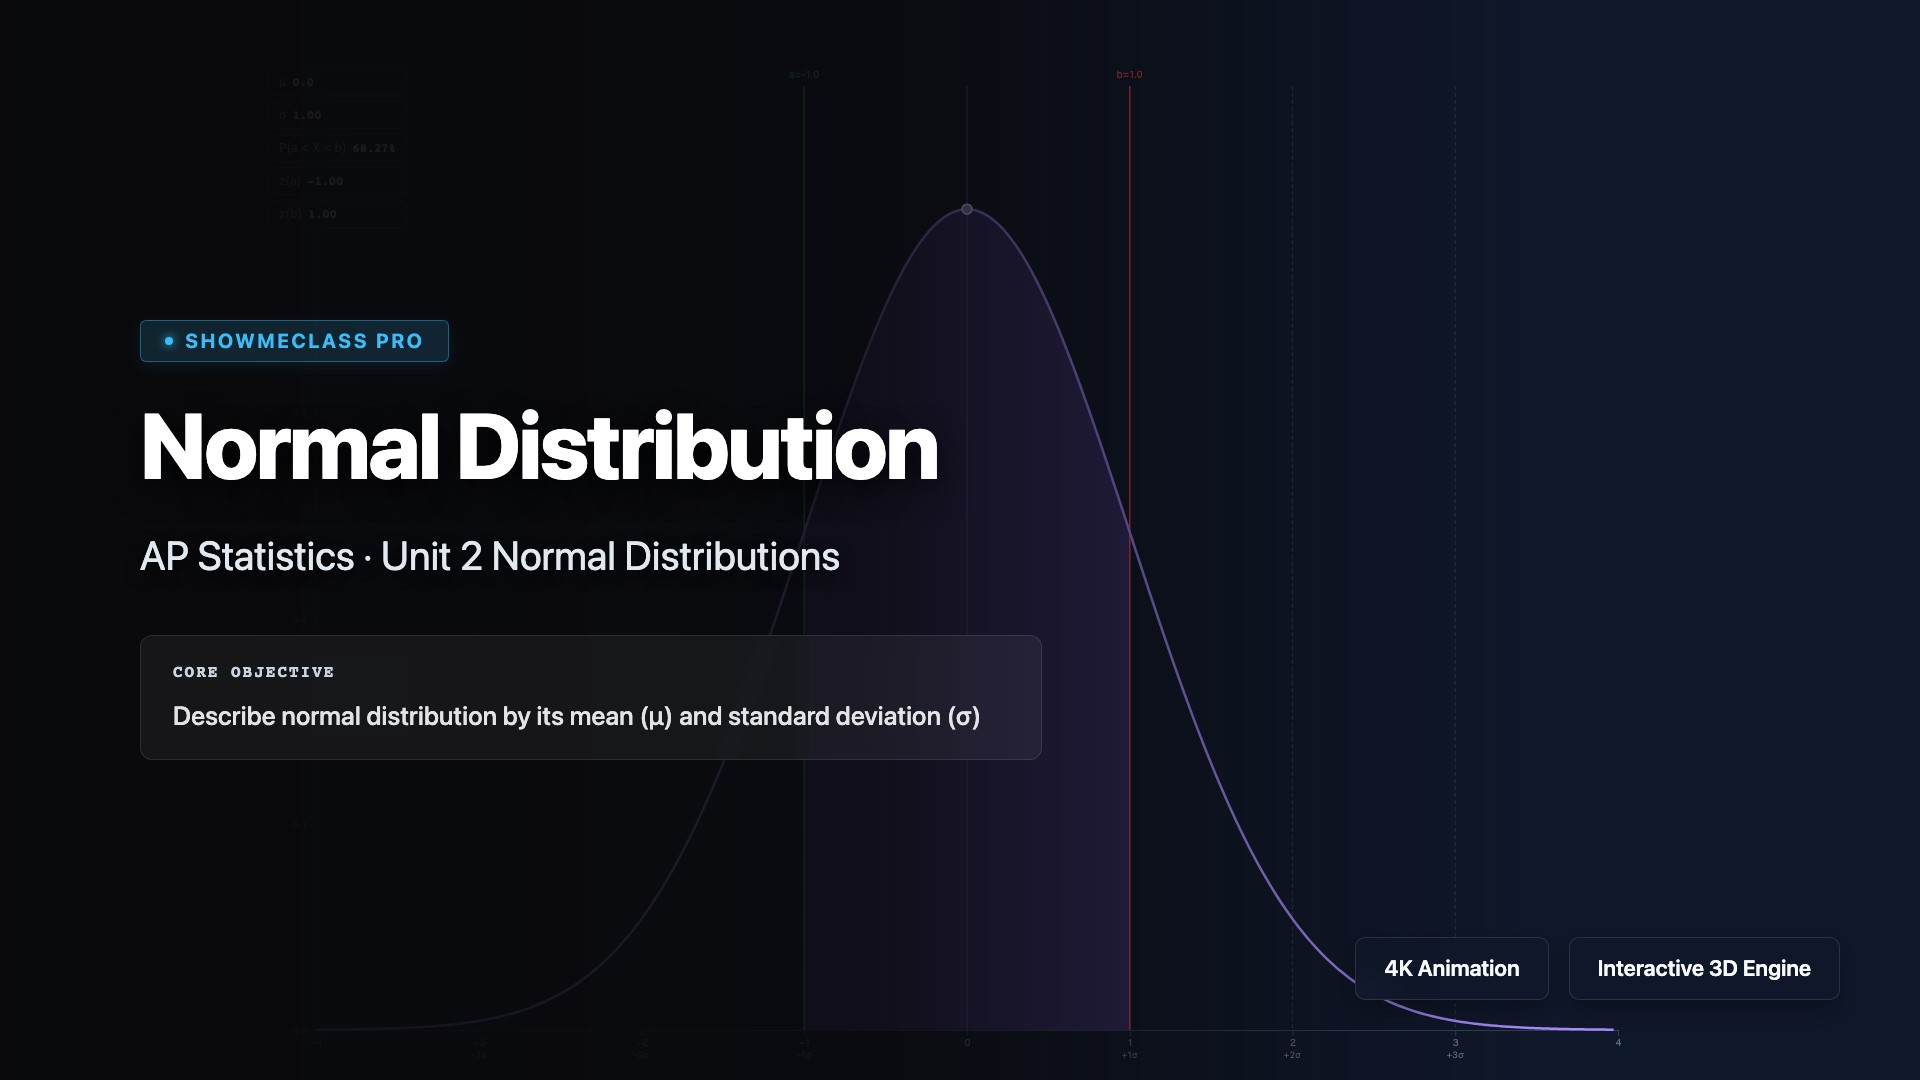
Normal Distribution Explorer
Interactive Gaussian curve generator manipulating $\mu$ and $\sigma$ instantly mapped against the 68-95-99.7 Empirical Rule. Highlights discrete $Z$-score thresholds tracking precision standard deviation geometry exactly.
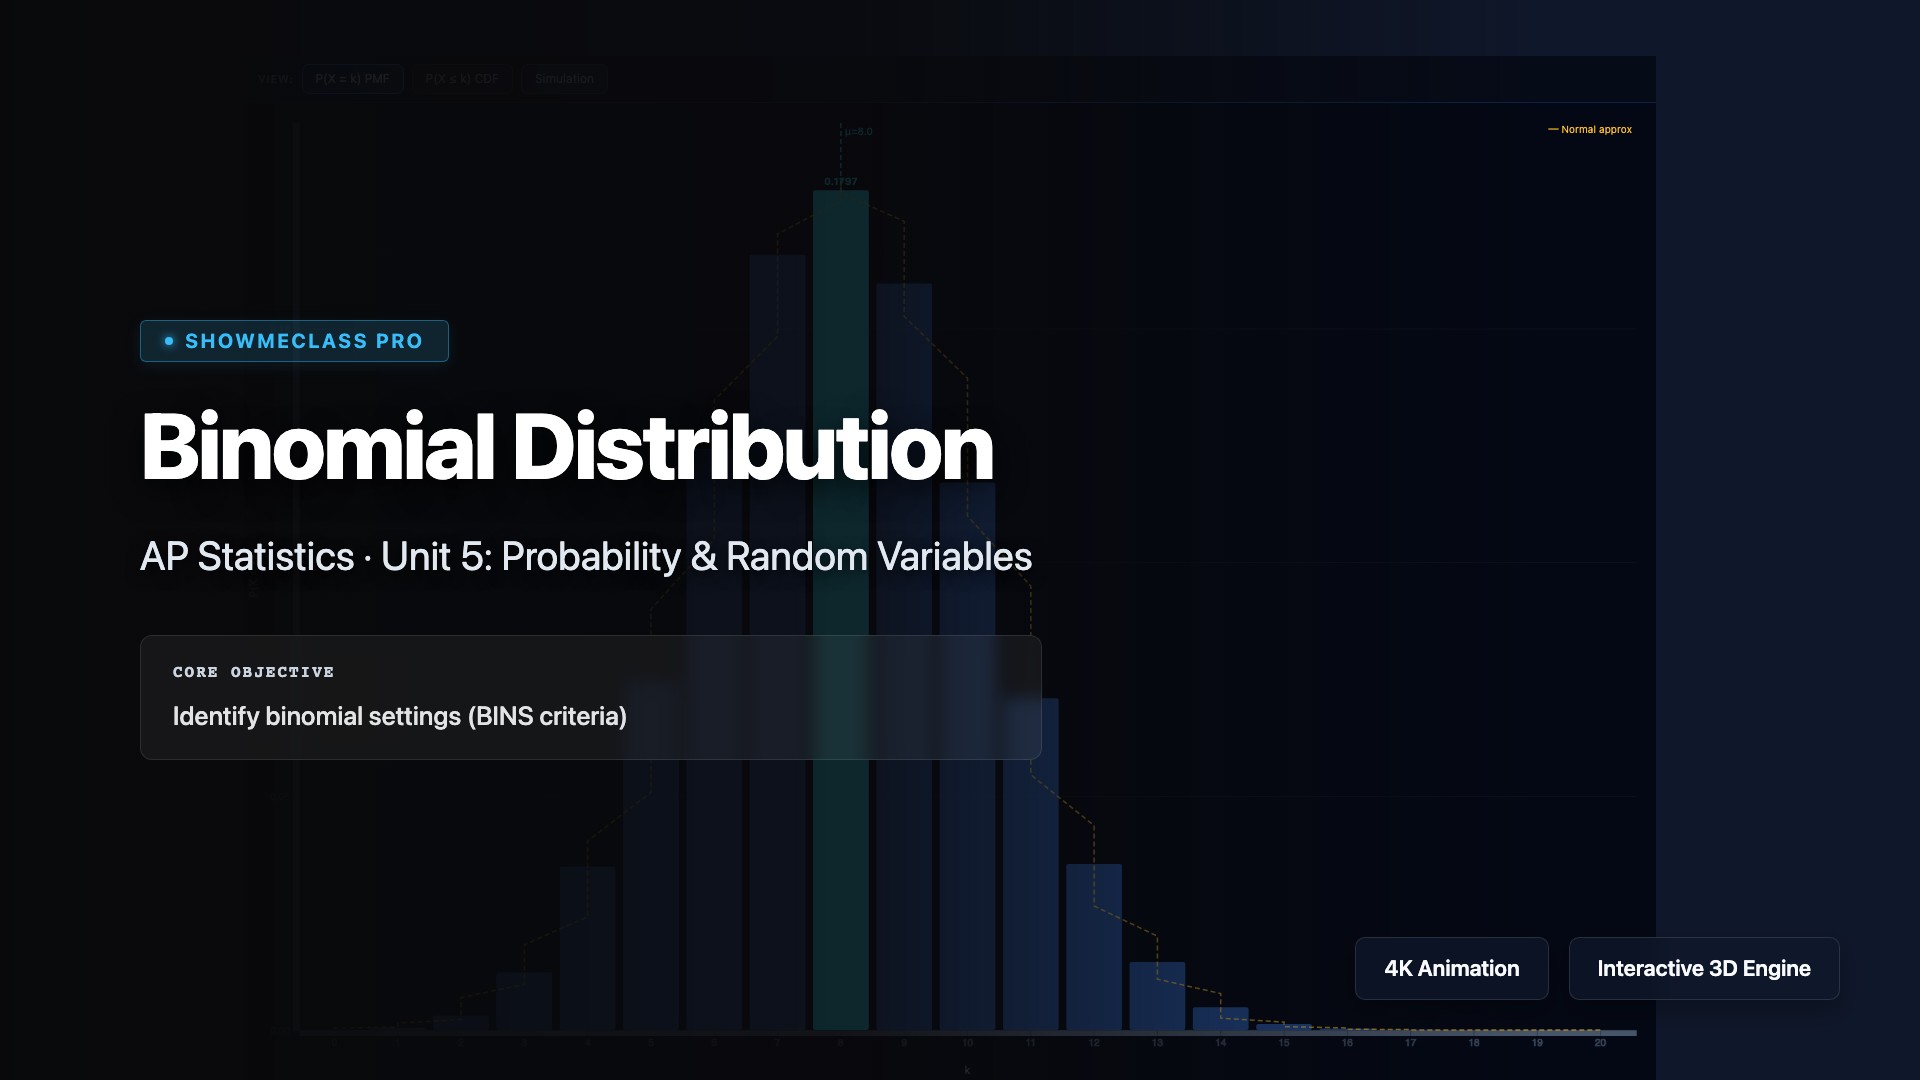
Binomial Probability Model
Interactive Binomial exact probability mass function visualizing discrete histograms. Demonstrates dynamic skew based on fixed $n, p$ ratios and overlays large-sample normal convergence boundaries visually calculating exact vs cumulative density outcomes.
Sampling Distributions (CLT)
Dual-canvas integration rendering Central Limit Theorem convergence. Draws random Monte Carlo datasets mapping sample size variance crushing ($n \geq 30$ rule) converting arbitrary shapes (skewed/bimodal) into stable Gaussian sample-mean distributions.
Confidence Intervals
Visualization generating multiple dynamic Confidence Interval margin 'nets' drawn from random standard errors. Empirically validates the meaning of 95% confidence by revealing the random capture vs failure rate against an unknown stationary population parameter line.
Hypothesis Testing Rules
Inferential hypothesis engine animating null model rejection thresholds vs interactive sample observed P-Value tails. Illuminates the deterministic binary conclusion states driven by fixed Alpha lines mapping Type I geometric error bounds visually.
Linear Regression (LSRL)
Interactive graphical Least Squares regression engine visually proving the $e^2$ square-area minimization property via manual vs automatic fitting while actively mapping high leverage outlier penalties.

Chi-Square Test (Goodness of Fit)
Goodness of Fit interaction engine assessing categorical skew. Graphically maps individual $(O-E)^2/E$ penalty variance blocks onto nominal bar distributions to visually sum into absolute $\chi^2$ scalar outcomes linking directly to cumulative significance rejection limits.
Student's t-Distribution
Interactive dynamic rendering of Student's T probability density logic modeling $df$ expansion from 1 stabilizing towards normal Z convergence. Highlights fat tail density displacement explicitly revealing structural variance uncertainty for small sample designs.