
Showing 12 results
ANOVA Variance Analysis
Interactive ANOVA interaction plotting $MS_{bet}$ vs $MS_{wit}$ signal-to-noise calculations natively. Combines adjustable uniform variance blocks mathematically linking structural layout changes actively to precise numerical F-Distribution test thresholds.
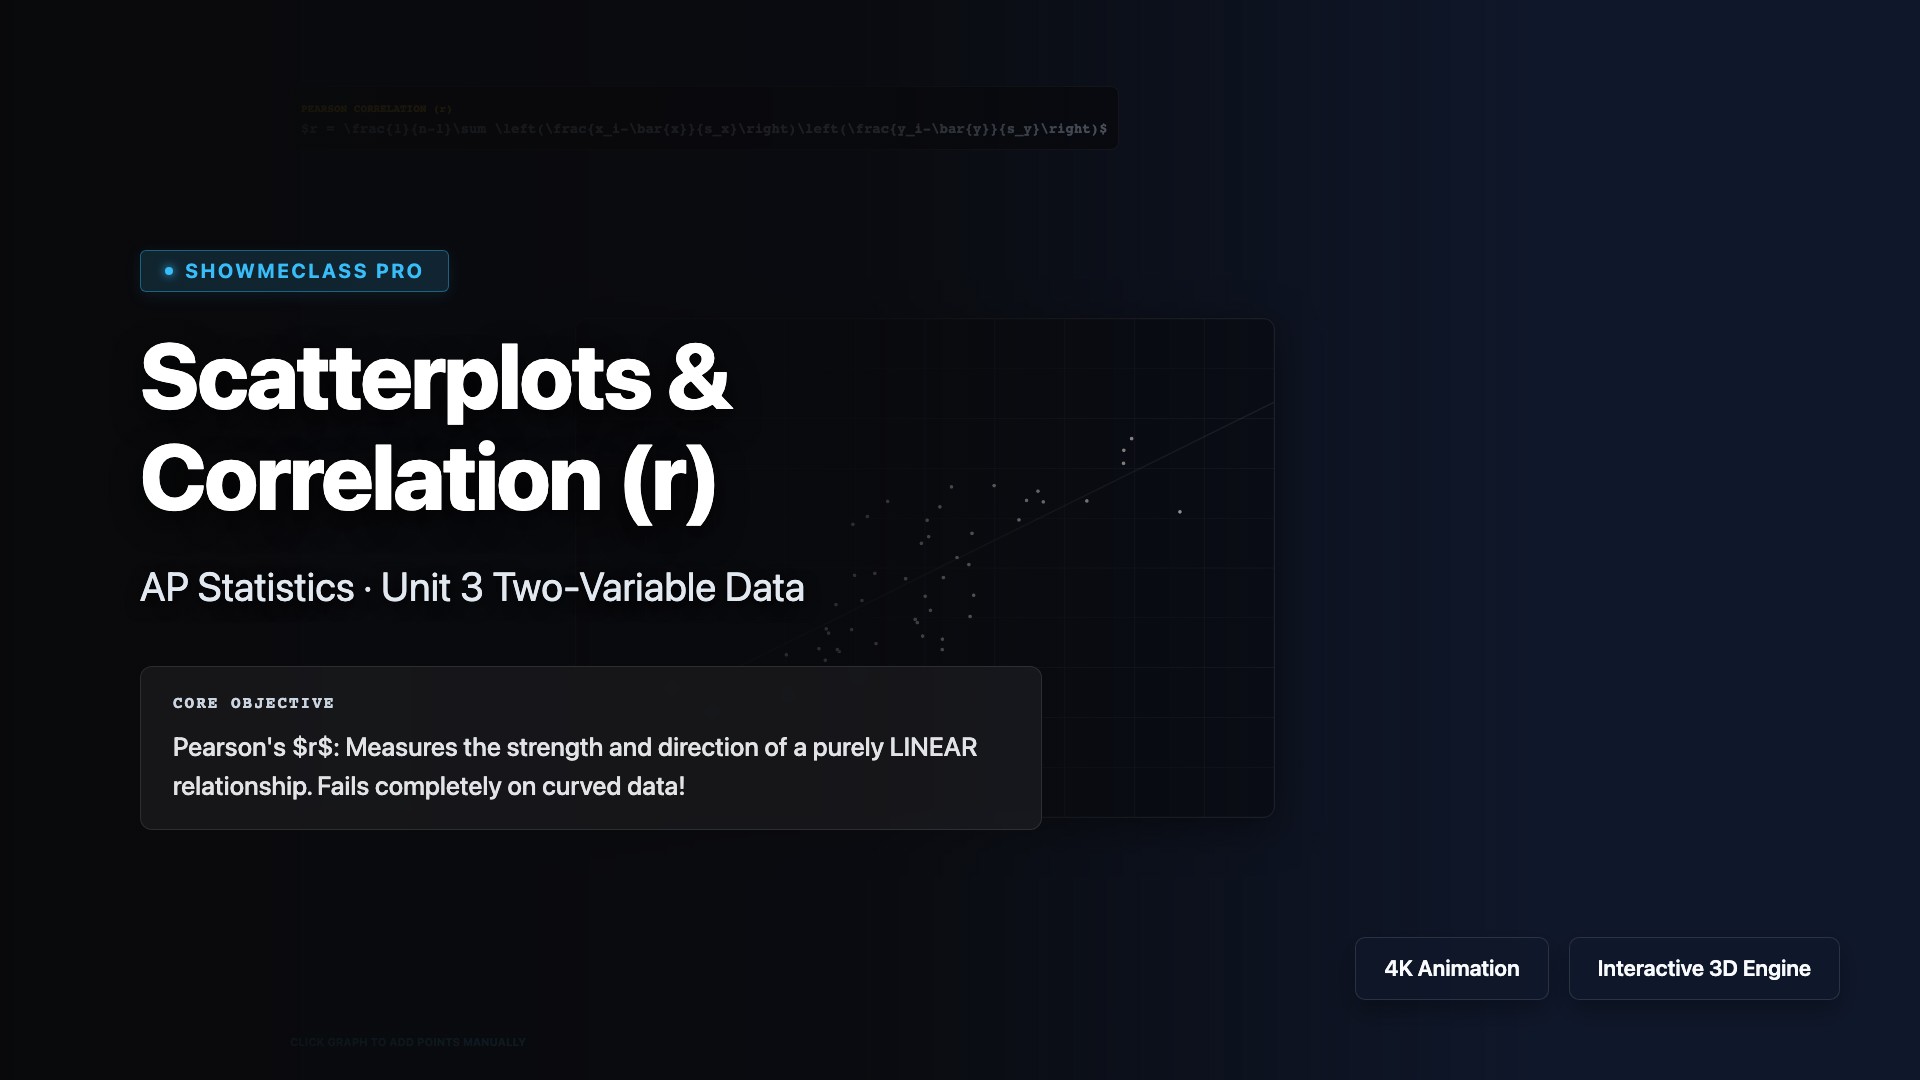
Scatterplots & Correlation (r)
Interactive scatterplot geometry demonstrating Pearson's correlation coefficient mapping bounds ($|r| \to 1$). Employs bivariate normal Box-Muller transformations to visually generate dynamic density clouds calculating $R^2$ determination variances overlaid mathematically on LSRL projection planes natively.
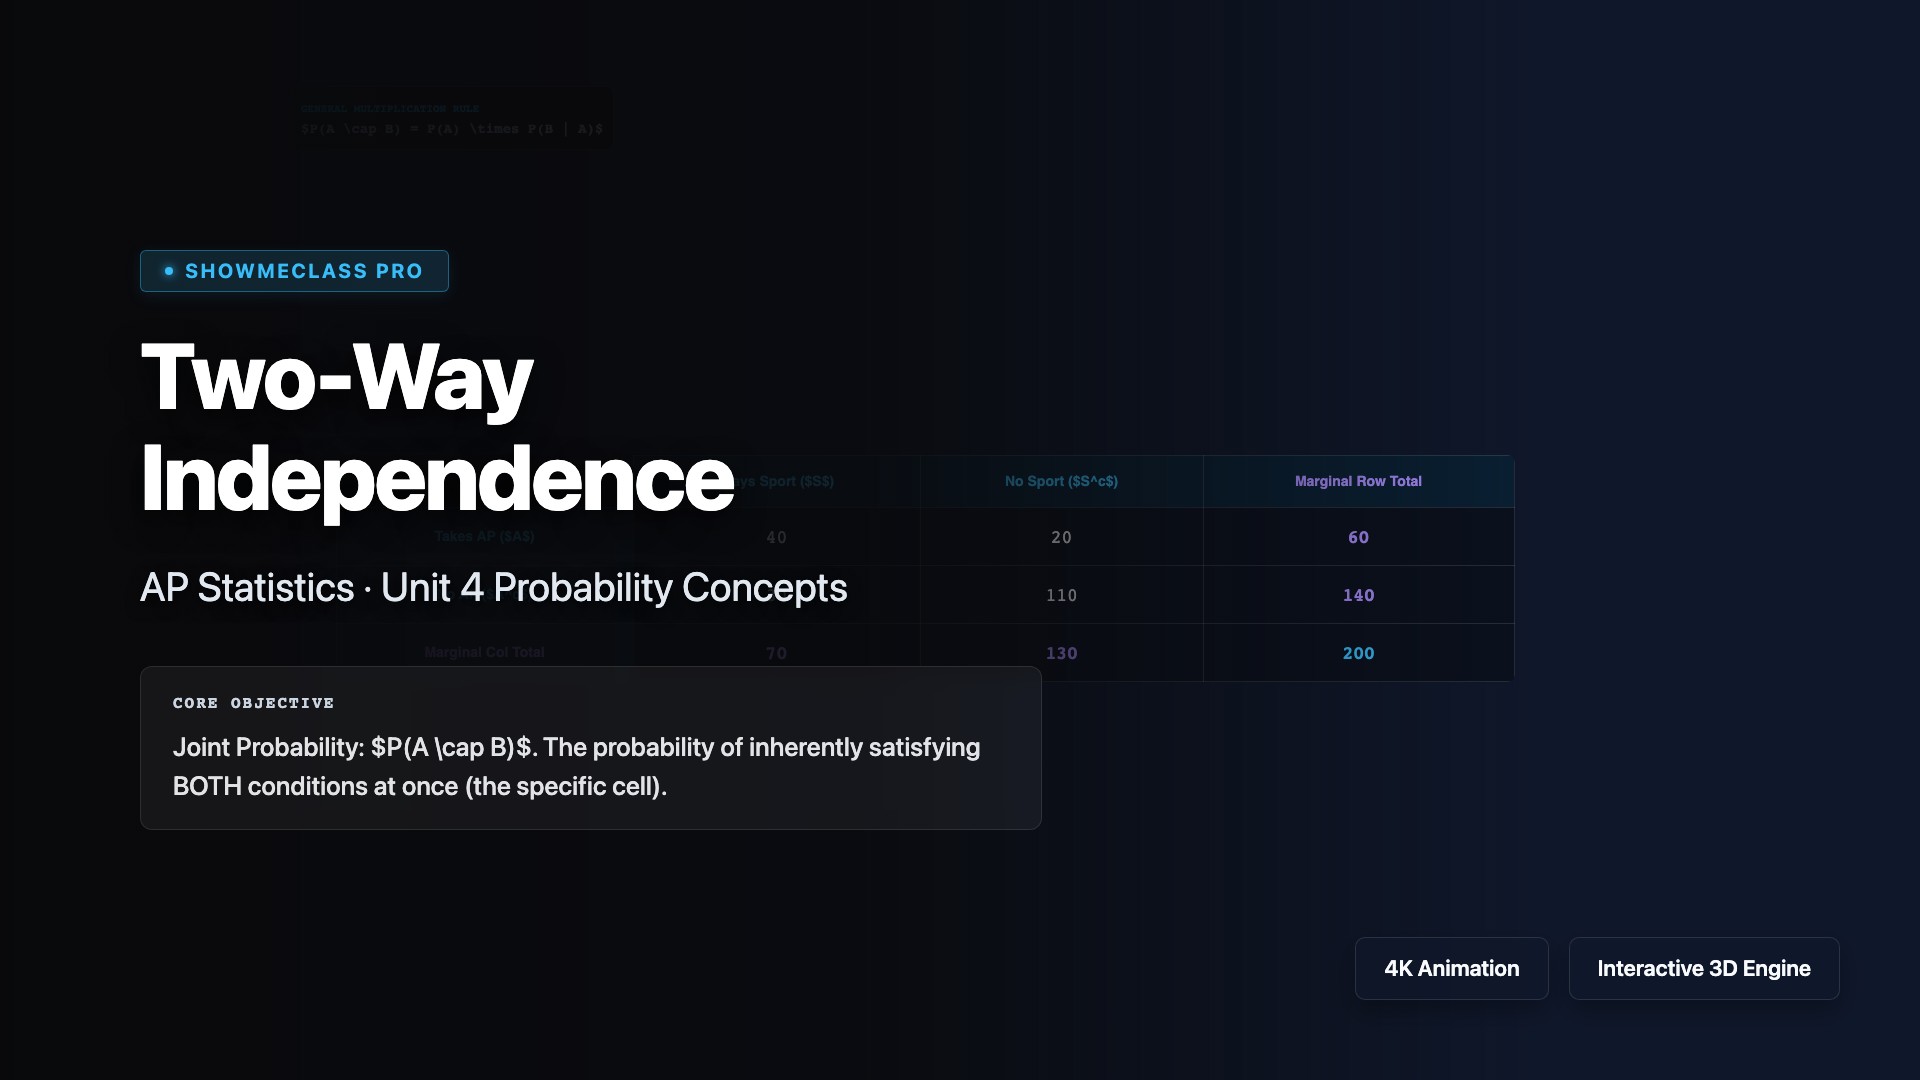
Two-Way Independence
Probability matrices displaying Two-Way intersections visualizing Marginal row sums vs Joint cell probabilities dynamically tracking conditional shrinking denominators highlighting Independence verifications mathematically.
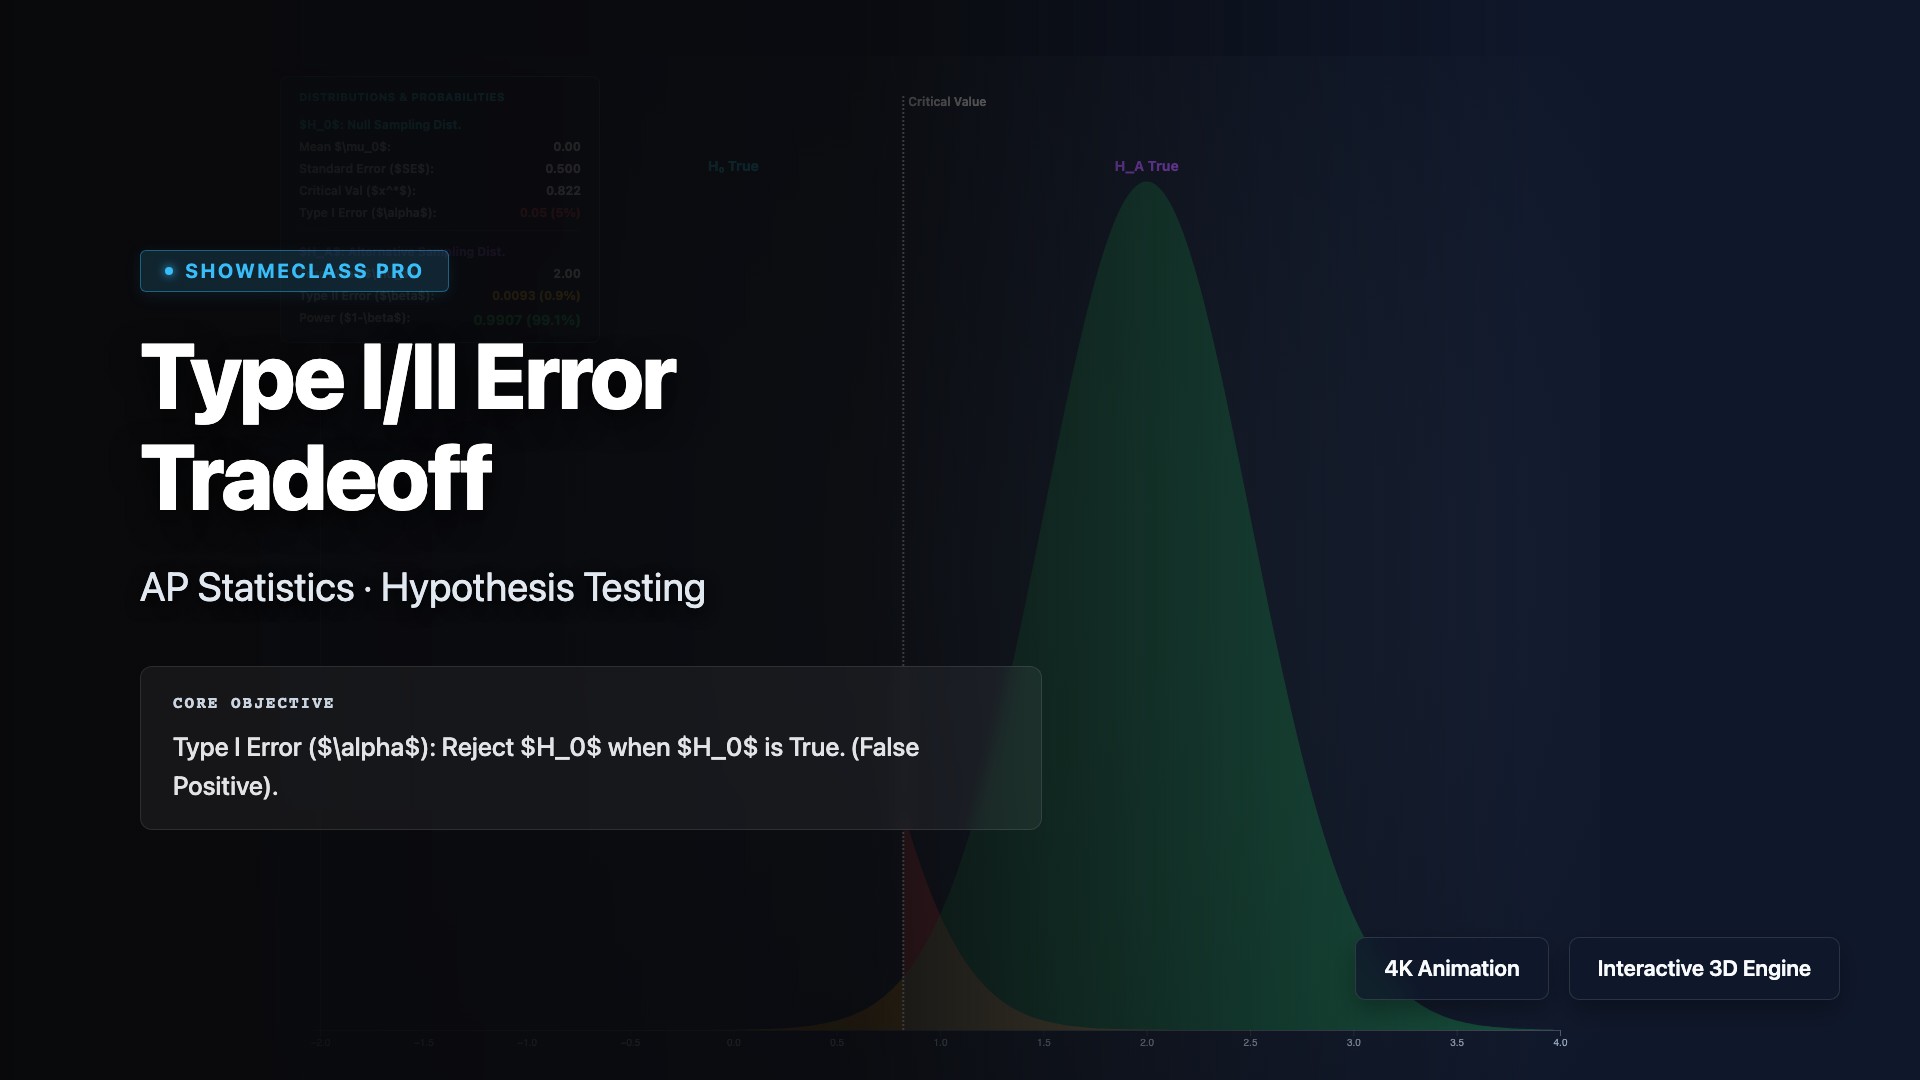
Type I & II Errors & Power
Interactive structural dual-distribution rendering plotting absolute hypothesis decision bounds. Animates the zero-sum mathematical see-saw between Alpha (Type I) restrictions severely punishing statistical Power translating into elevated Type II failures explicitly under sample size constrictions.
Crystal Lattice Structures (FCC/BCC/HCP)
3D rotatable crystal lattice visualizer for SC/BCC/FCC/HCP unit cells. Demonstrates atom-sharing fractions (corner ×1/8, face ×1/2, body ×1), packing efficiency percentages, coordination numbers, and edge-to-radius geometric relationships interactively.
Metallic Bonding & Electron Sea Model
Animated electron sea model showing delocalized valence electrons flowing randomly through a vibrating cation lattice. Applying voltage reveals directional drift current emerging from thermal chaos, explaining metallic conductivity at the atomic level.
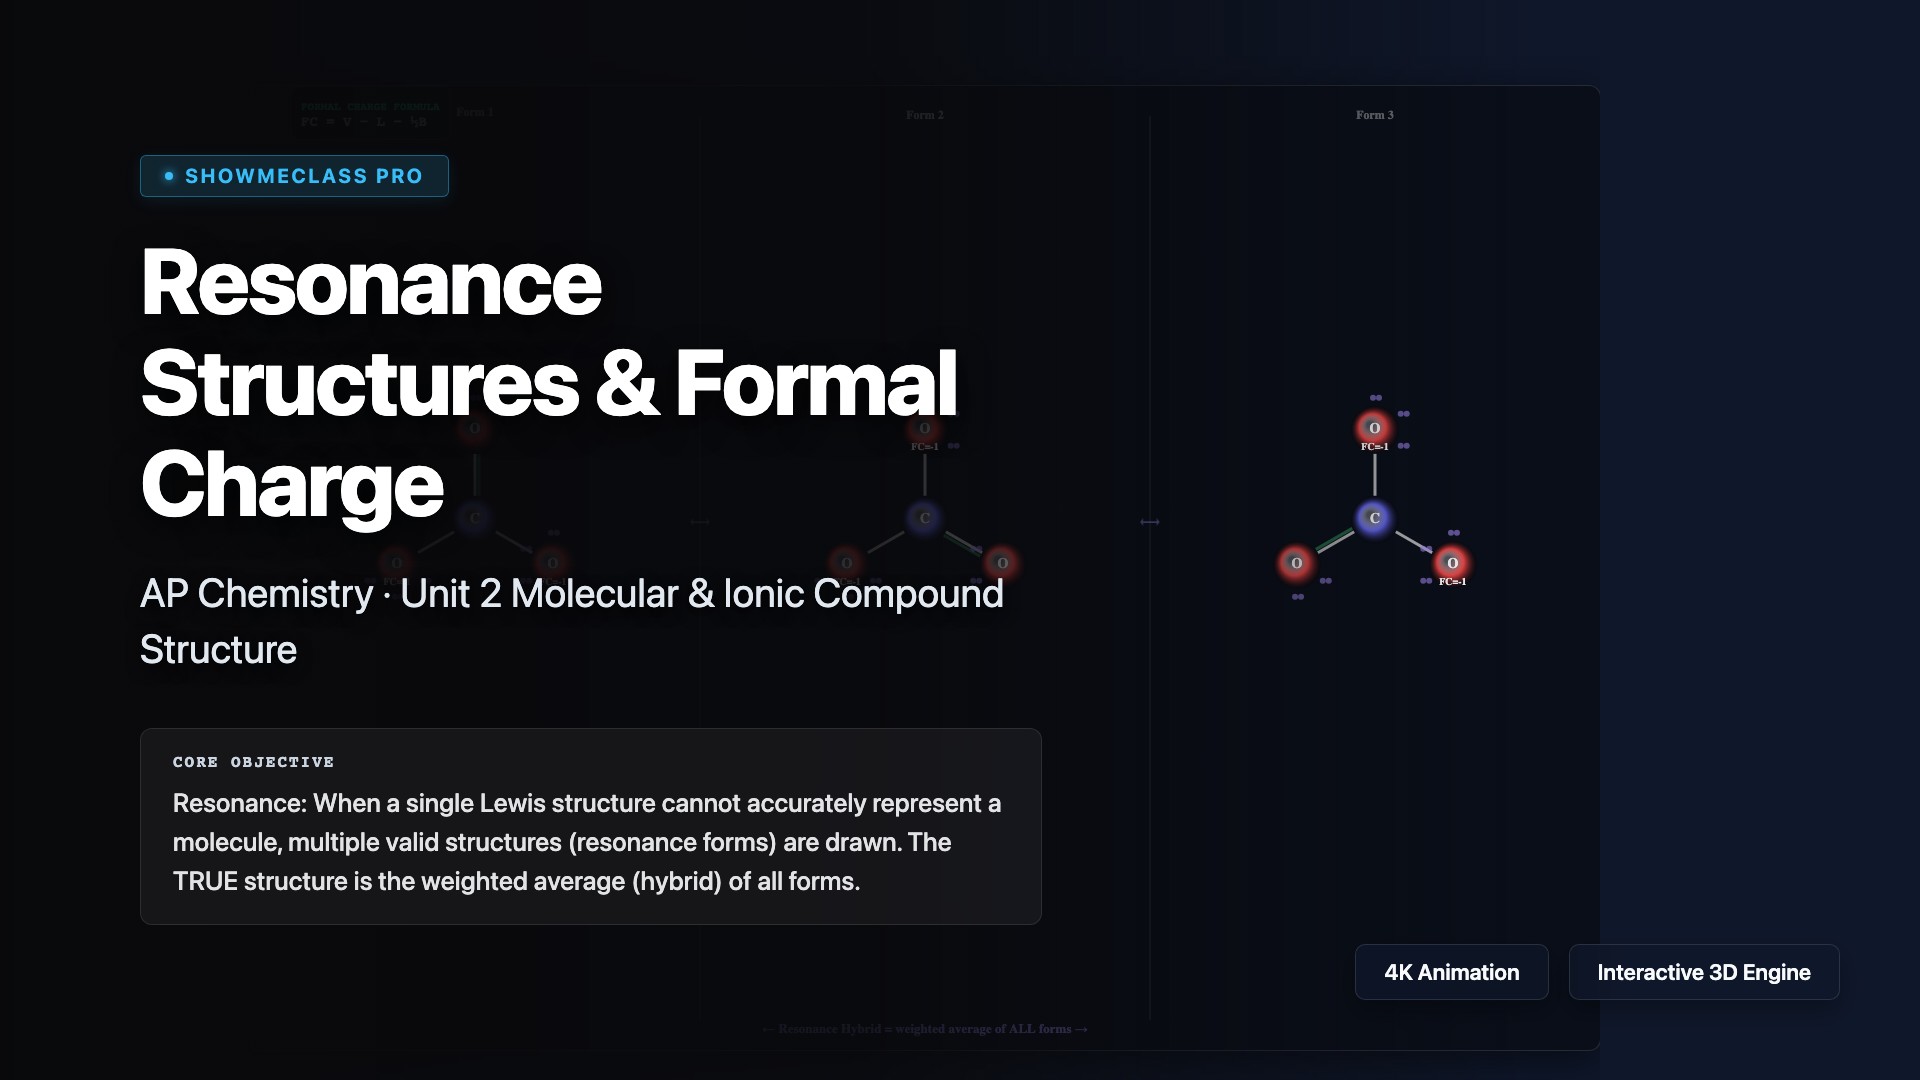
Resonance Structures & Formal Charge
Interactive resonance structure visualizer for CO₃²⁻, NO₃⁻, O₃, benzene, and SO₄²⁻. Displays formal charge calculations (FC = V − L − ½B), fractional bond orders, and electron delocalization across multiple equivalent resonance forms simultaneously.
RGB Color Mixer & Hex Converter
Interactive RGB color mixing with real-time decimal, hexadecimal, and 24-bit binary conversion. Demonstrates additive color model, 8-bit channel depth (256 levels per channel), and the 16.7M color gamut of modern displays.
Boolean Logic Gate Simulator
Interactive Boolean logic gate simulator with 6 gate types (AND, OR, NOT, NAND, XOR, NOR). Features toggleable binary inputs, live truth tables with highlighted active row, and animated circuit diagrams showing signal propagation.
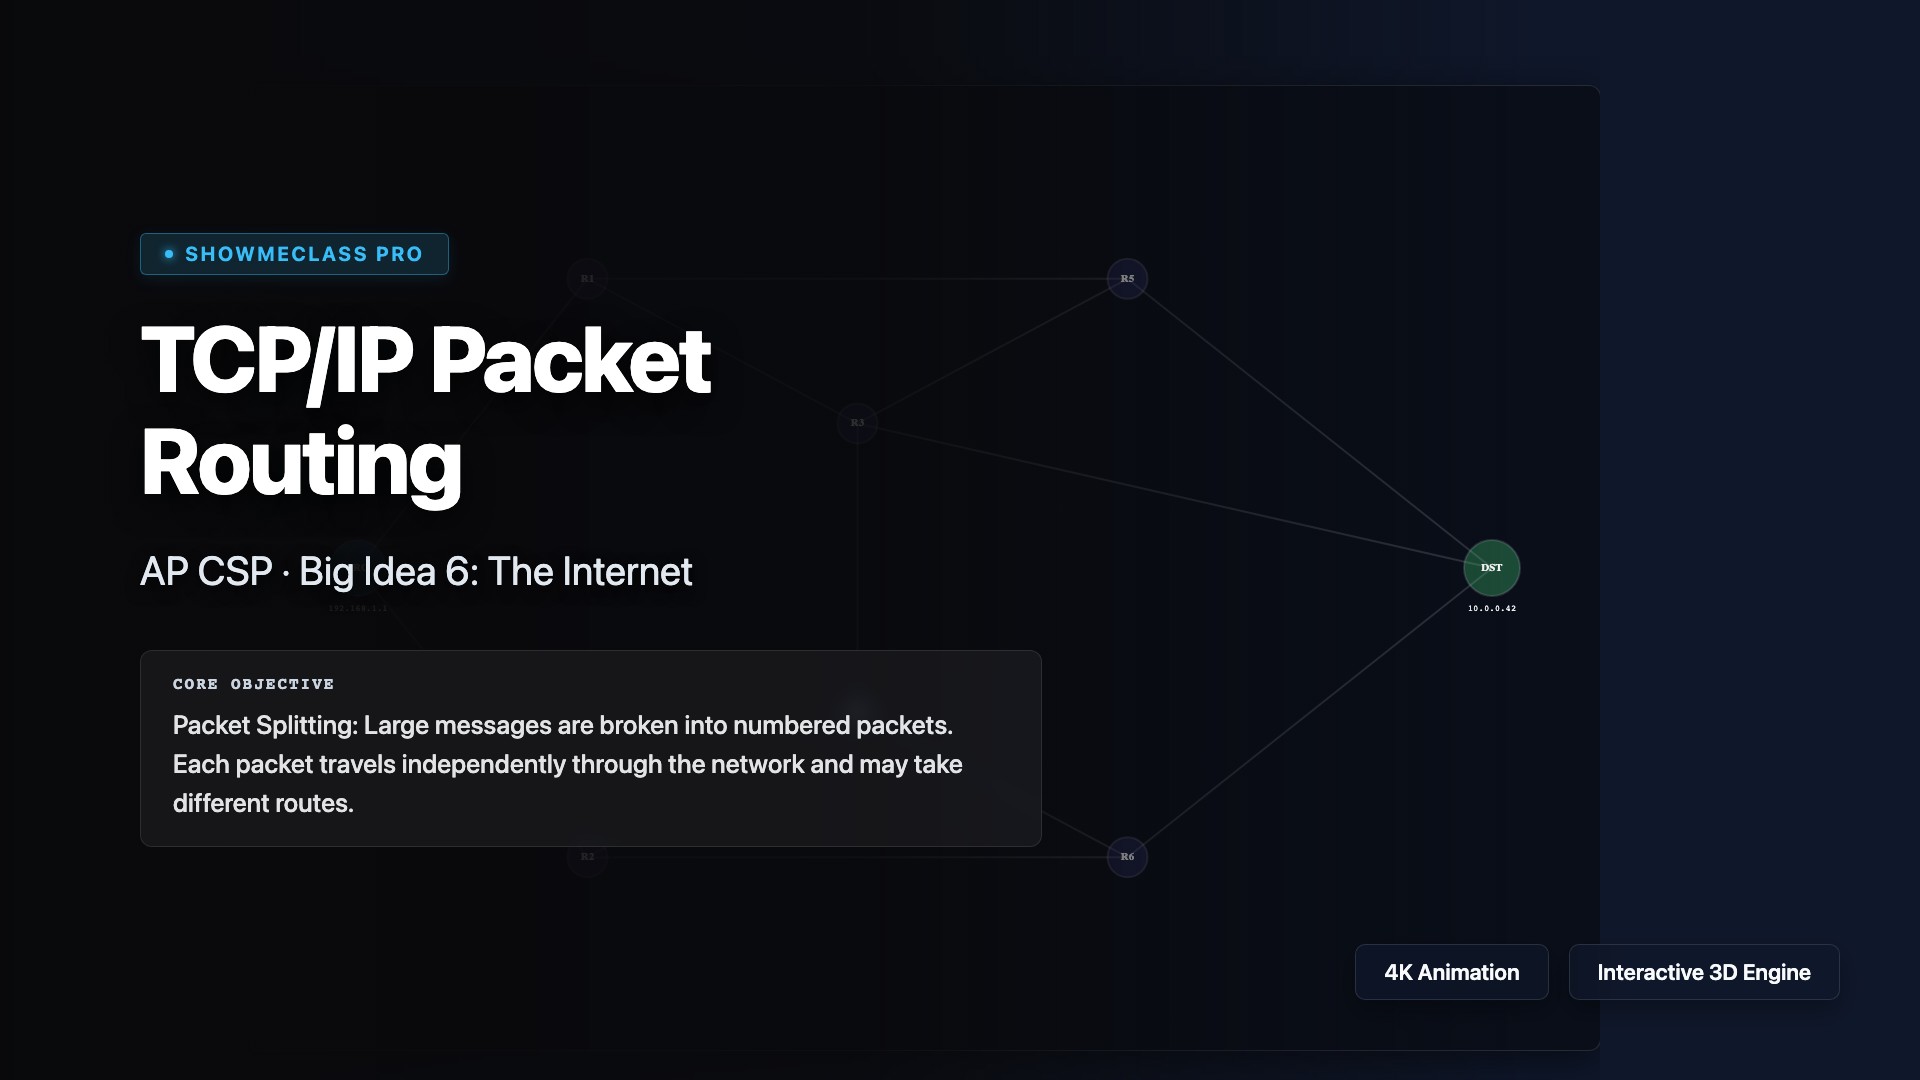
TCP/IP Packet Routing Simulator
Interactive TCP/IP packet routing through a mesh network. Message splitting into numbered packets, multi-path independent routing, router failure fault tolerance, and reassembly at destination demonstrates the core architecture principles of the Internet.
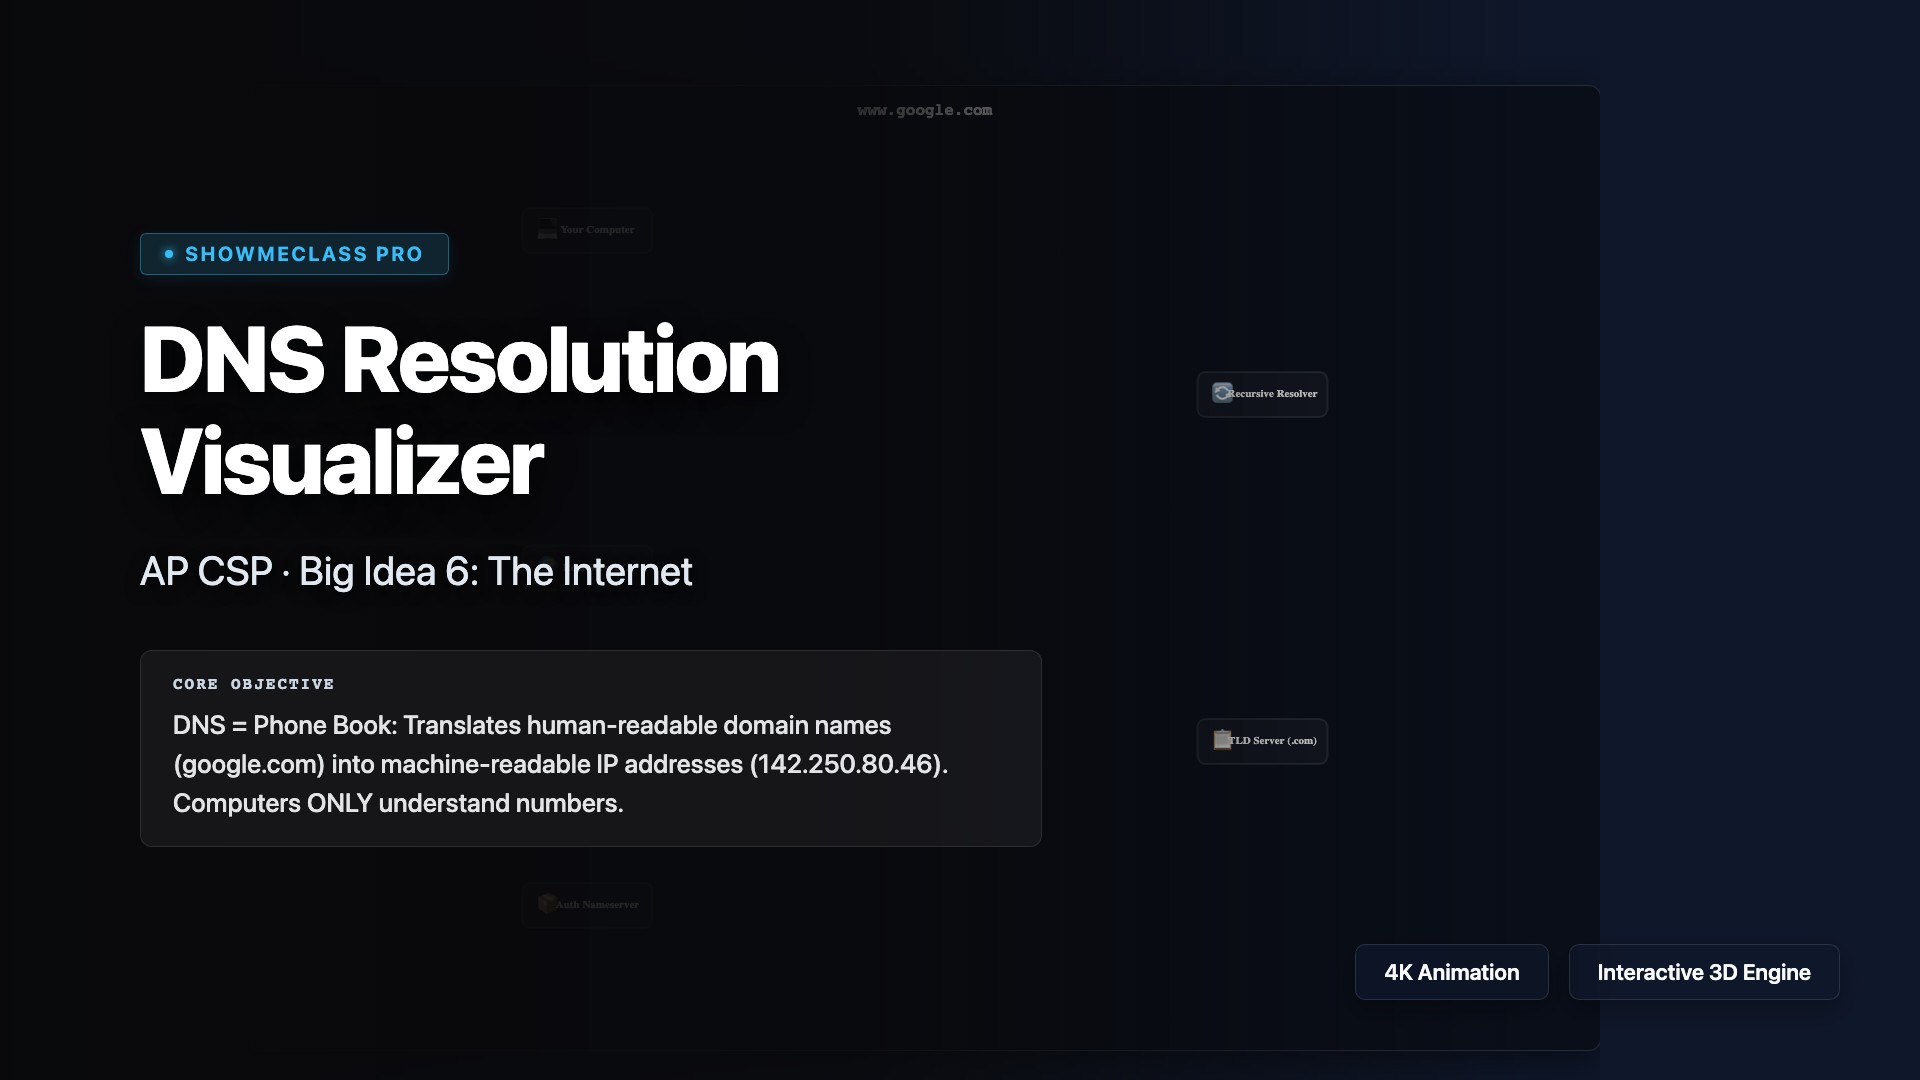
DNS Resolution Visualizer
Step-by-step DNS resolution animation showing the hierarchical lookup cascade from browser cache through recursive resolver, root server (13 clusters), TLD server (.com/.org), to authoritative nameserver, with caching and TTL concepts.
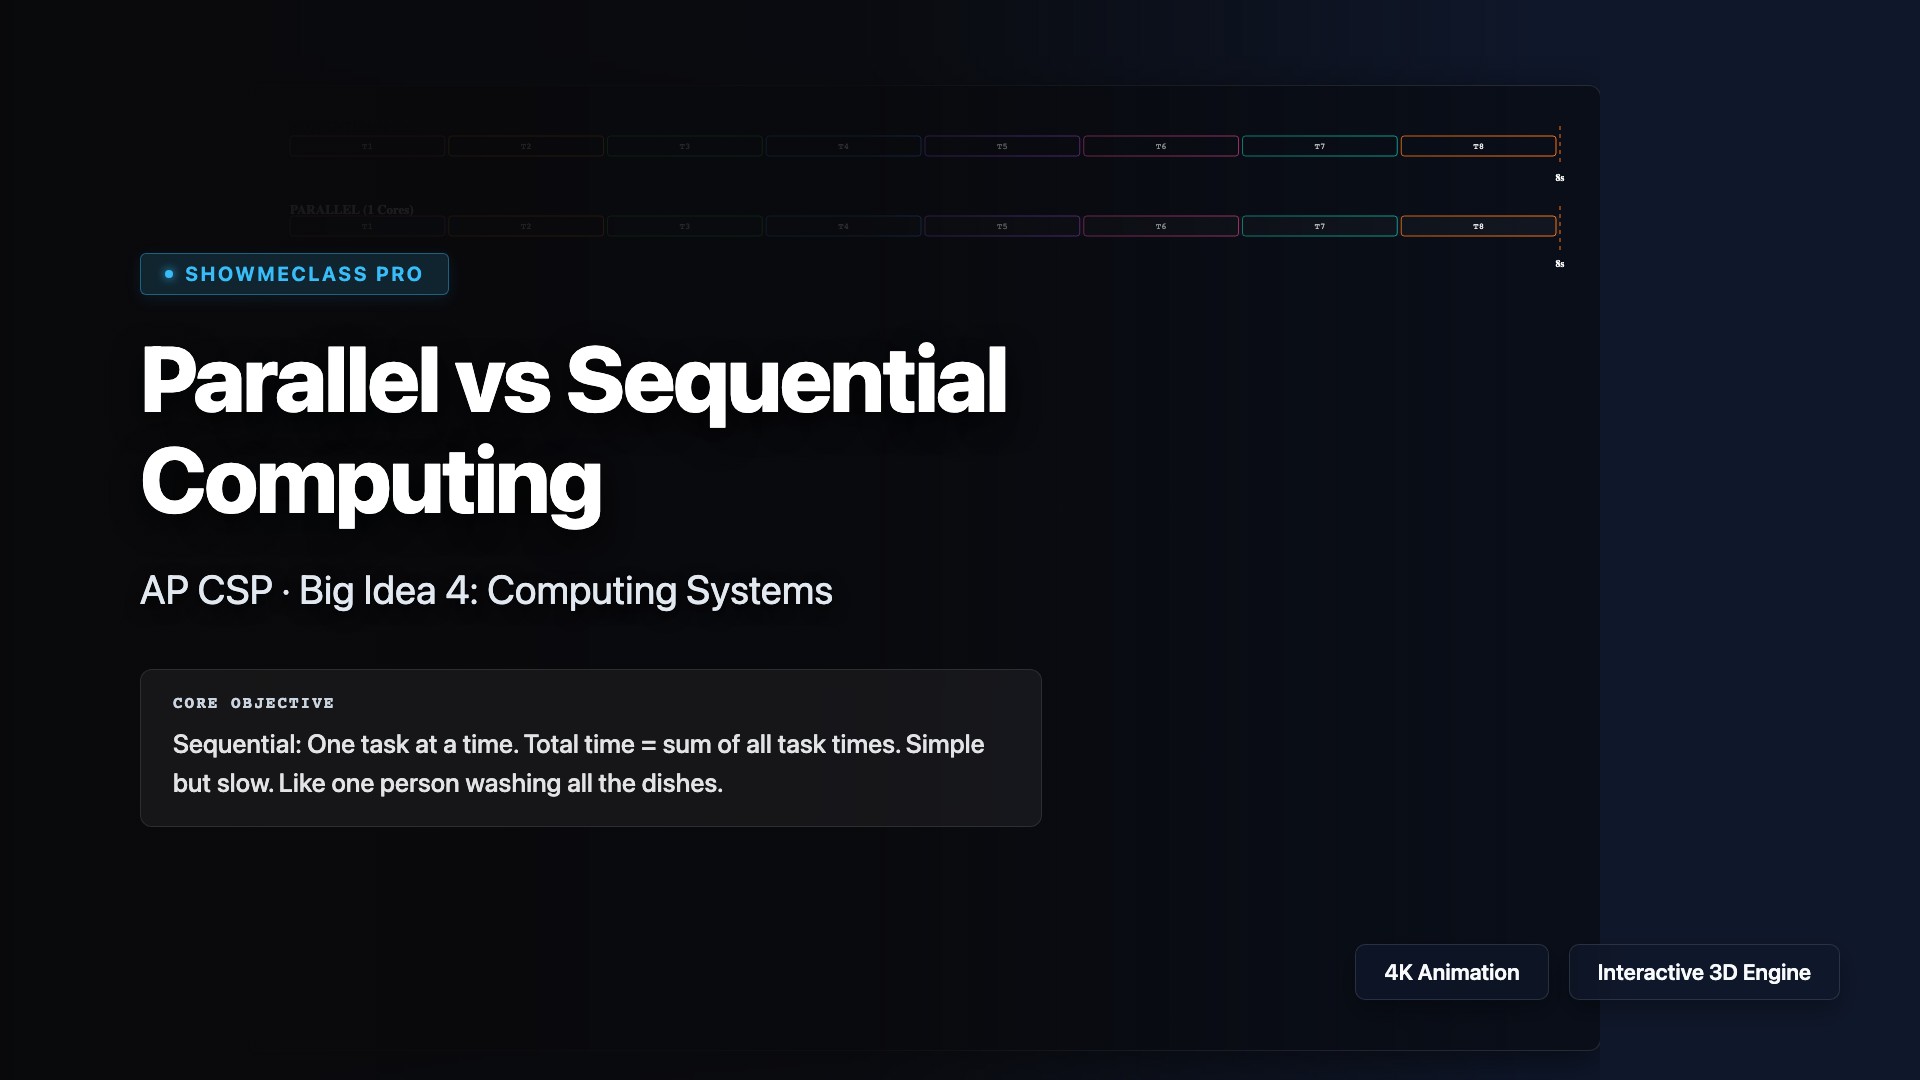
Parallel vs Sequential Computing
Side-by-side visual comparison of sequential vs parallel task scheduling. Adjustable processor cores, task count, and sequential bottleneck percentage demonstrates Amdahl's Law speedup limits, efficiency degradation, and the diminishing returns of adding processors.