
Showing 12 results

Utility Maximization & Diminishing MU
Interactive total and marginal utility curves with diminishing returns bar chart. Adjust quantity and price to find consumer equilibrium where MU/P is optimized, with real-time consumer surplus calculation.

Indifference Curves & Budget Lines
Cobb-Douglas utility model showing indifference curves at multiple utility levels with adjustable budget constraint (income and prices). Visualizes optimal tangency point where MRS = price ratio for consumer equilibrium.
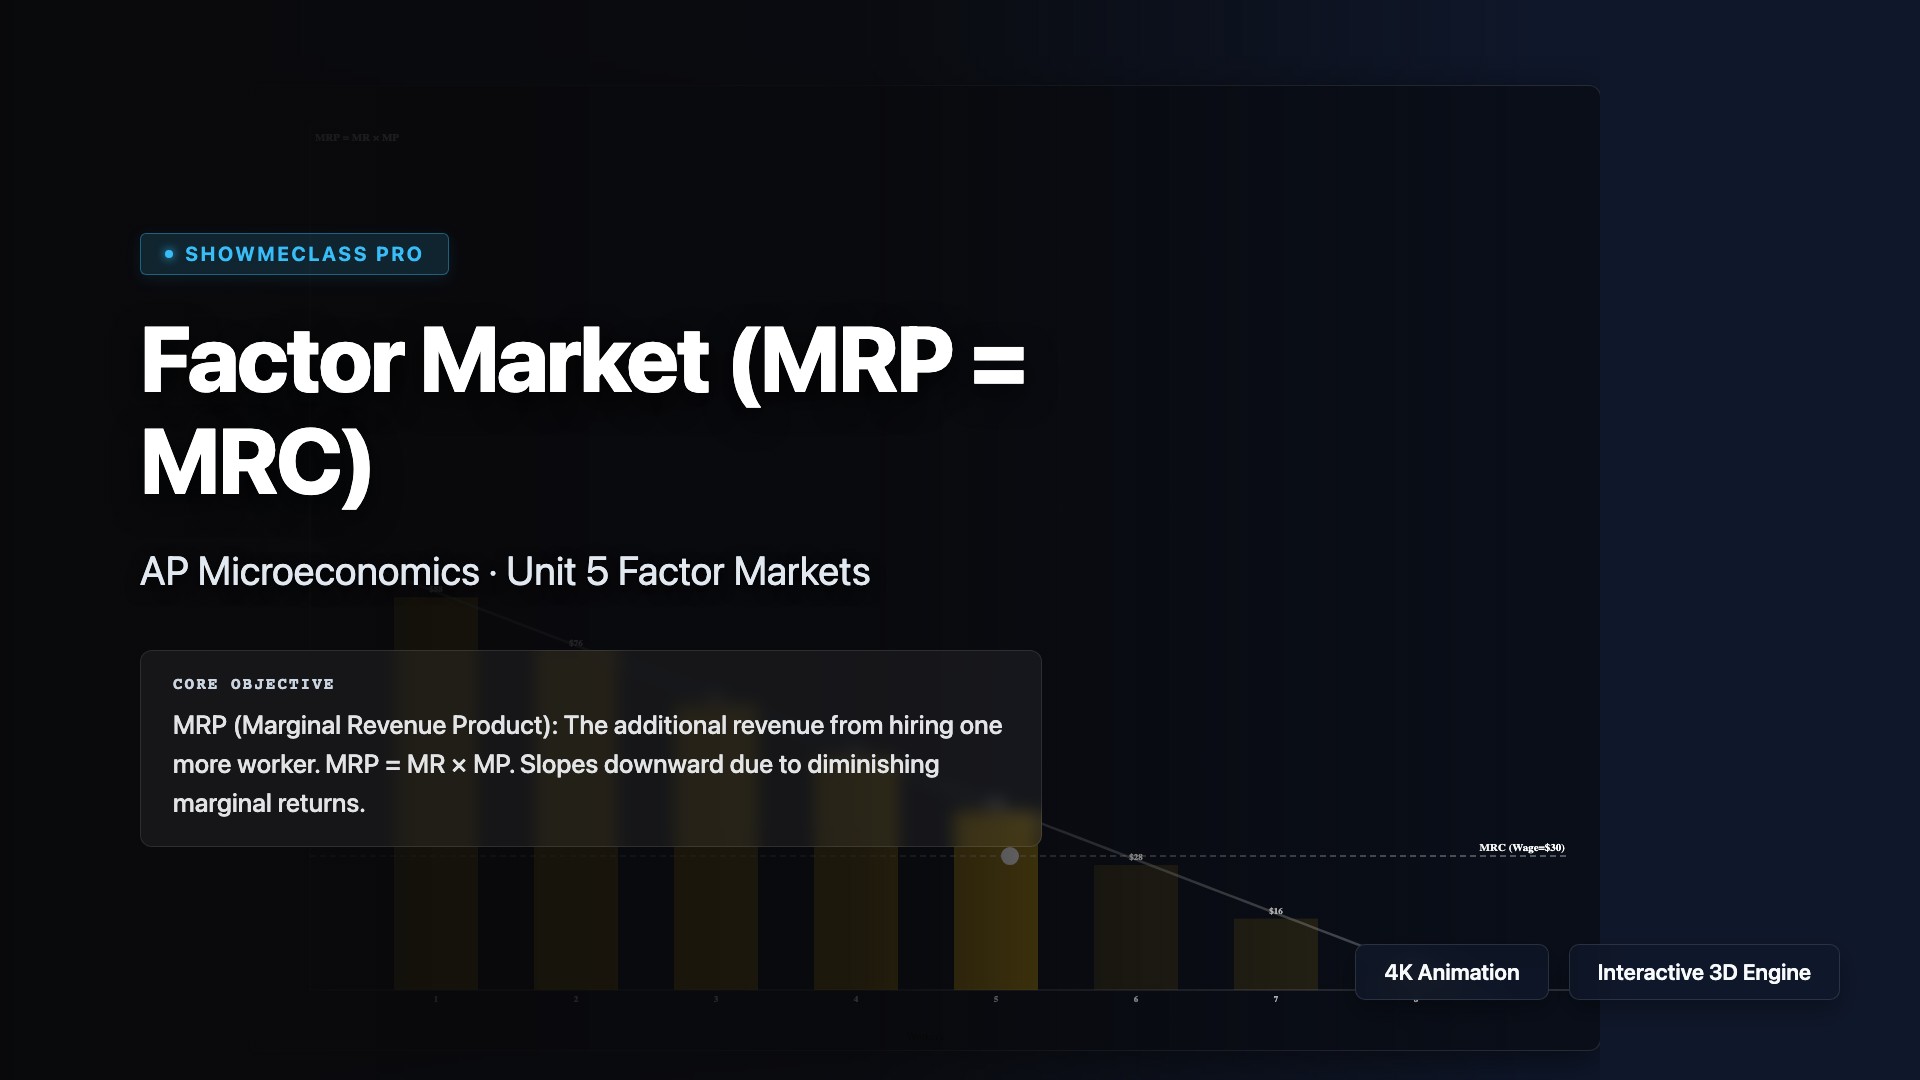
Factor Market (MRP = MRC)
Factor market labor hiring visualization where MRP = MR × MP declines due to diminishing marginal returns. Adjustable product price and wage rate reveal profit-maximizing employment level at MRP = MRC intersection.

Monopolistic Competition (SR/LR)
Monopolistic competition model showing differentiated product pricing with downward-sloping demand. Toggle between short-run profit, short-run loss, and long-run zero-profit tangency condition with ATC/MC/D/MR curves.

Oligopoly & Kinked Demand Curve
Kinked demand curve model explaining oligopoly price rigidity. Adjustable kink price and MC level demonstrate how the vertical MR gap allows cost changes without price adjustment — the core mechanism behind sticky prices in oligopolistic markets.
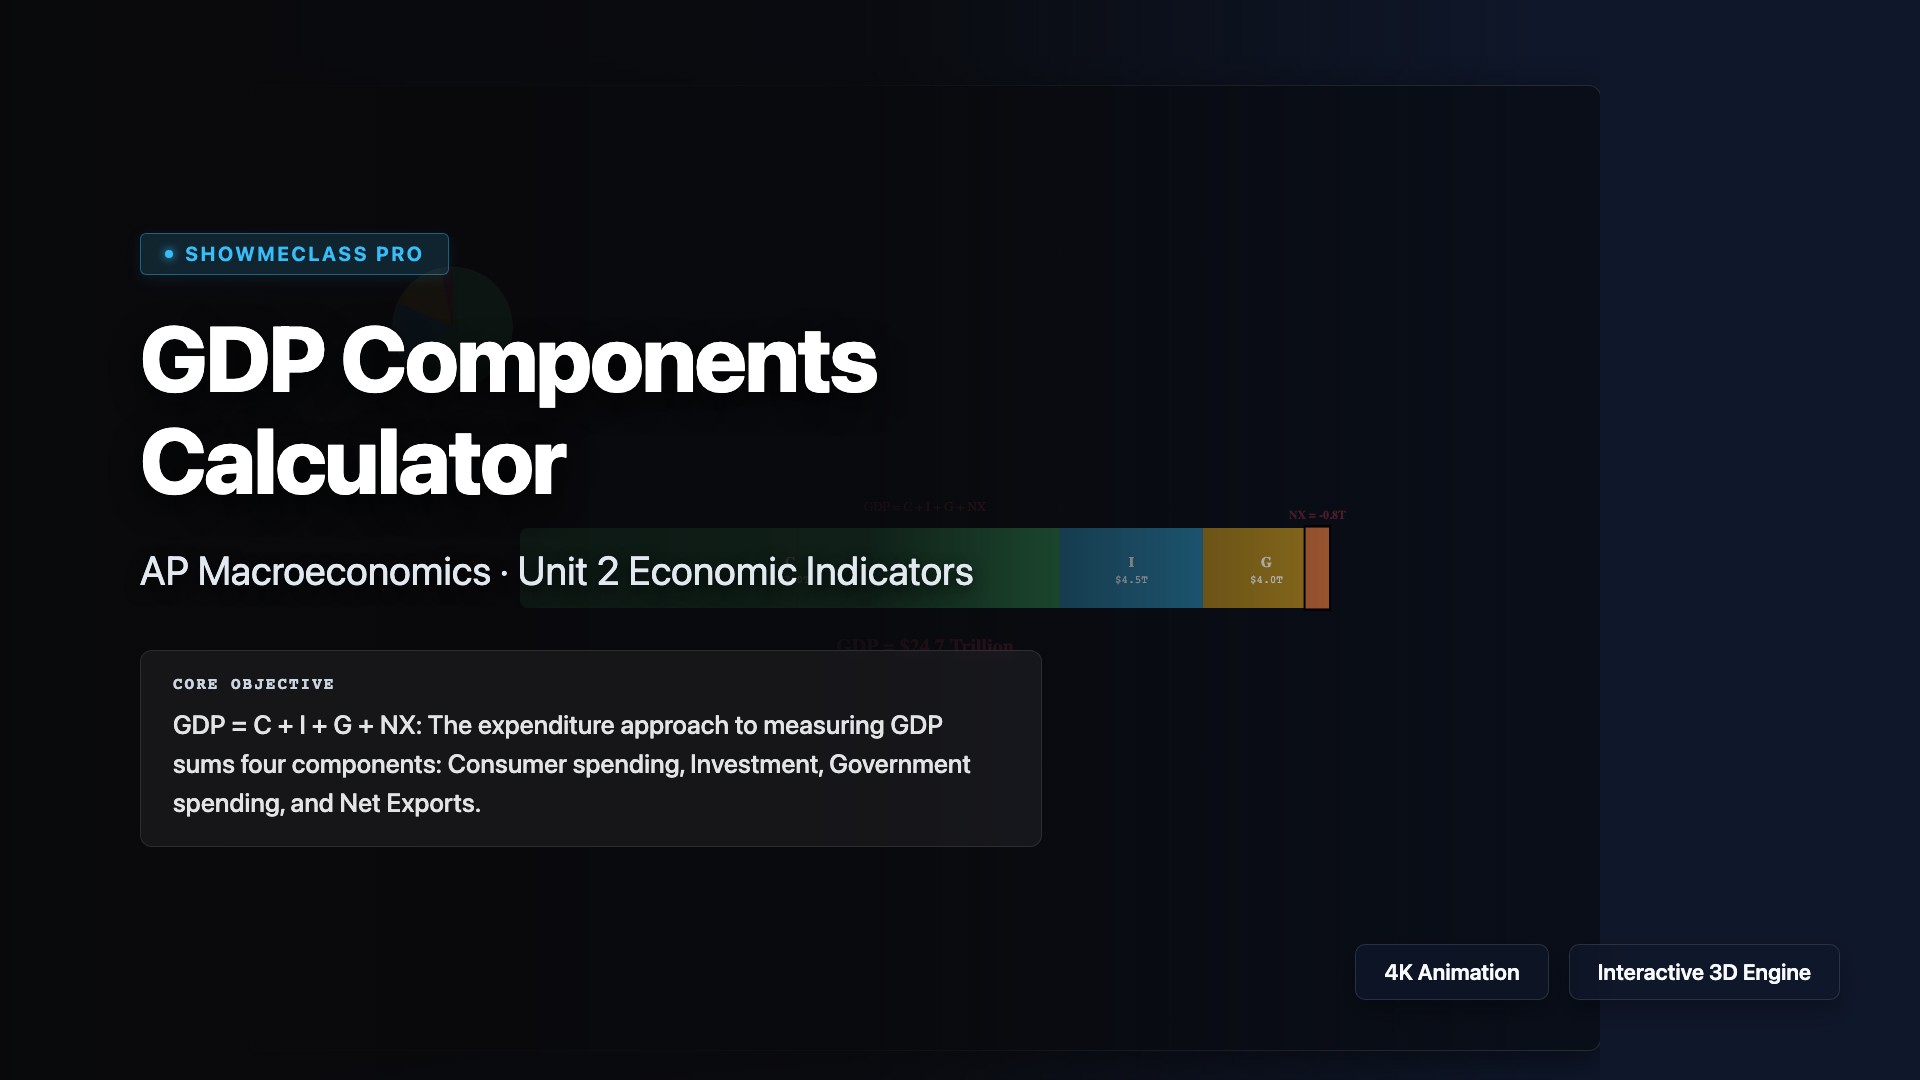
GDP Components Calculator (C+I+G+NX)
Interactive GDP expenditure approach calculator. Adjust Consumption, Investment, Government spending, and Net Exports with real-time stacked bar and pie chart visualization showing US-benchmarked component share percentages.

Fiscal Policy & Multiplier Effect
Spending and tax multiplier calculator with cascading round-by-round visualization. Compares government spending multiplier (1/MPS) vs tax multiplier (-MPC/MPS) to demonstrate why $1 of spending has greater GDP impact than $1 of tax cuts.

Monetary Policy & The Federal Reserve
Dual-panel Fed monetary policy transmission mechanism. Left panel shows Money Market (MS/MD) equilibrium; right panel shows resulting AD-AS model shift. Toggle expansionary vs contractionary to trace the full causal chain from bond purchases to GDP change.
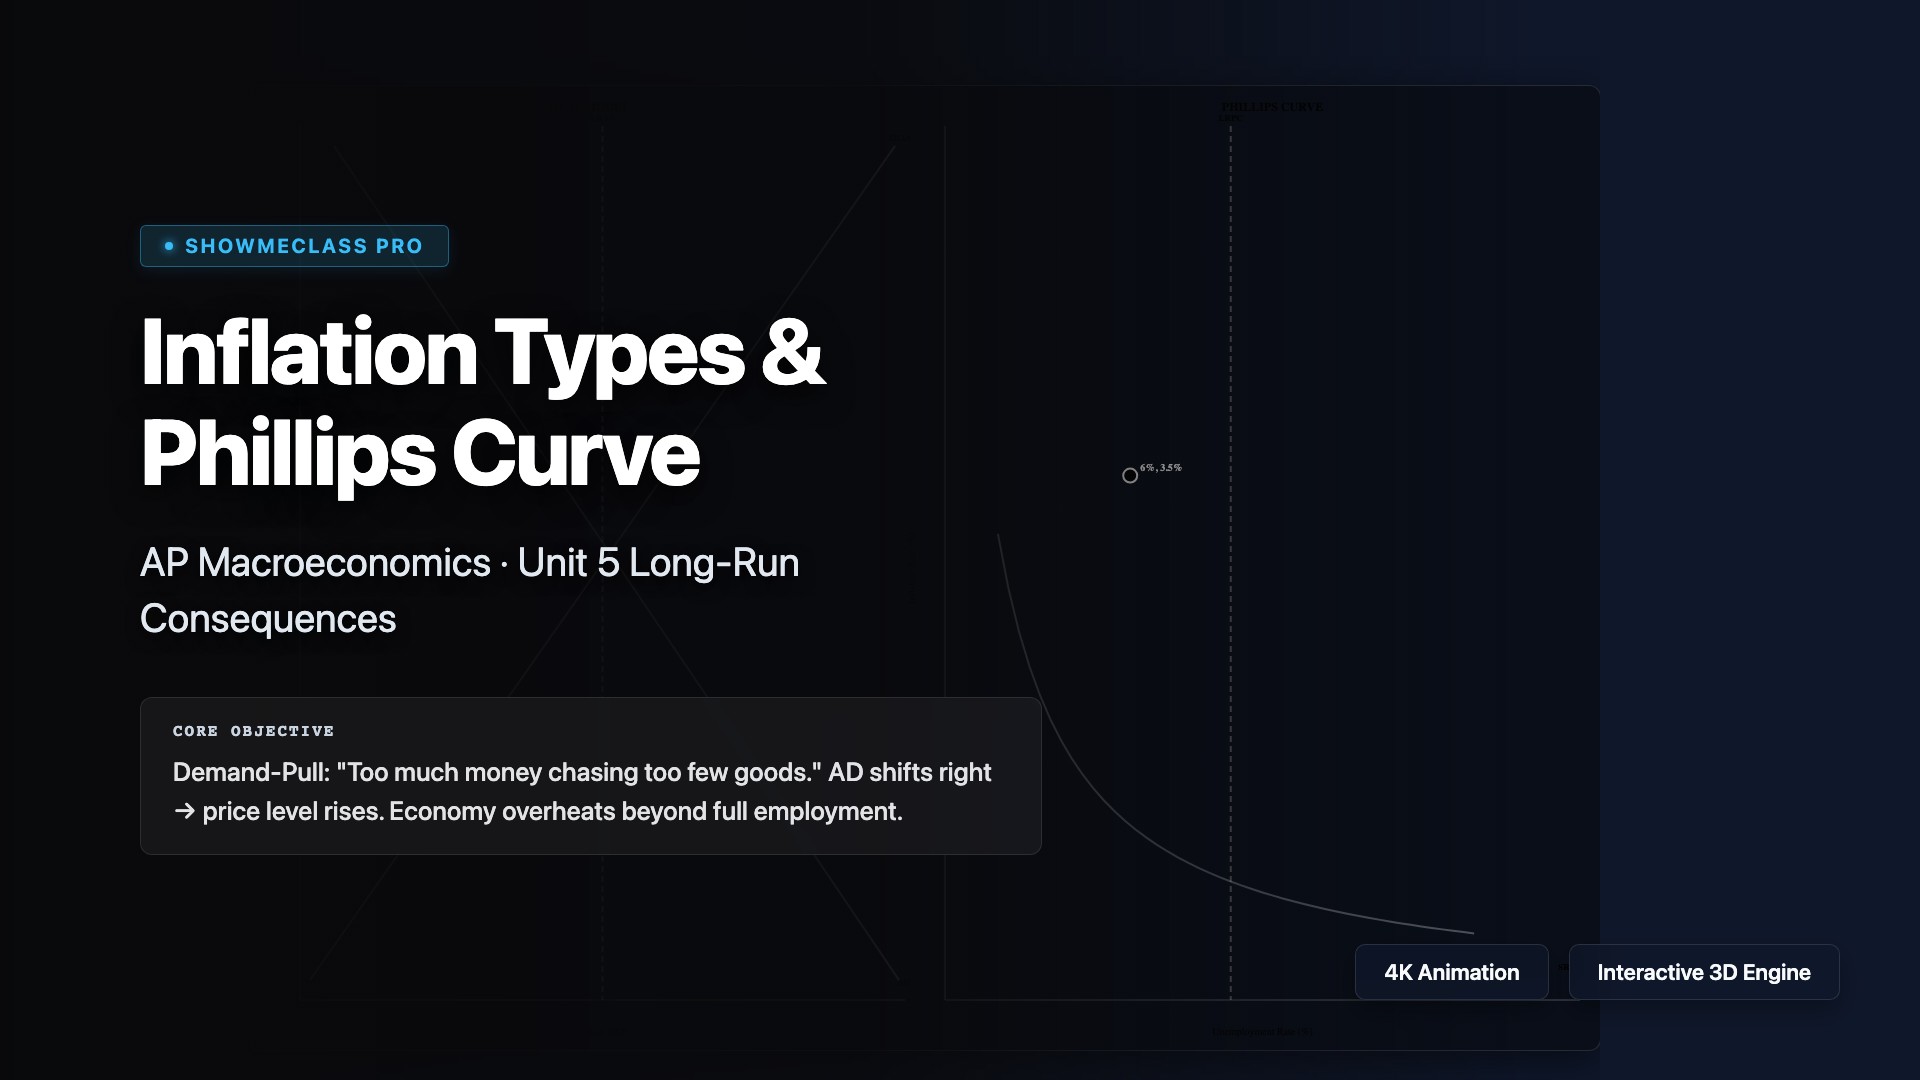
Inflation Types & Phillips Curve
Dual visualization showing AD-AS model alongside the Phillips Curve for demand-pull inflation (AD right), cost-push stagflation (SRAS left), and equilibrium scenarios. Demonstrates the short-run inflation-unemployment tradeoff.
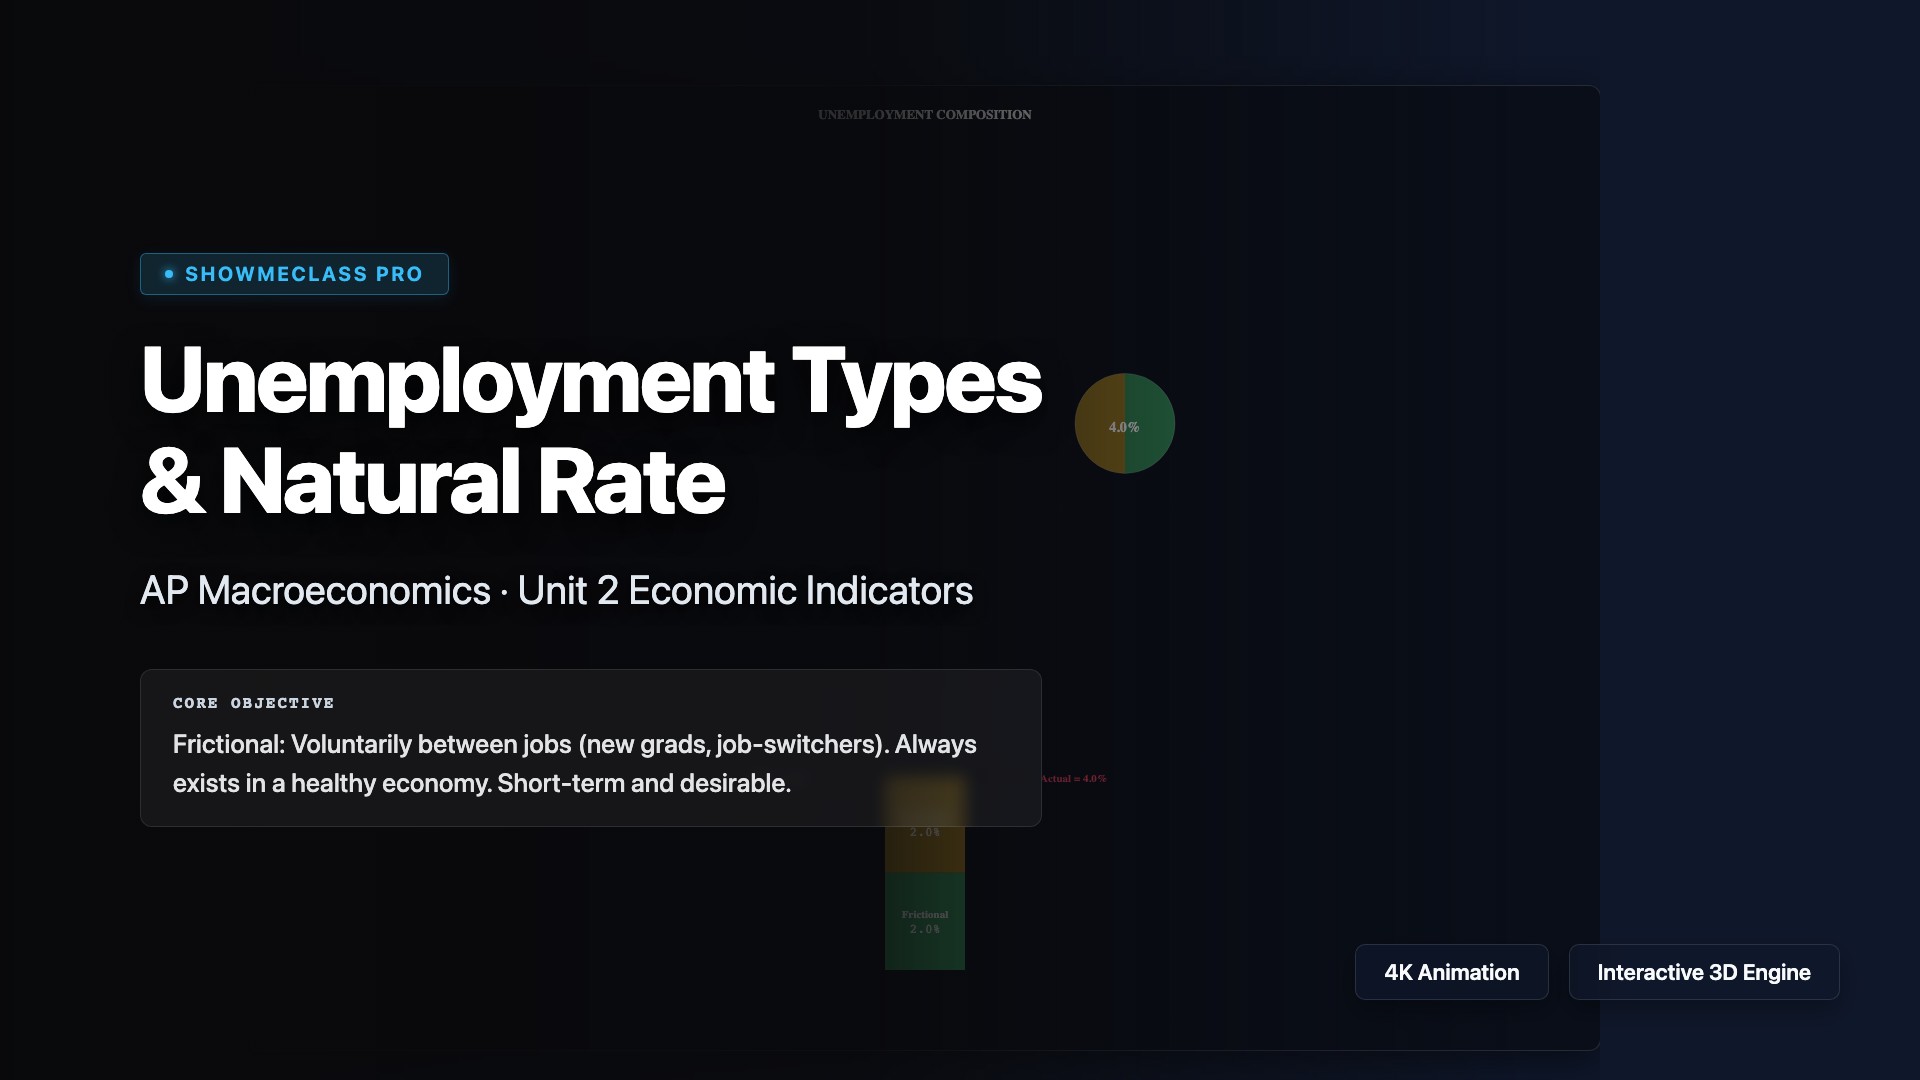
Unemployment Types & Natural Rate
Stacked bar and pie chart decomposition of 3 unemployment types (frictional, structural, cyclical). Adjustable components reveal Natural Rate of Unemployment (NRU = frictional + structural), GDP gap assessment, and economy status classification.

Erikson's Psychosocial Stages
Interactive 8-stage staircase visualization of Erikson's psychosocial development theory. Click each stage to explore the crisis pair, age range, virtue gained, and real-world implications from infancy through late adulthood.

Freud's Psychosexual Stages
Five-column visualization of Freud's psychosexual stages (Oral, Anal, Phallic, Latency, Genital) with erogenous zones, developmental focus areas, and fixation outcomes that shape adult personality traits.