
Showing 12 results
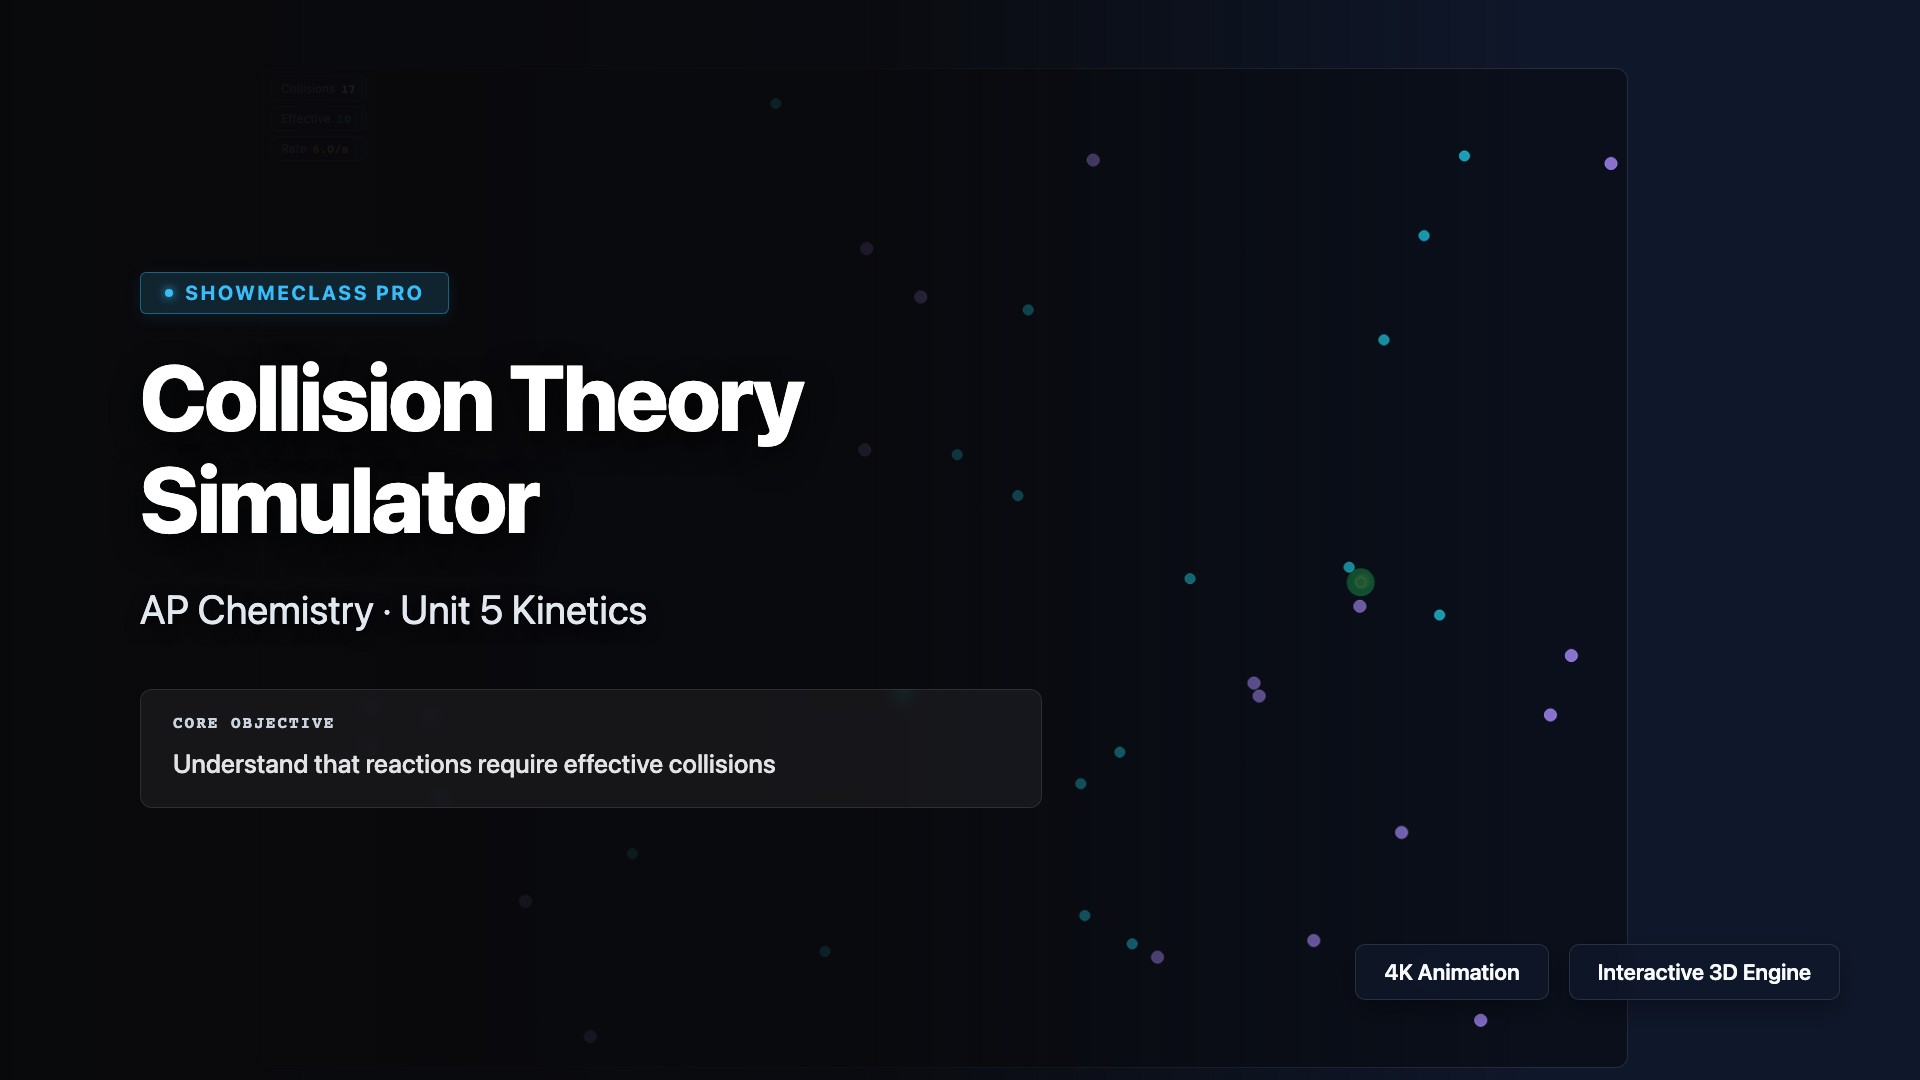
Collision Theory Particle Simulator
Animated particle simulation demonstrating collision theory. Particles of two types collide with visual feedback: green flashes for effective collisions (sufficient energy + correct orientation) and red flashes for ineffective ones. Adjustable temperature, particle count, and activation energy threshold.
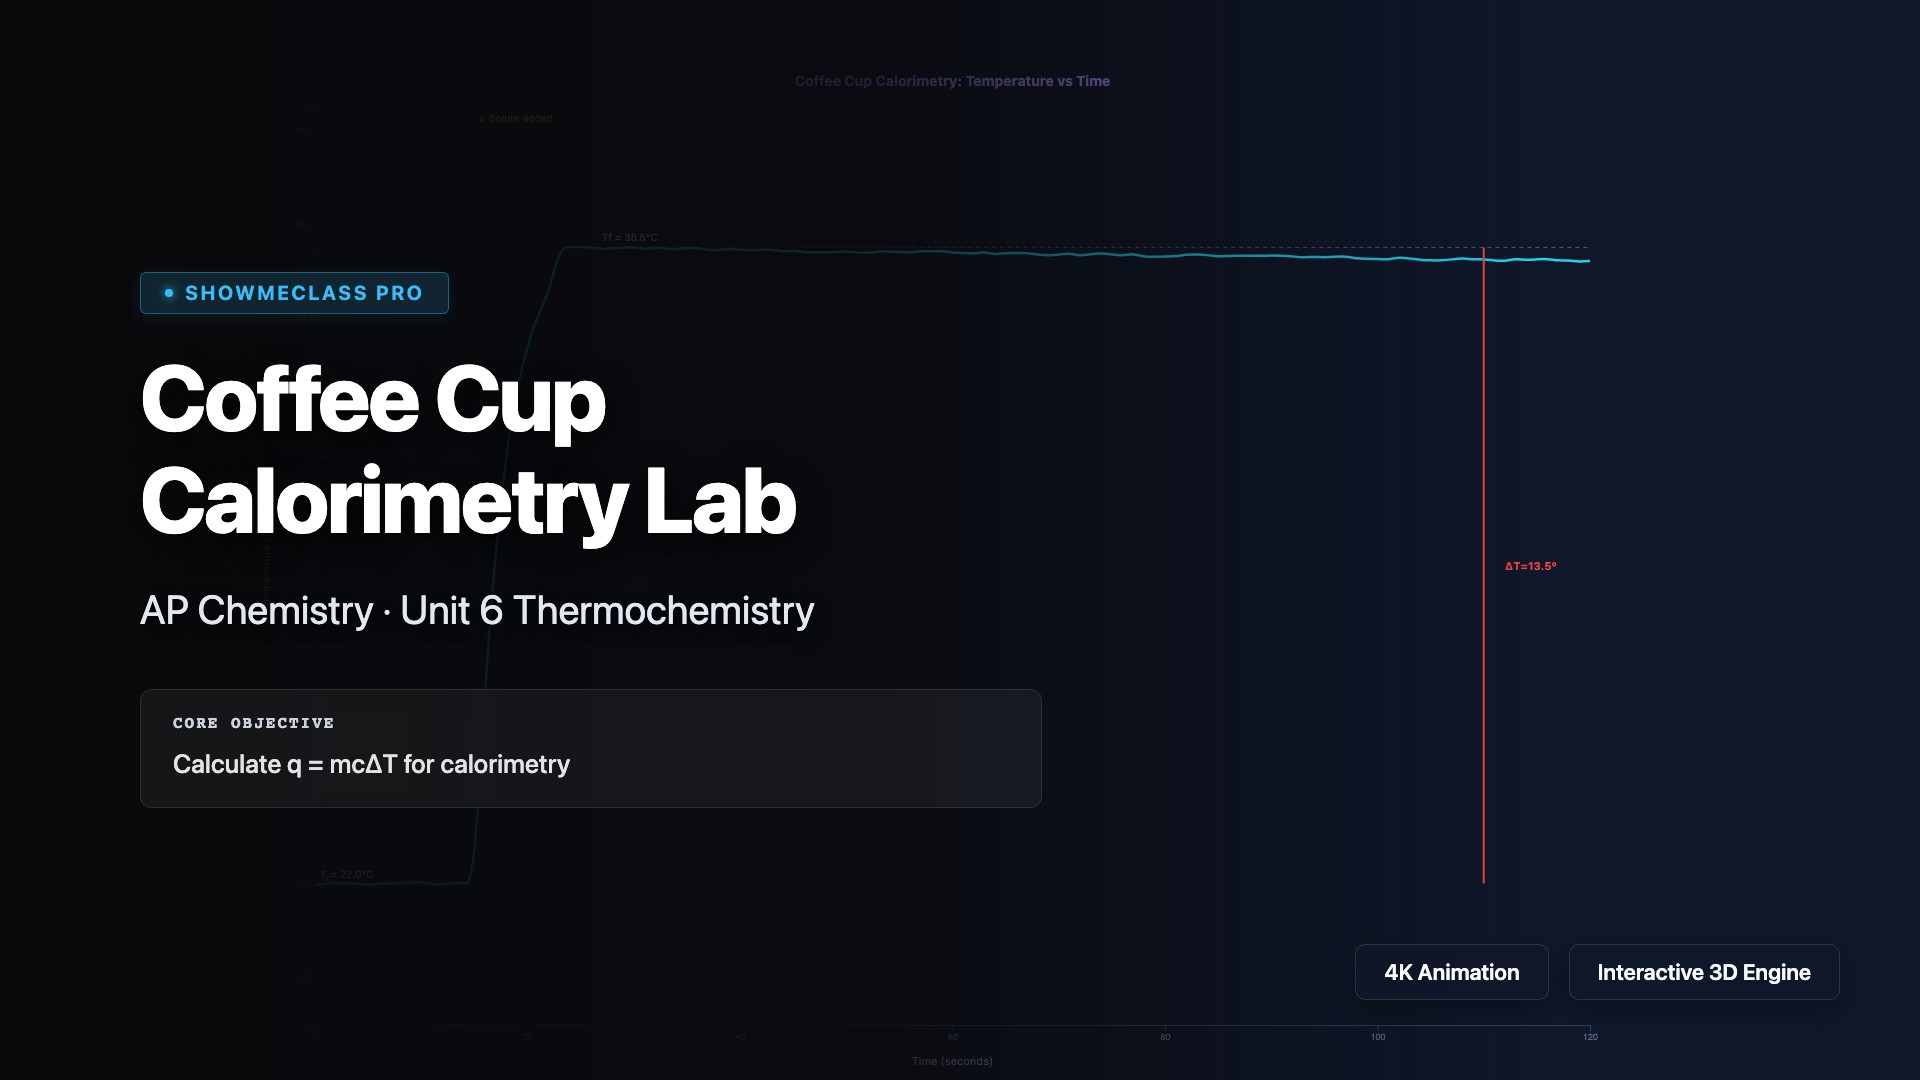
Coffee Cup Calorimetry Lab
Virtual coffee cup calorimetry lab with interactive temperature vs time graph. Calculate q=mcΔT, determine qrxn and ΔH from experimental data. Adjustable mass, initial/final temperature, and moles of solute. Automatically classifies reactions as exothermic or endothermic with step-by-step calculation display.
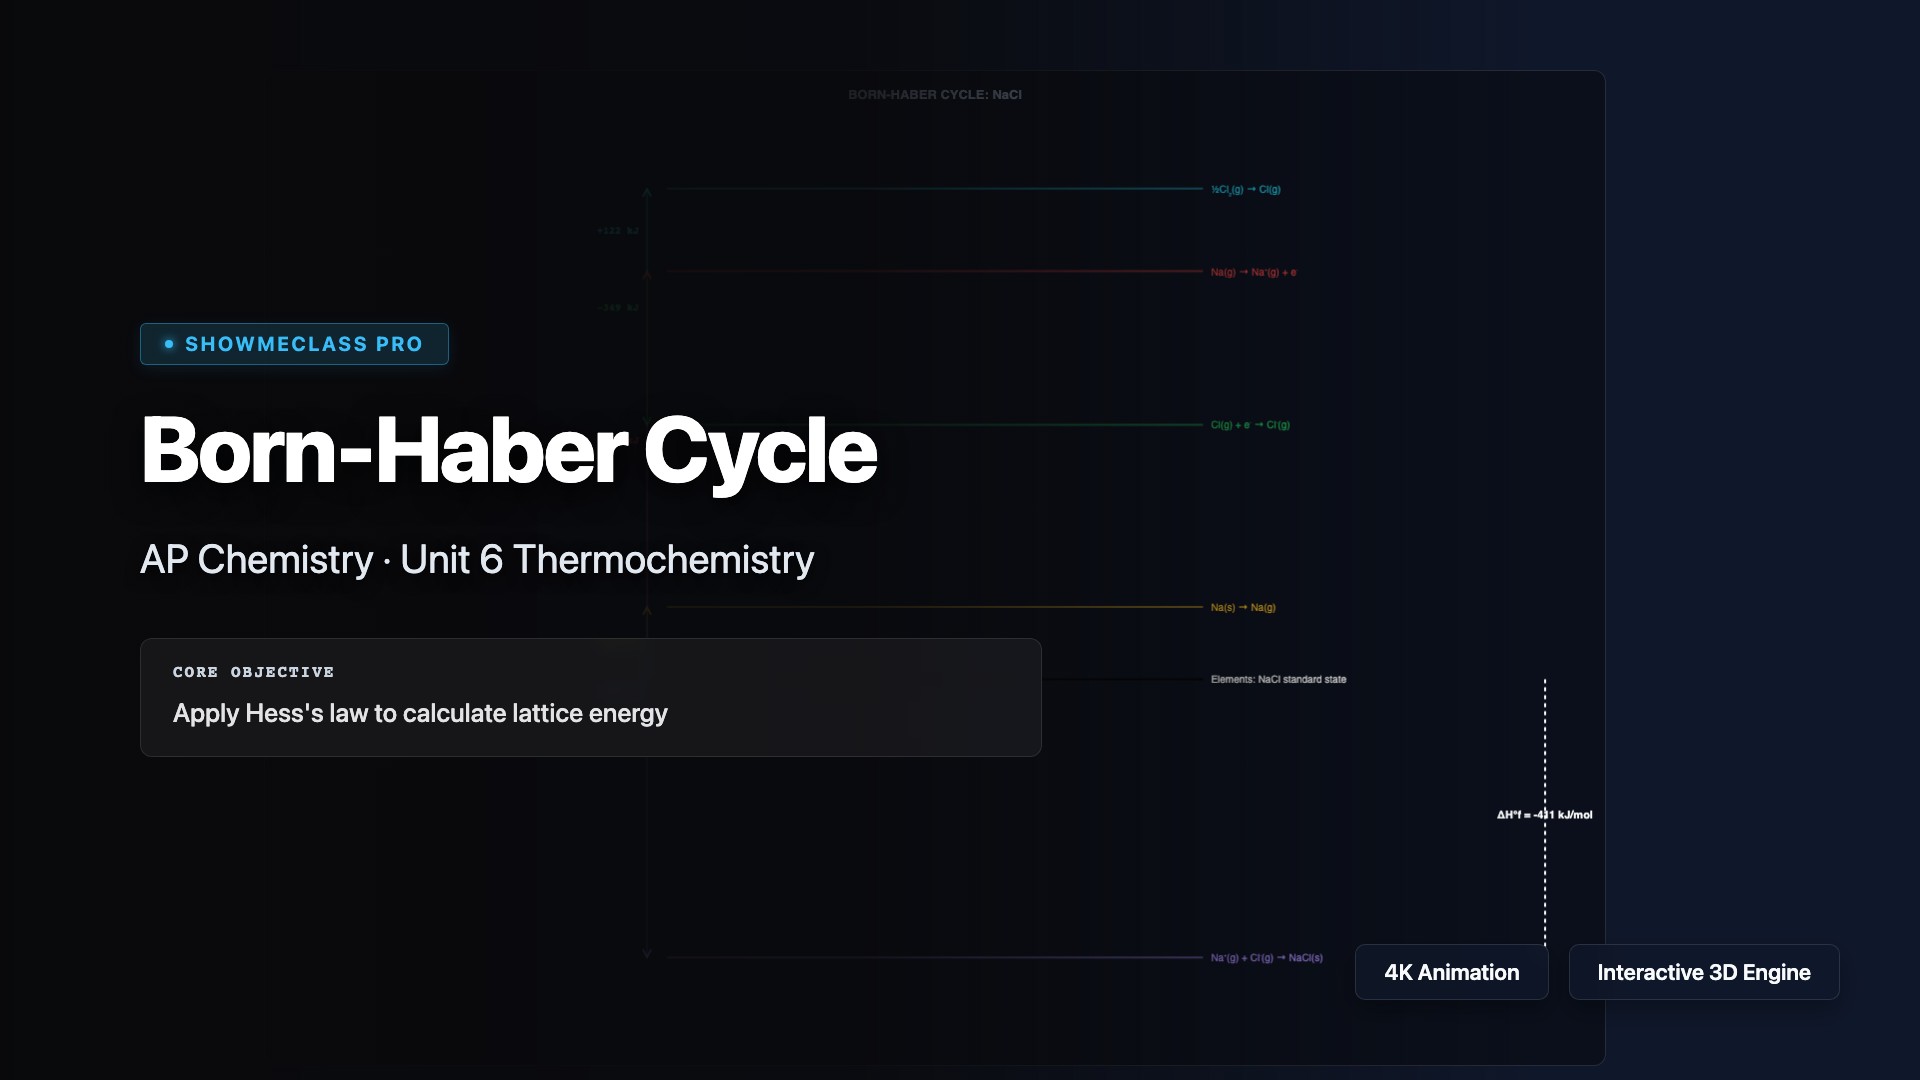
Born-Haber Cycle (Lattice Energy)
Visual energy level diagram for Born-Haber thermodynamic cycles. Explore 4 ionic compounds (NaCl, KBr, MgO, CaF₂) with verified thermodynamic data for each step: sublimation, ionization energy, bond dissociation, electron affinity, and lattice energy. Apply Hess's law to calculate lattice energy.
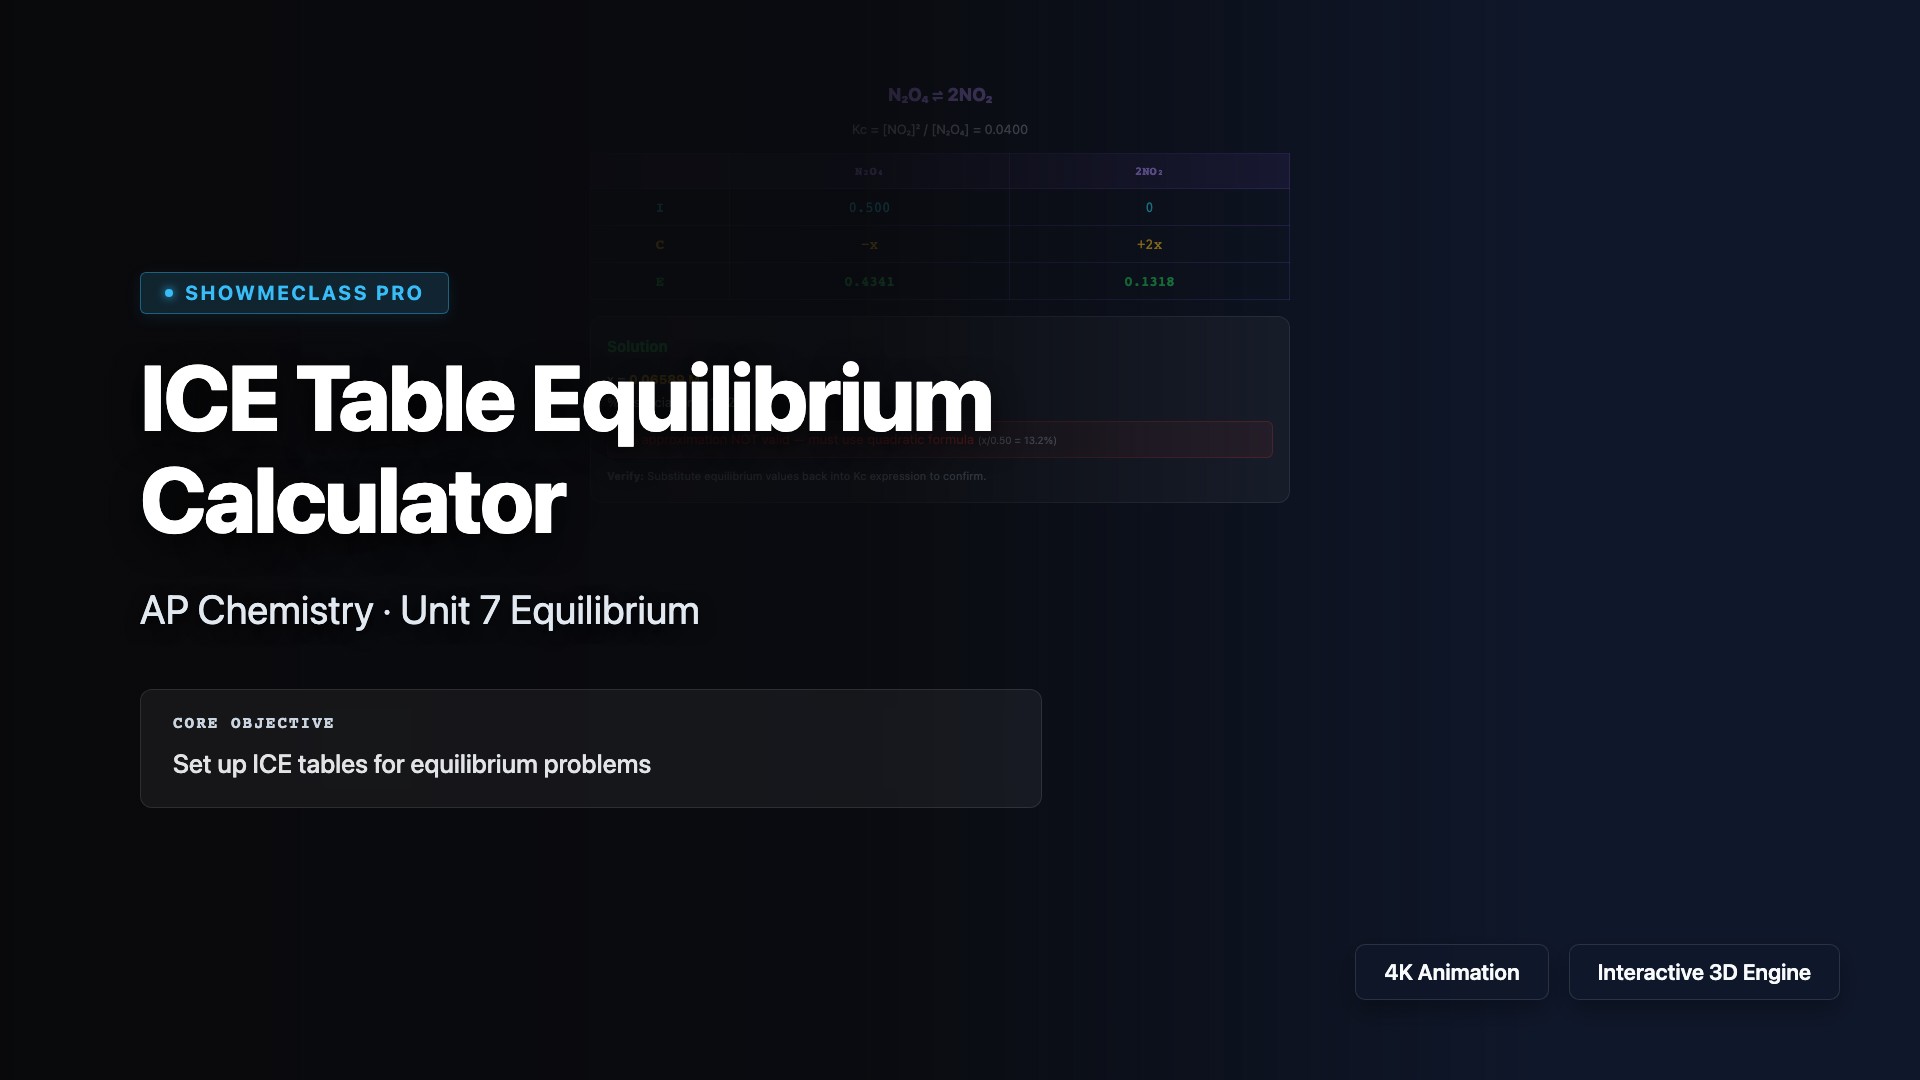
ICE Table Equilibrium Calculator
Step-by-step ICE table solver for 4 equilibrium reaction types (N₂O₄⇌2NO₂, H₂+I₂⇌2HI, PCl₅⇌PCl₃+Cl₂, CO+H₂O⇌CO₂+H₂). Adjustable Kc and initial concentration with automatic solving. Includes 5% approximation validity check and verification reminder.
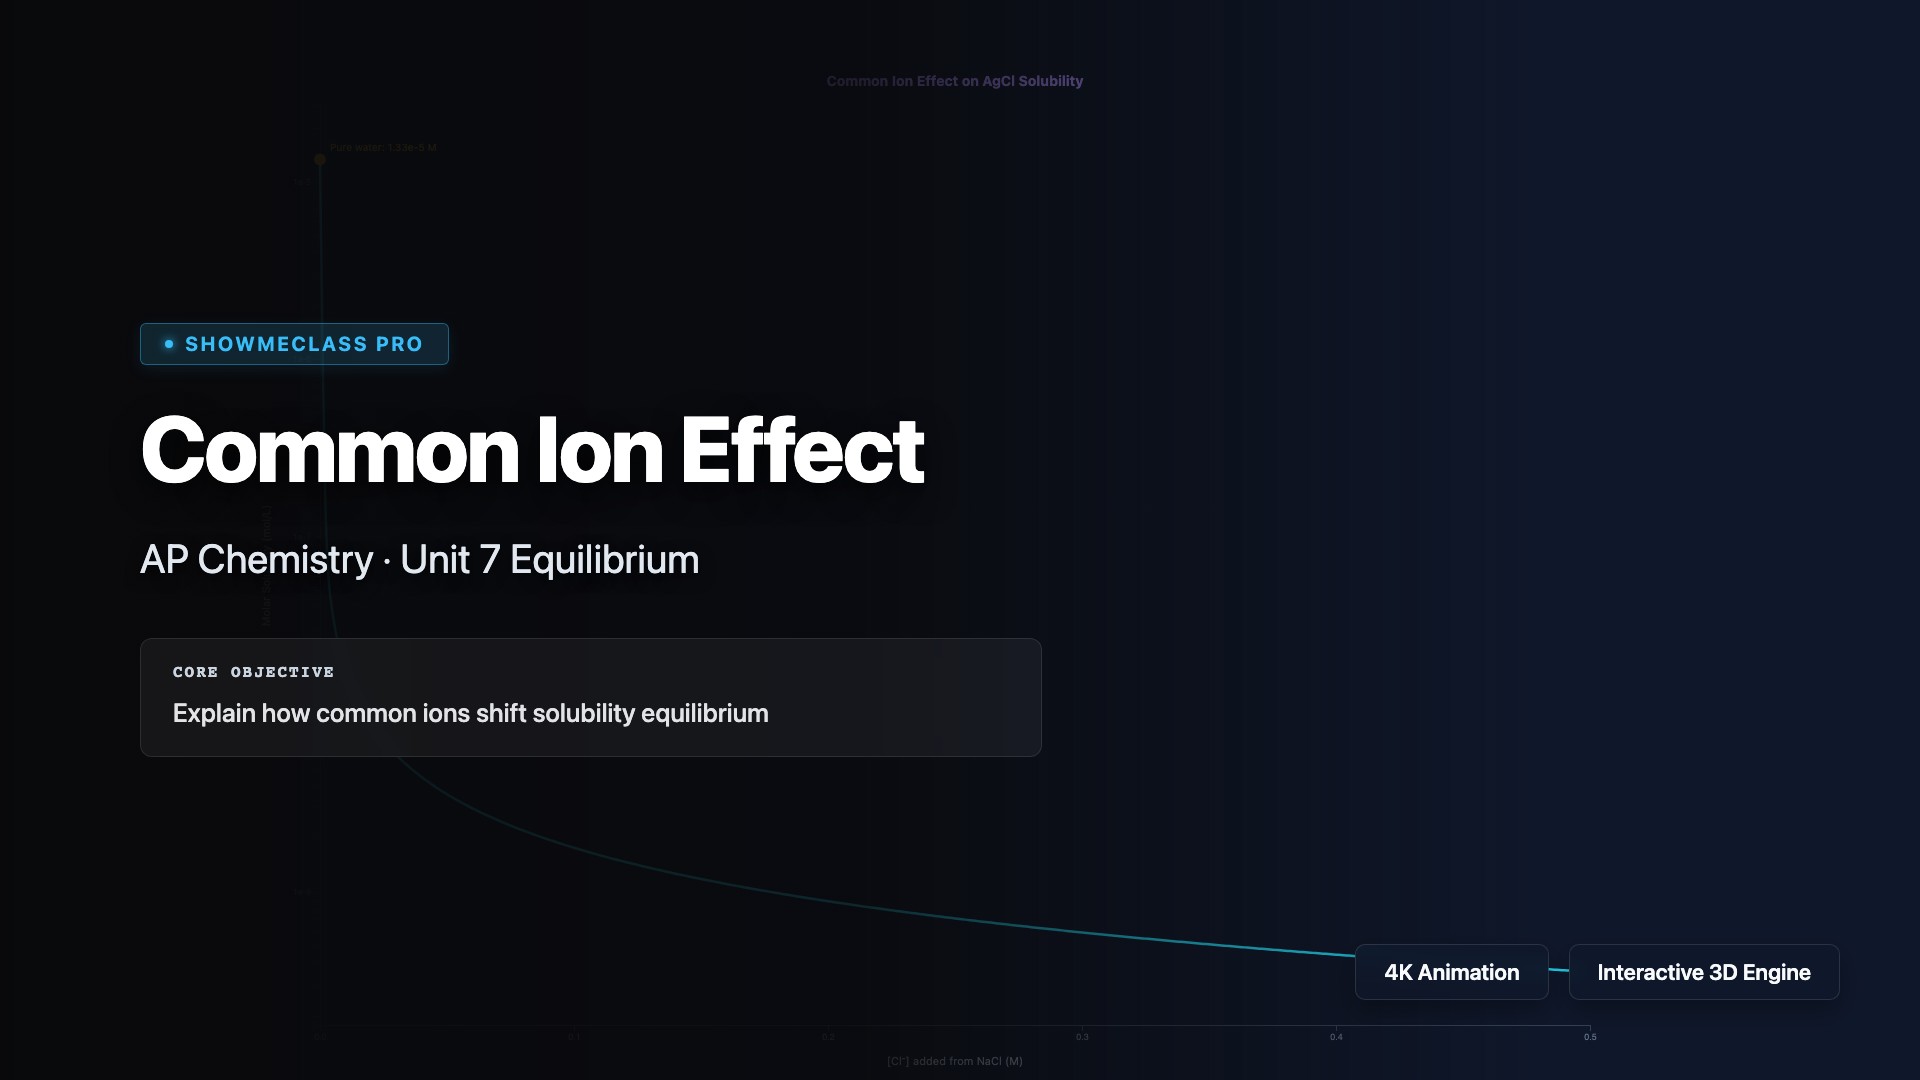
Common Ion Effect on Solubility
Interactive visualization of common ion effect on solubility for 4 salts (AgCl, PbCl₂, BaSO₄, CaF₂). Log-scale solubility vs common ion concentration graph with Le Chatelier's principle explanation. Shows dramatic solubility decrease with added common ion and percentage reduction calculation.
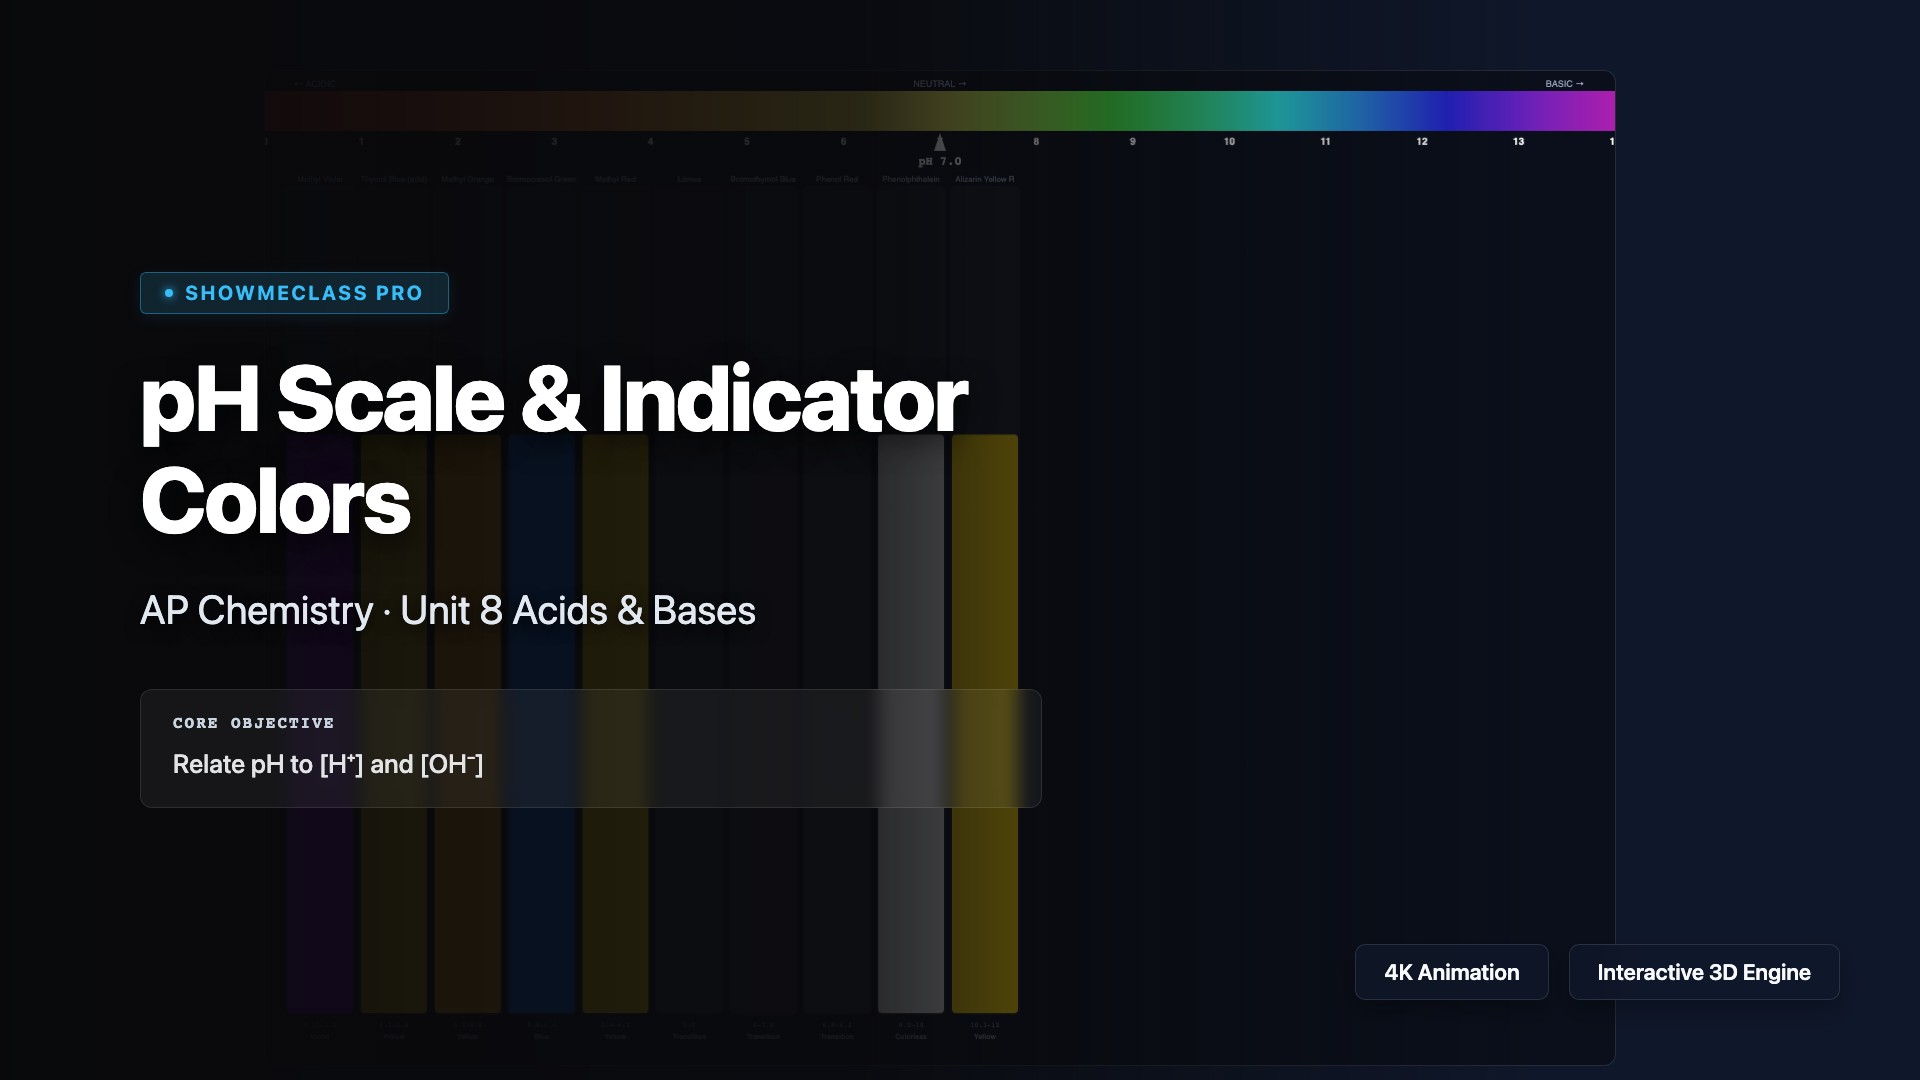
pH Scale & Indicator Color Simulator
Interactive pH scale with 10 common acid-base indicators displayed as color-changing test tubes. Slide pH from 0-14 to see real-time color transitions for methyl violet, thymol blue, methyl orange, bromocresol green, methyl red, litmus, bromothymol blue, phenol red, phenolphthalein, and alizarin yellow R. Calculates [H⁺], [OH⁻], and pOH.
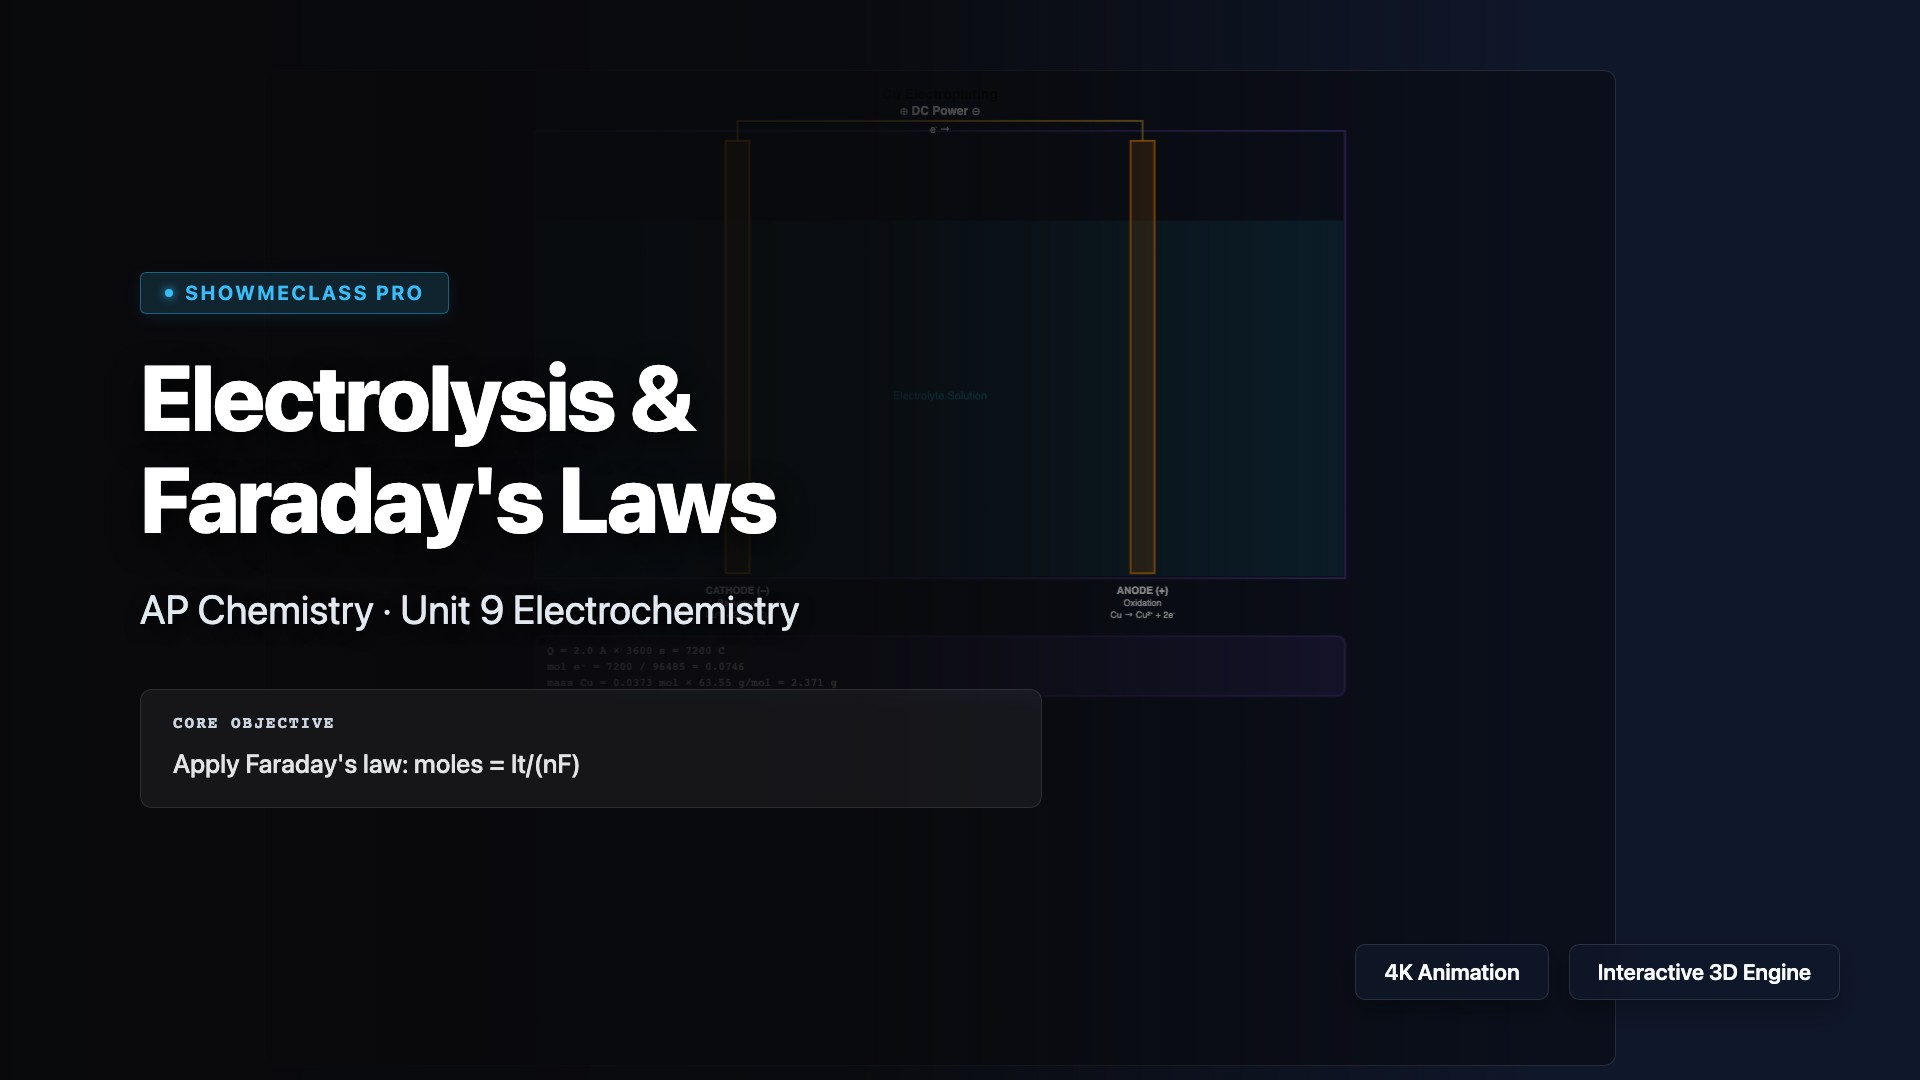
Electrolysis & Faraday's Laws
Interactive electrolysis cell simulator with Faraday's law calculations. Explore 4 electrolysis types (Cu plating, Ag plating, NaCl molten, Al smelting) with visual cell diagram showing cathode/anode reactions. Adjustable current and time with step-by-step Q→mol e⁻→mol product→mass calculation.
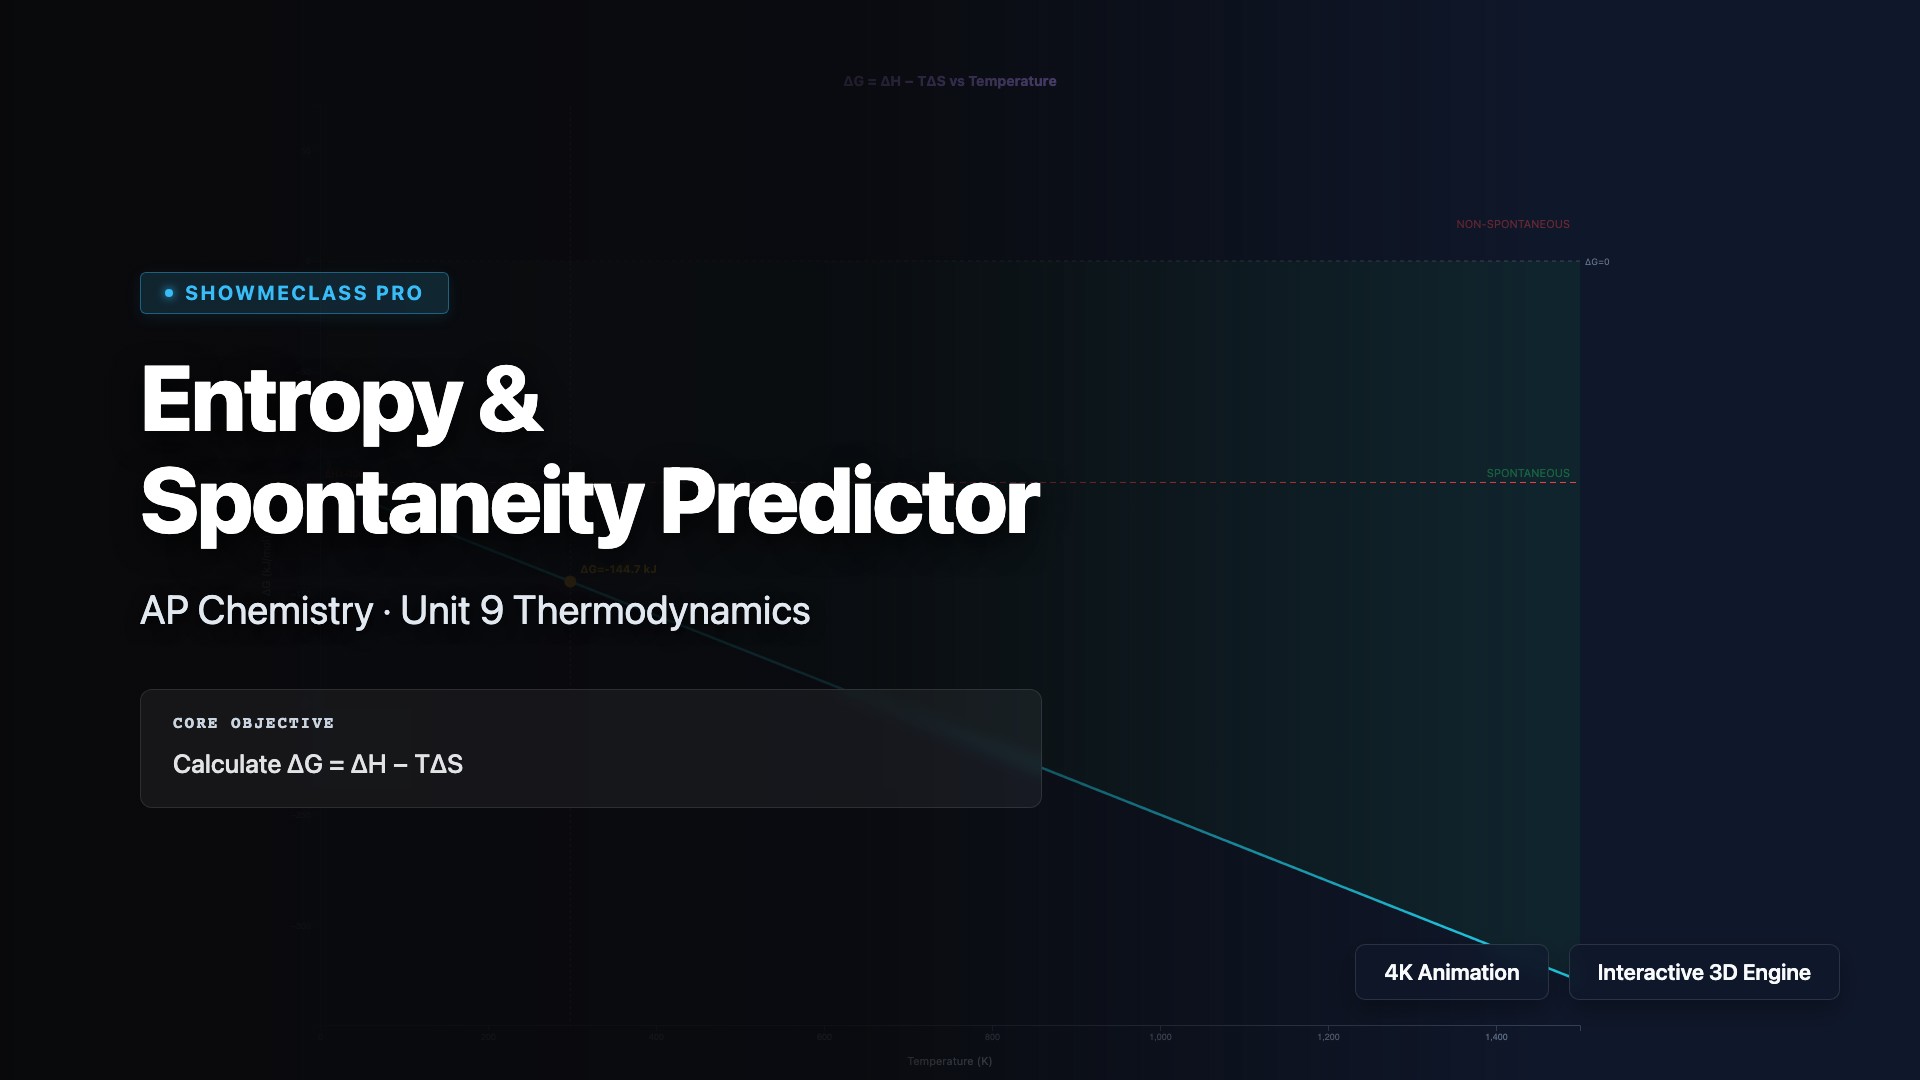
Entropy & Spontaneity Predictor
Interactive ΔG = ΔH − TΔS graph with adjustable enthalpy, entropy, and temperature. Visualizes Gibbs free energy vs temperature with spontaneous/non-spontaneous shading. Automatically determines crossover temperature and classifies into 4 ΔH/ΔS sign combinations with detailed explanations.
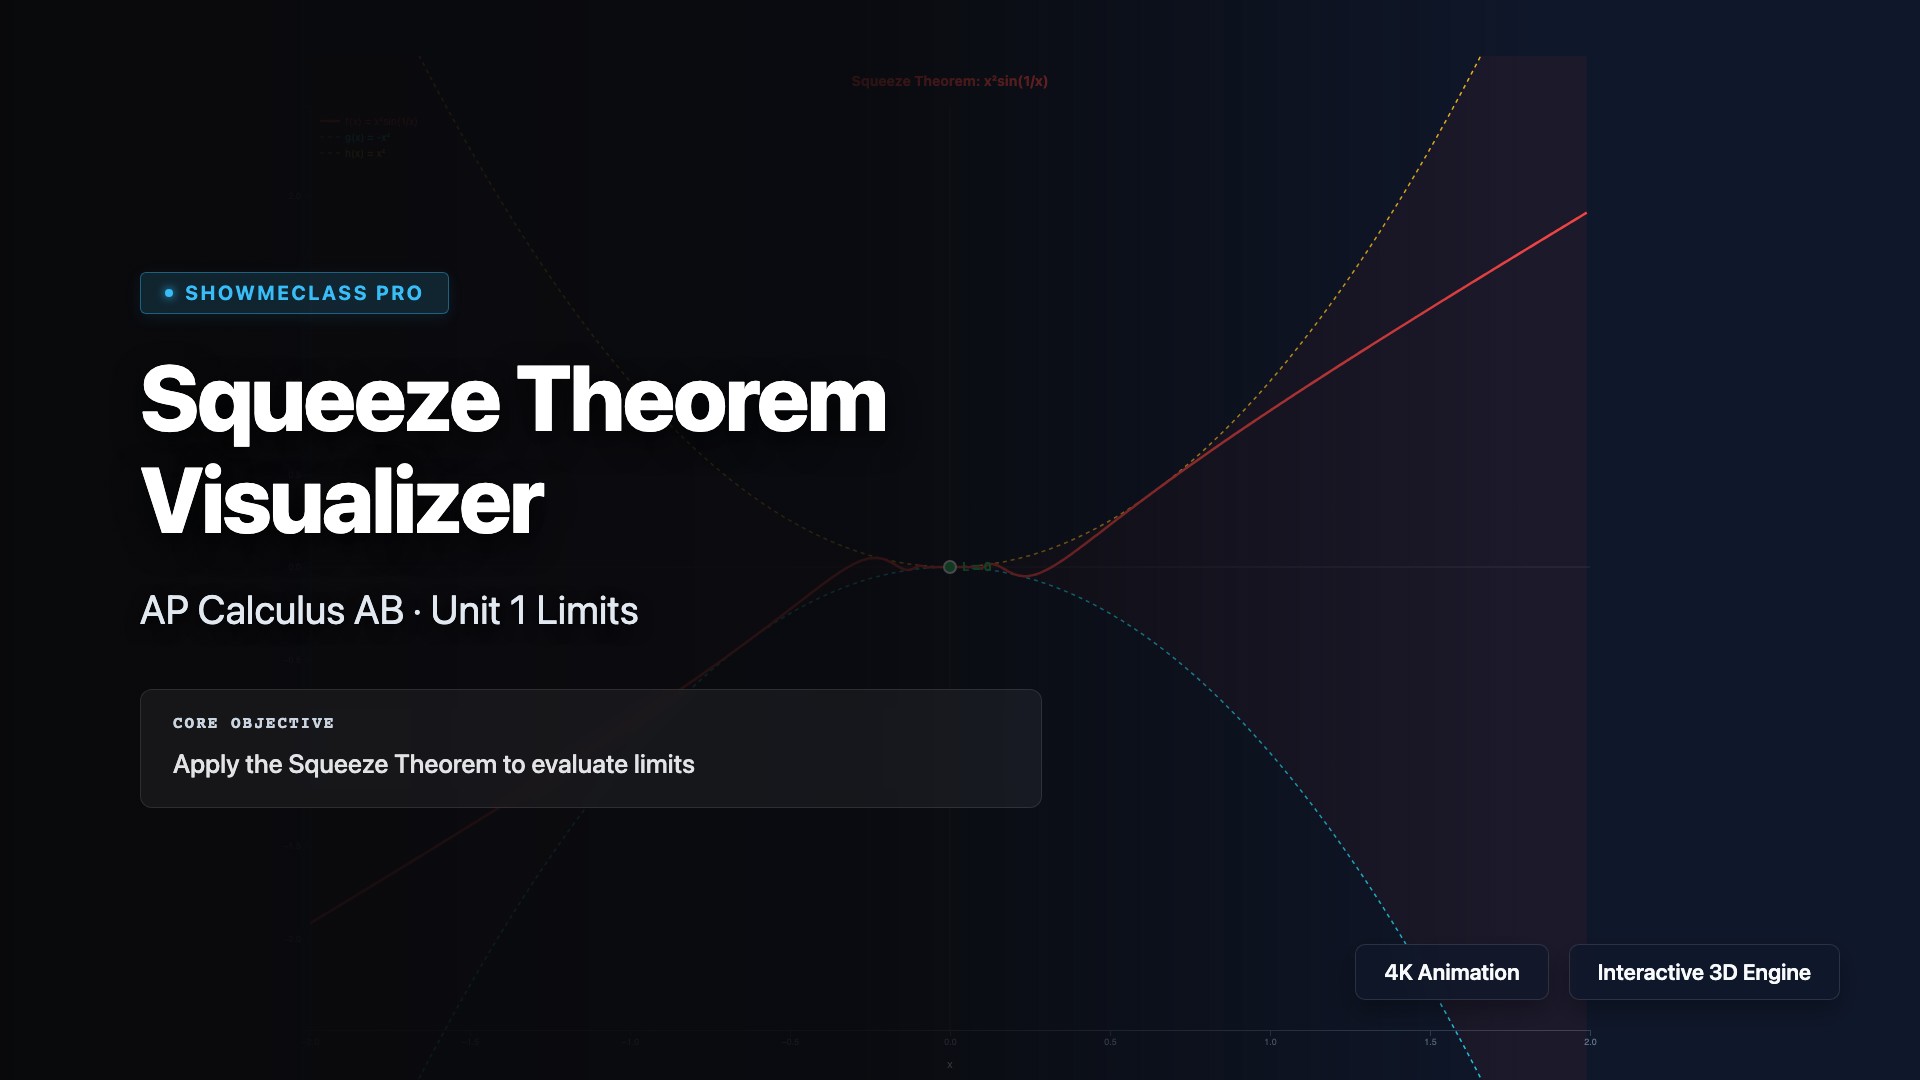
Squeeze Theorem Visualizer
Interactive visualization of the Squeeze Theorem with 4 classic examples (x²sin(1/x), sin(x)/x, x·cos(1/x), (1−cos x)/x²). Shows bounding functions g(x) ≤ f(x) ≤ h(x) with shaded squeeze region. Adjustable zoom and convergence to limit point.
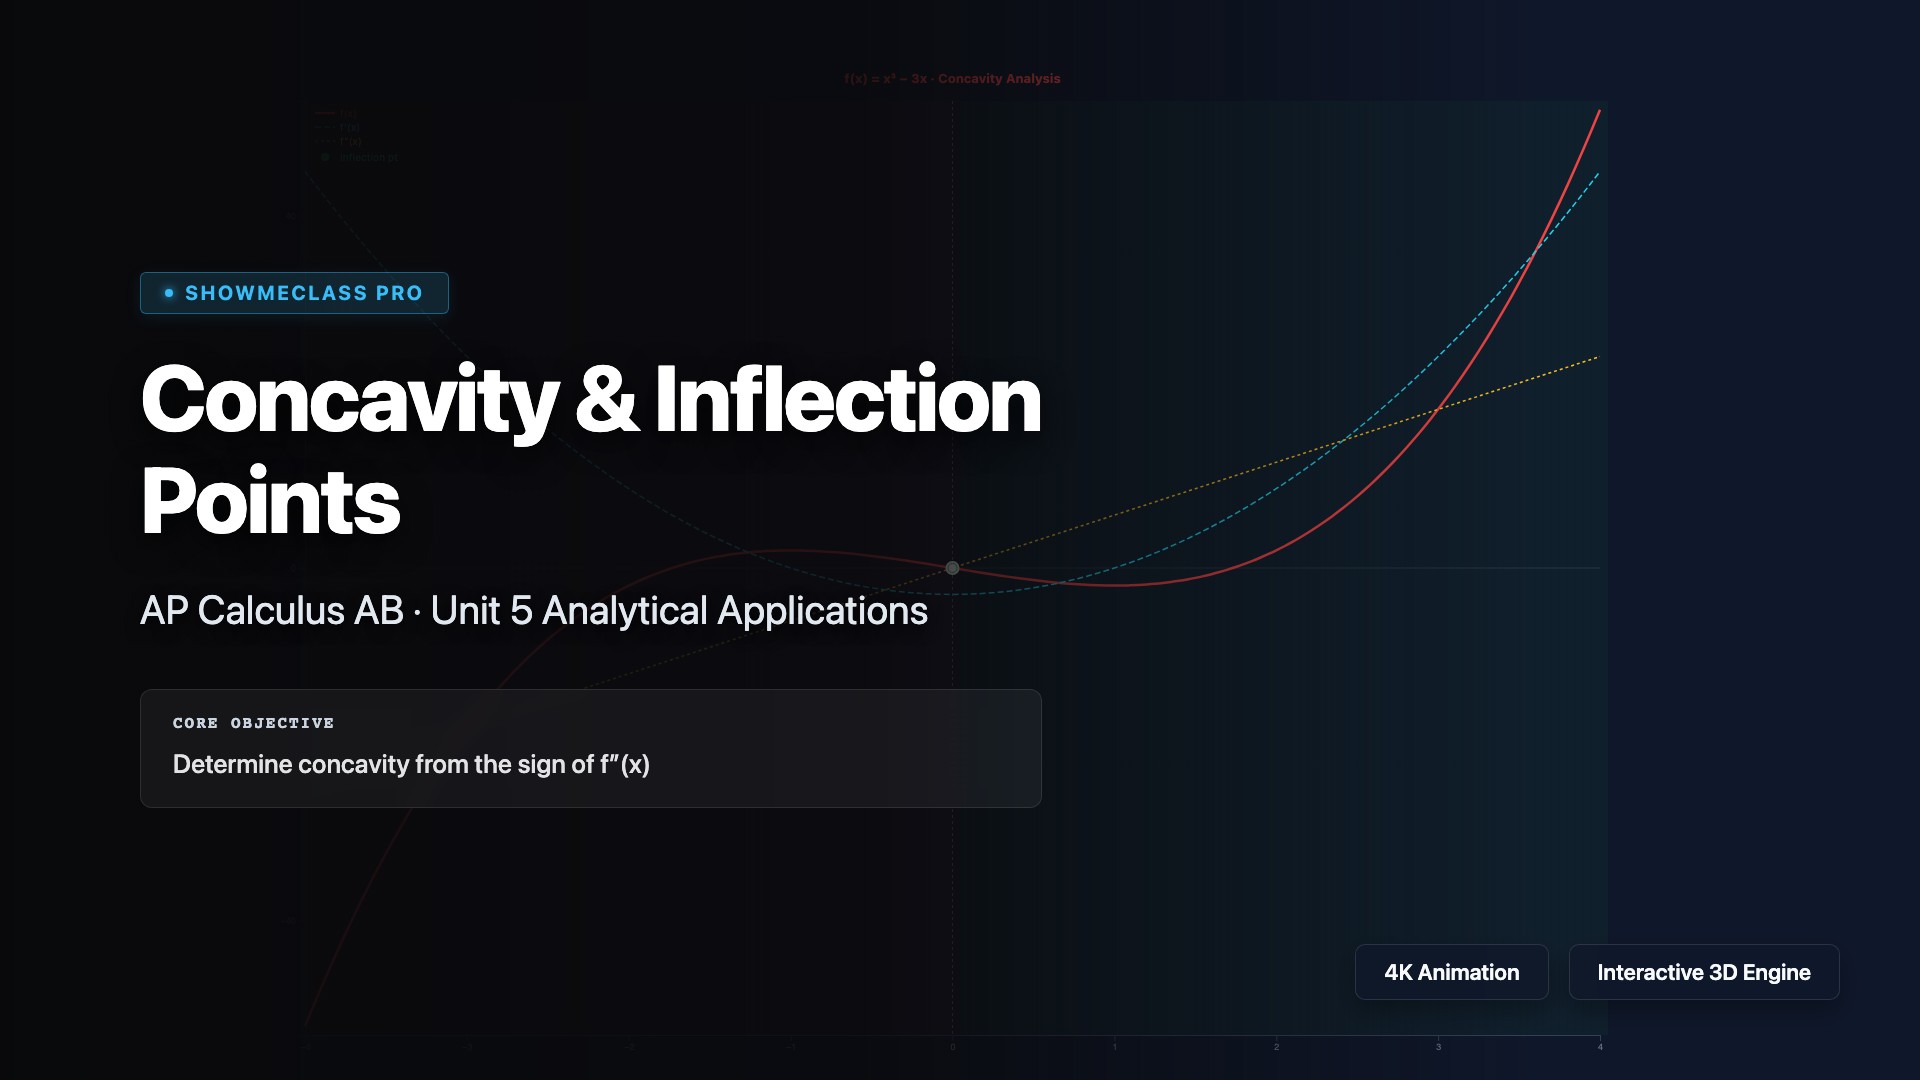
Concavity & Inflection Points
Interactive concavity analysis showing f(x), f′(x), and f″(x) simultaneously for 4 functions. Concavity shading (green=up, red=down), inflection point markers, and movable cursor with real-time derivative values and concavity classification.
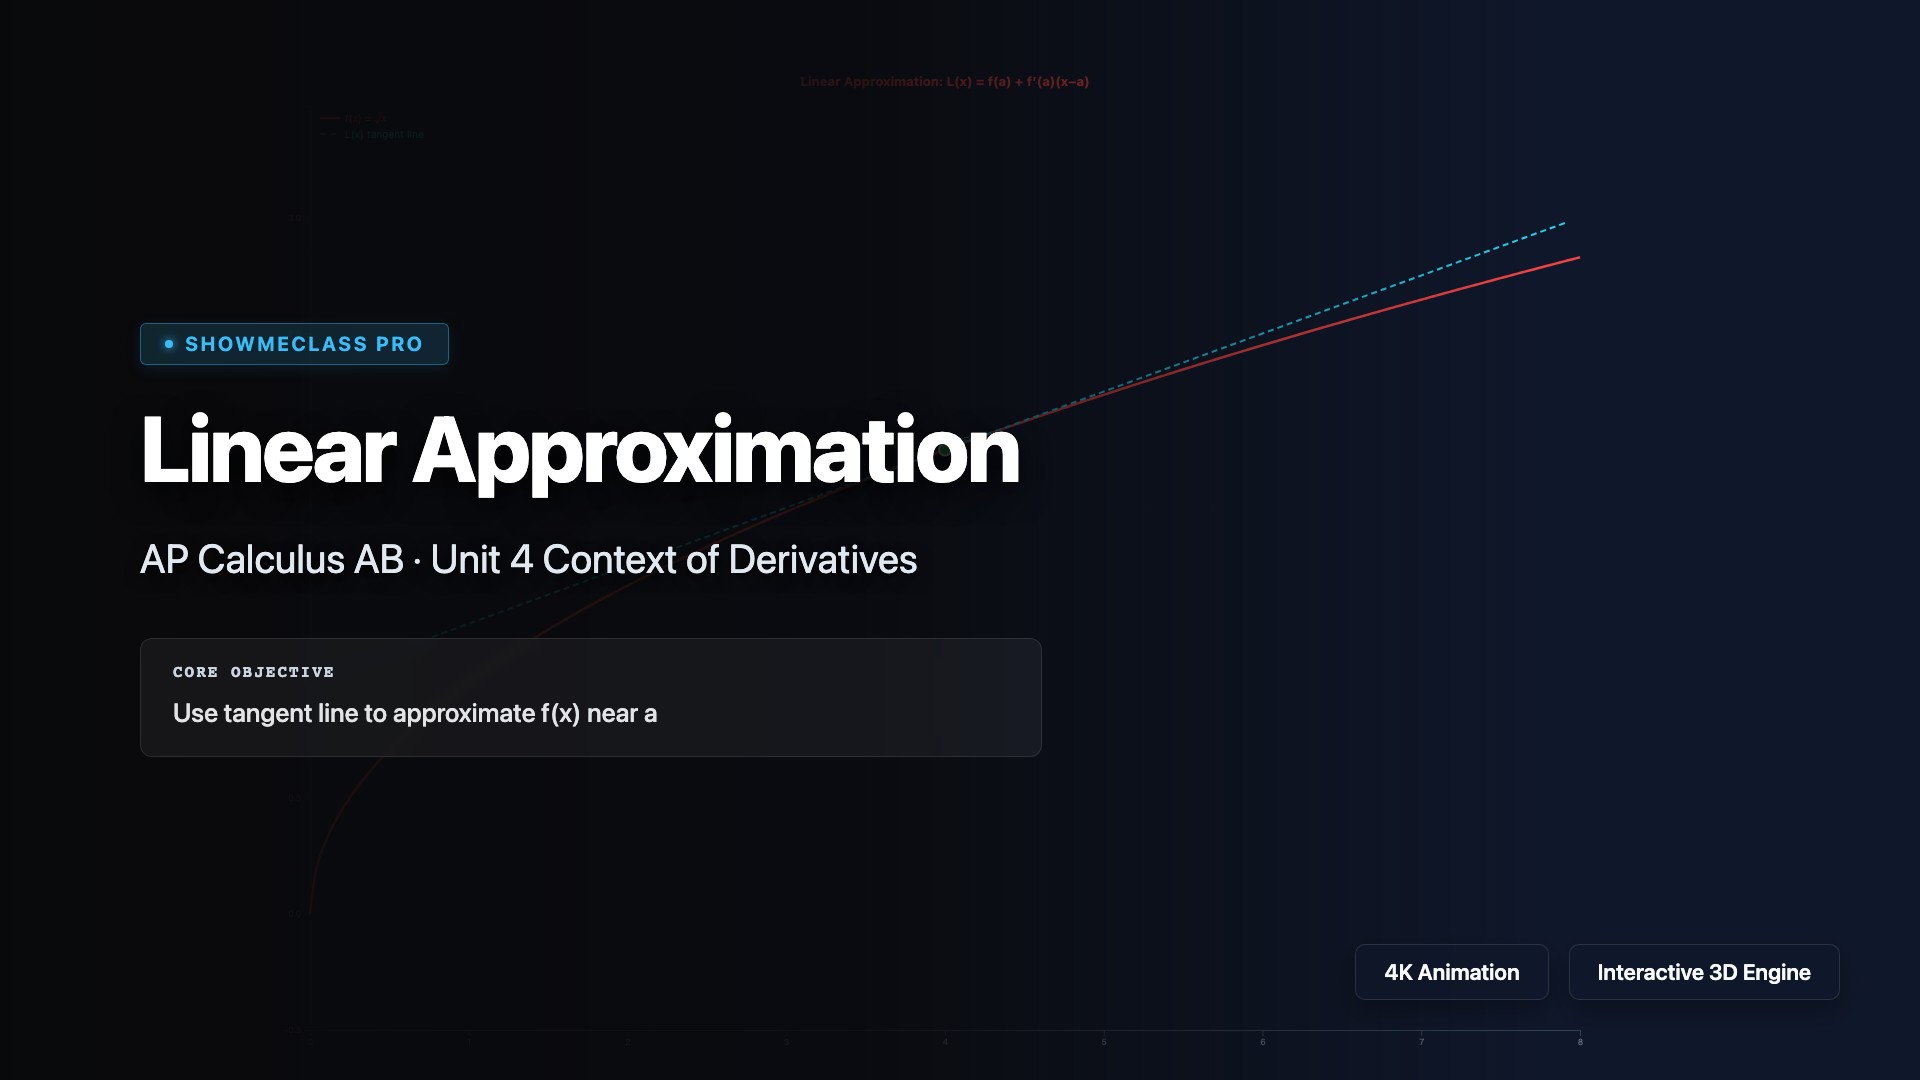
Linear Approximation & Differentials
Interactive linearization visualizer for 5 functions (√x, sin(x), eˣ, ln(x), 1/(1+x)). Shows tangent line L(x) = f(a) + f′(a)(x−a) overlaid on actual curve. Movable x-cursor with real-time exact vs approximate values, absolute and percentage error calculation.
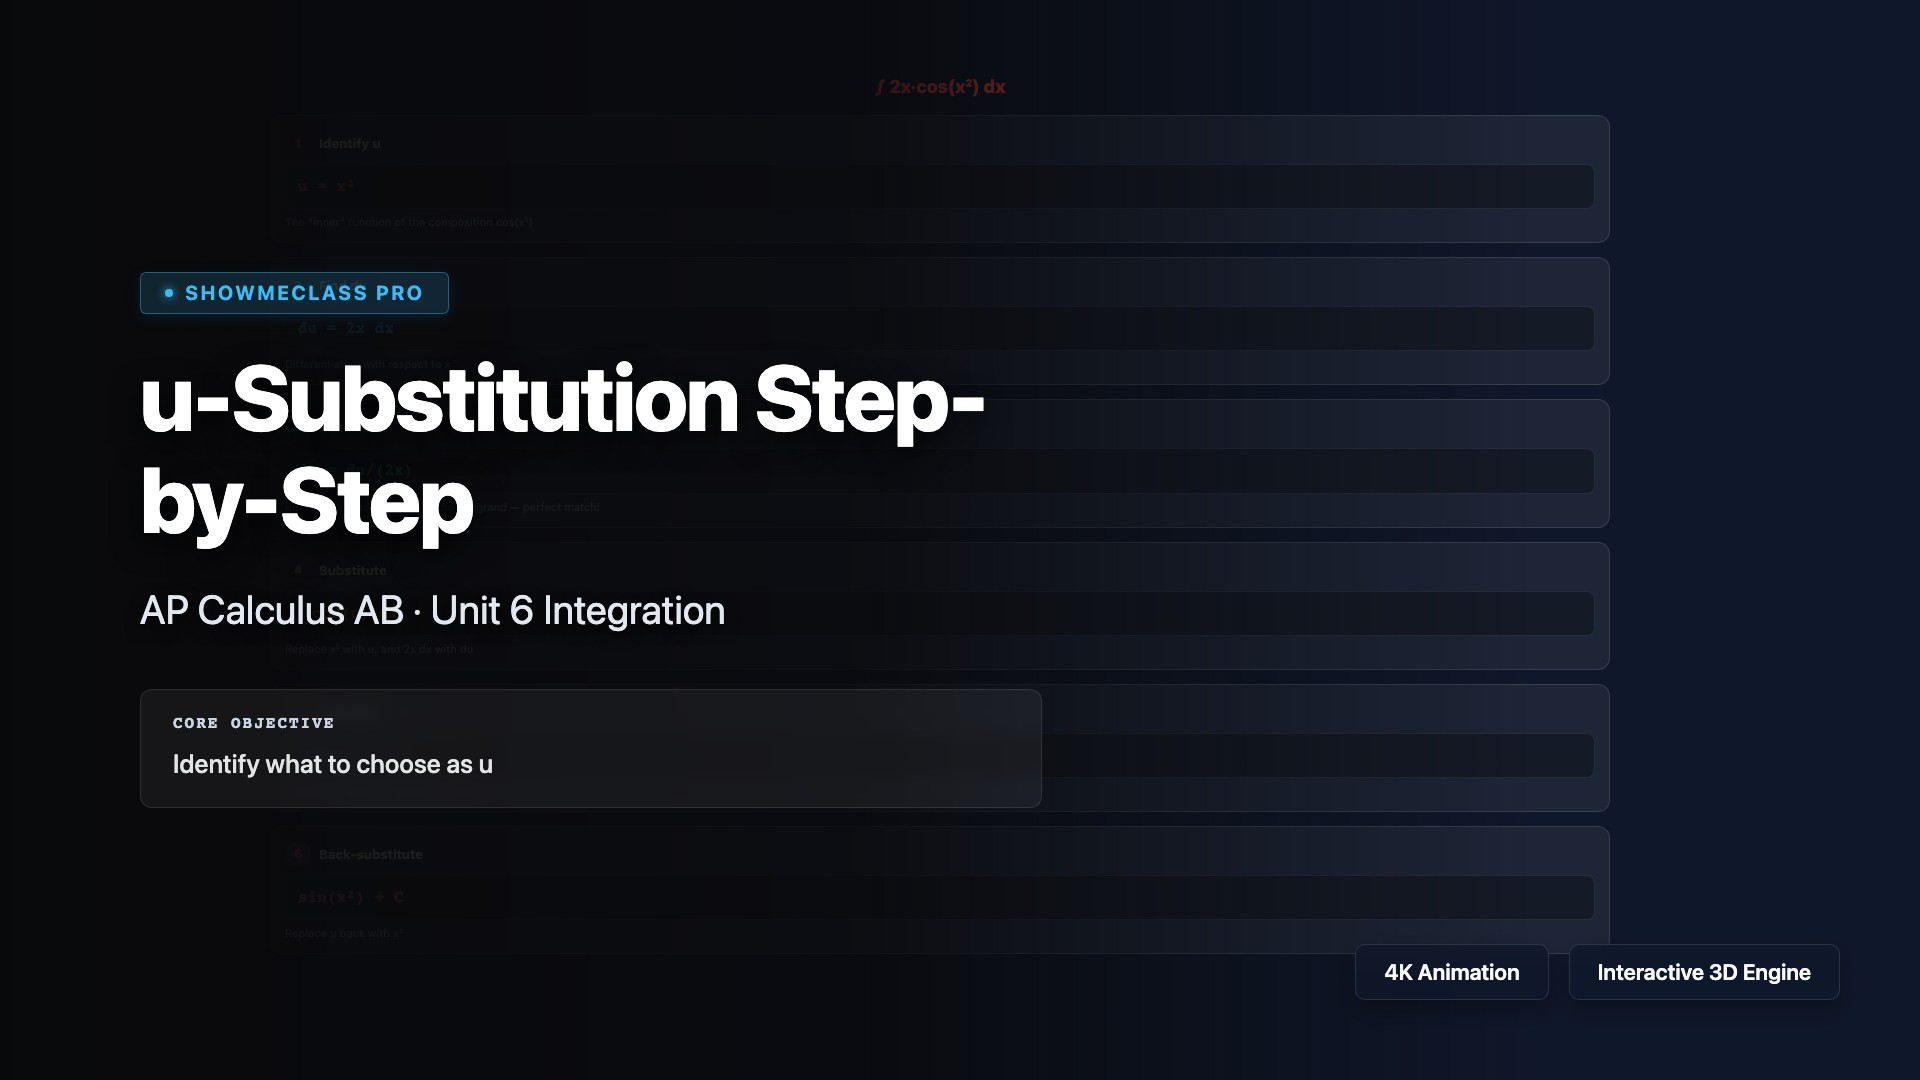
u-Substitution Step-by-Step
Step-by-step walkthrough of u-substitution for 6 integral examples. Color-coded steps: identify u, find du, match dx, substitute, integrate, back-substitute. Covers standard patterns including definite integrals with bound conversion.