
Showing 12 results
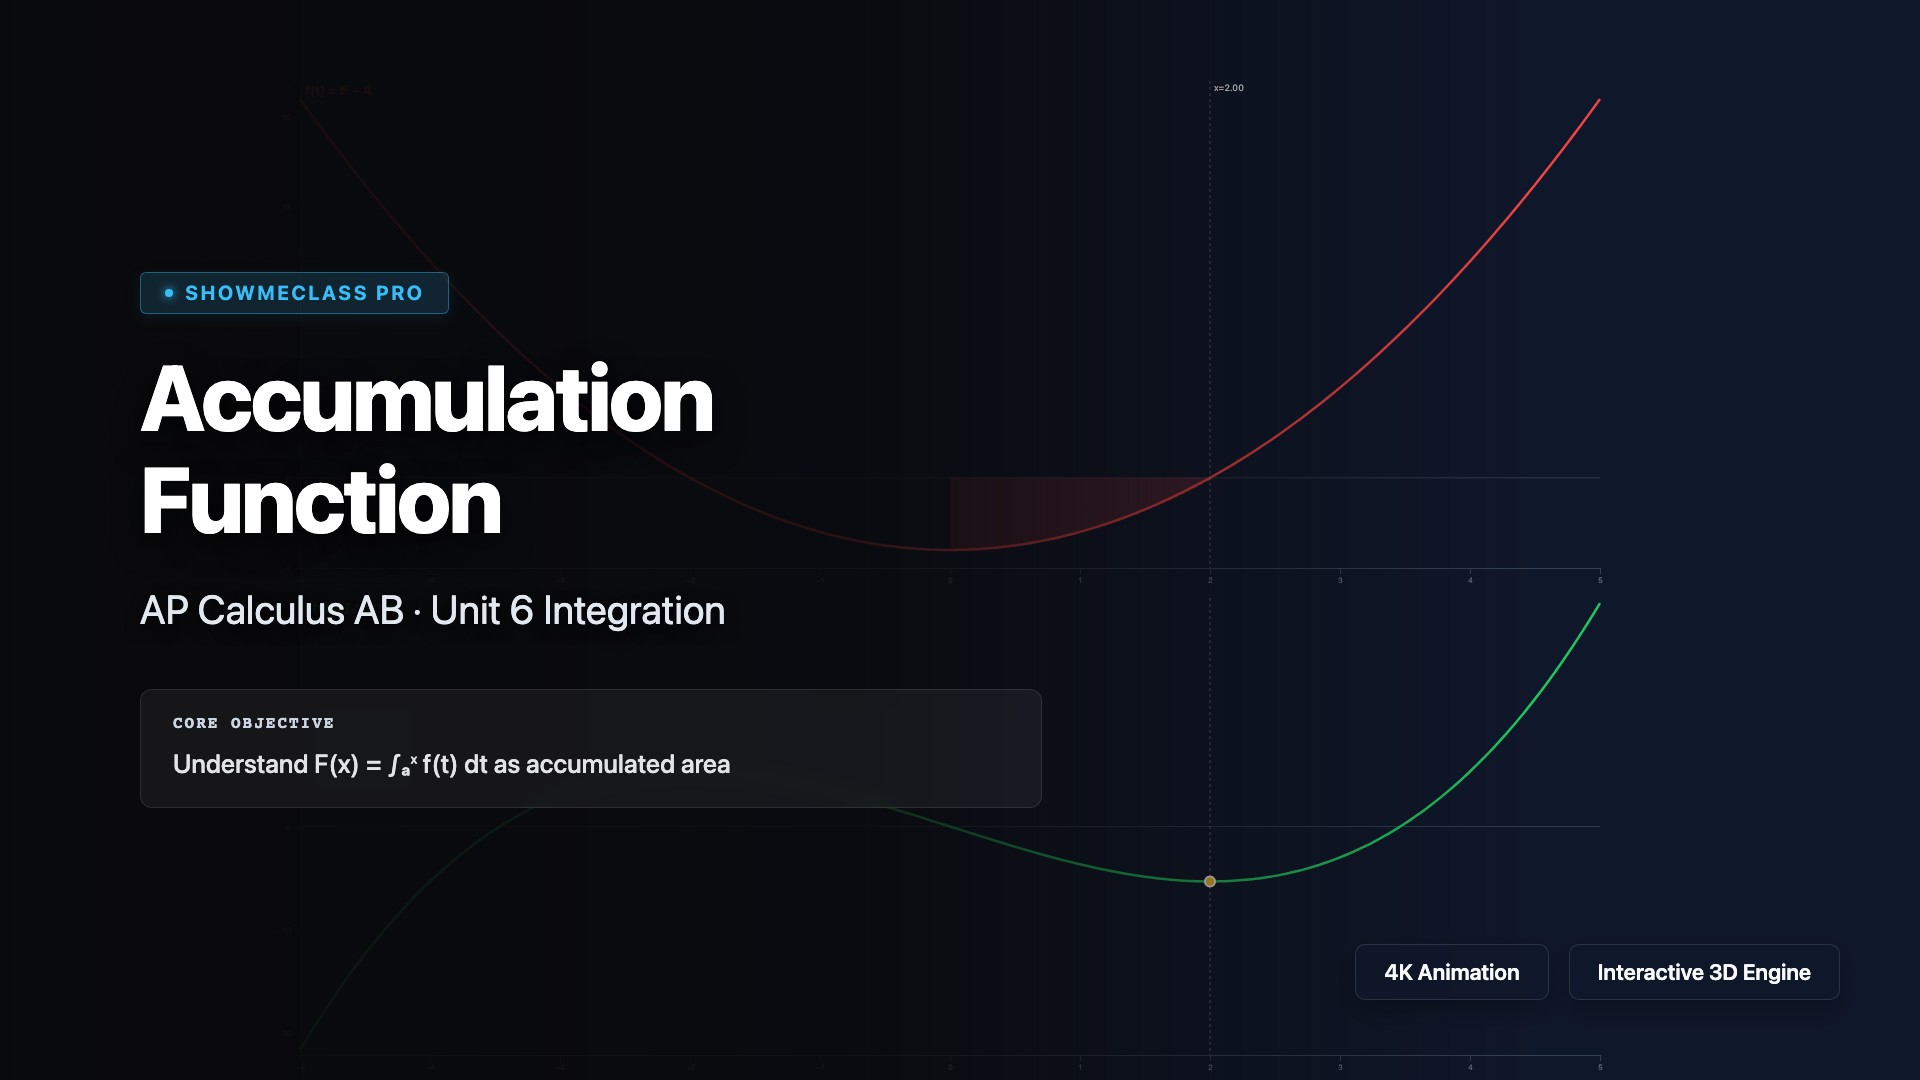
Accumulation Function Visualizer
Dual-panel visualization of f(t) and F(x) = ∫ₐˣ f(t) dt. Shows signed area shading (green positive, red negative) on the integrand graph alongside the accumulation function. Demonstrates FTC Part 1: F′(x) = f(x). Adjustable upper limit x with 4 function examples.
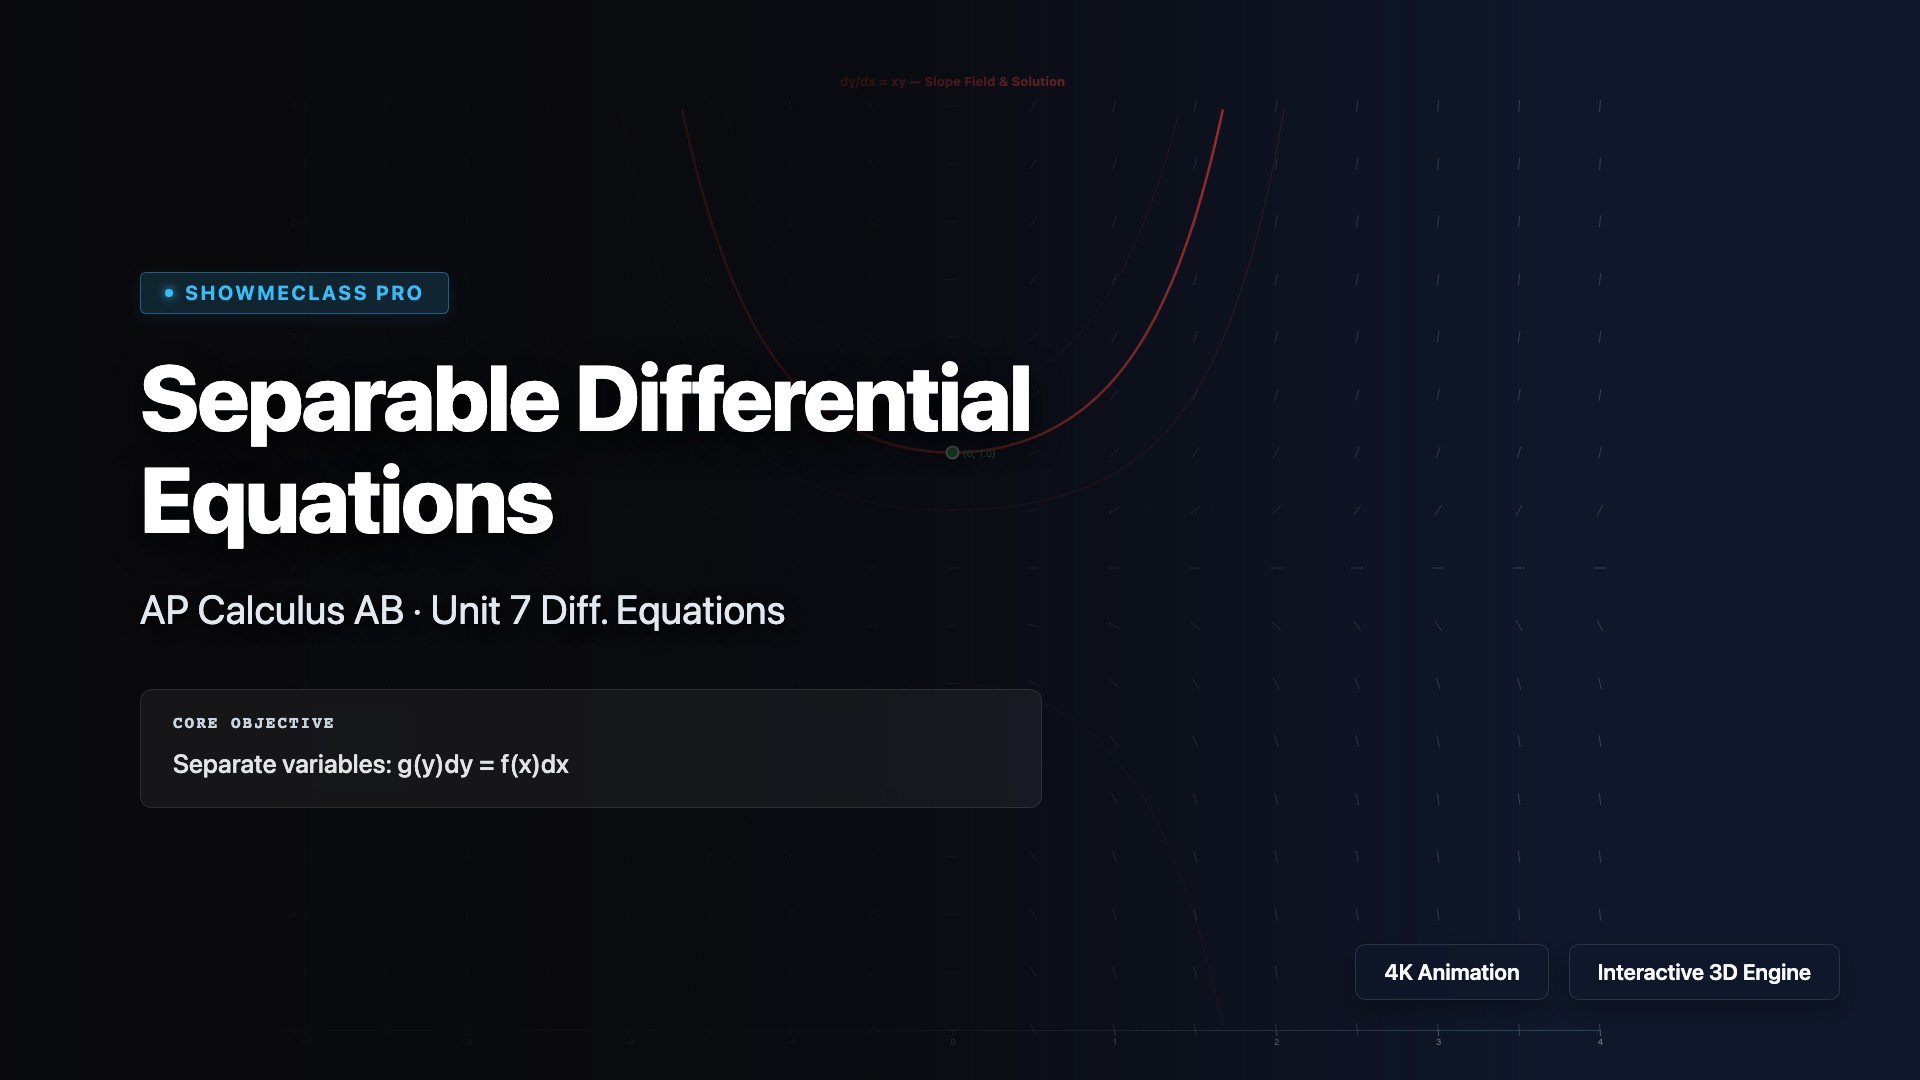
Separable Differential Equations
Slope field visualization with Euler method solution curves for 4 classic separable ODEs (dy/dx=xy, −y/x, y(1−y) logistic, x/y). Adjustable initial condition y₀ with multiple solution curves. Step-by-step separation and integration displayed.
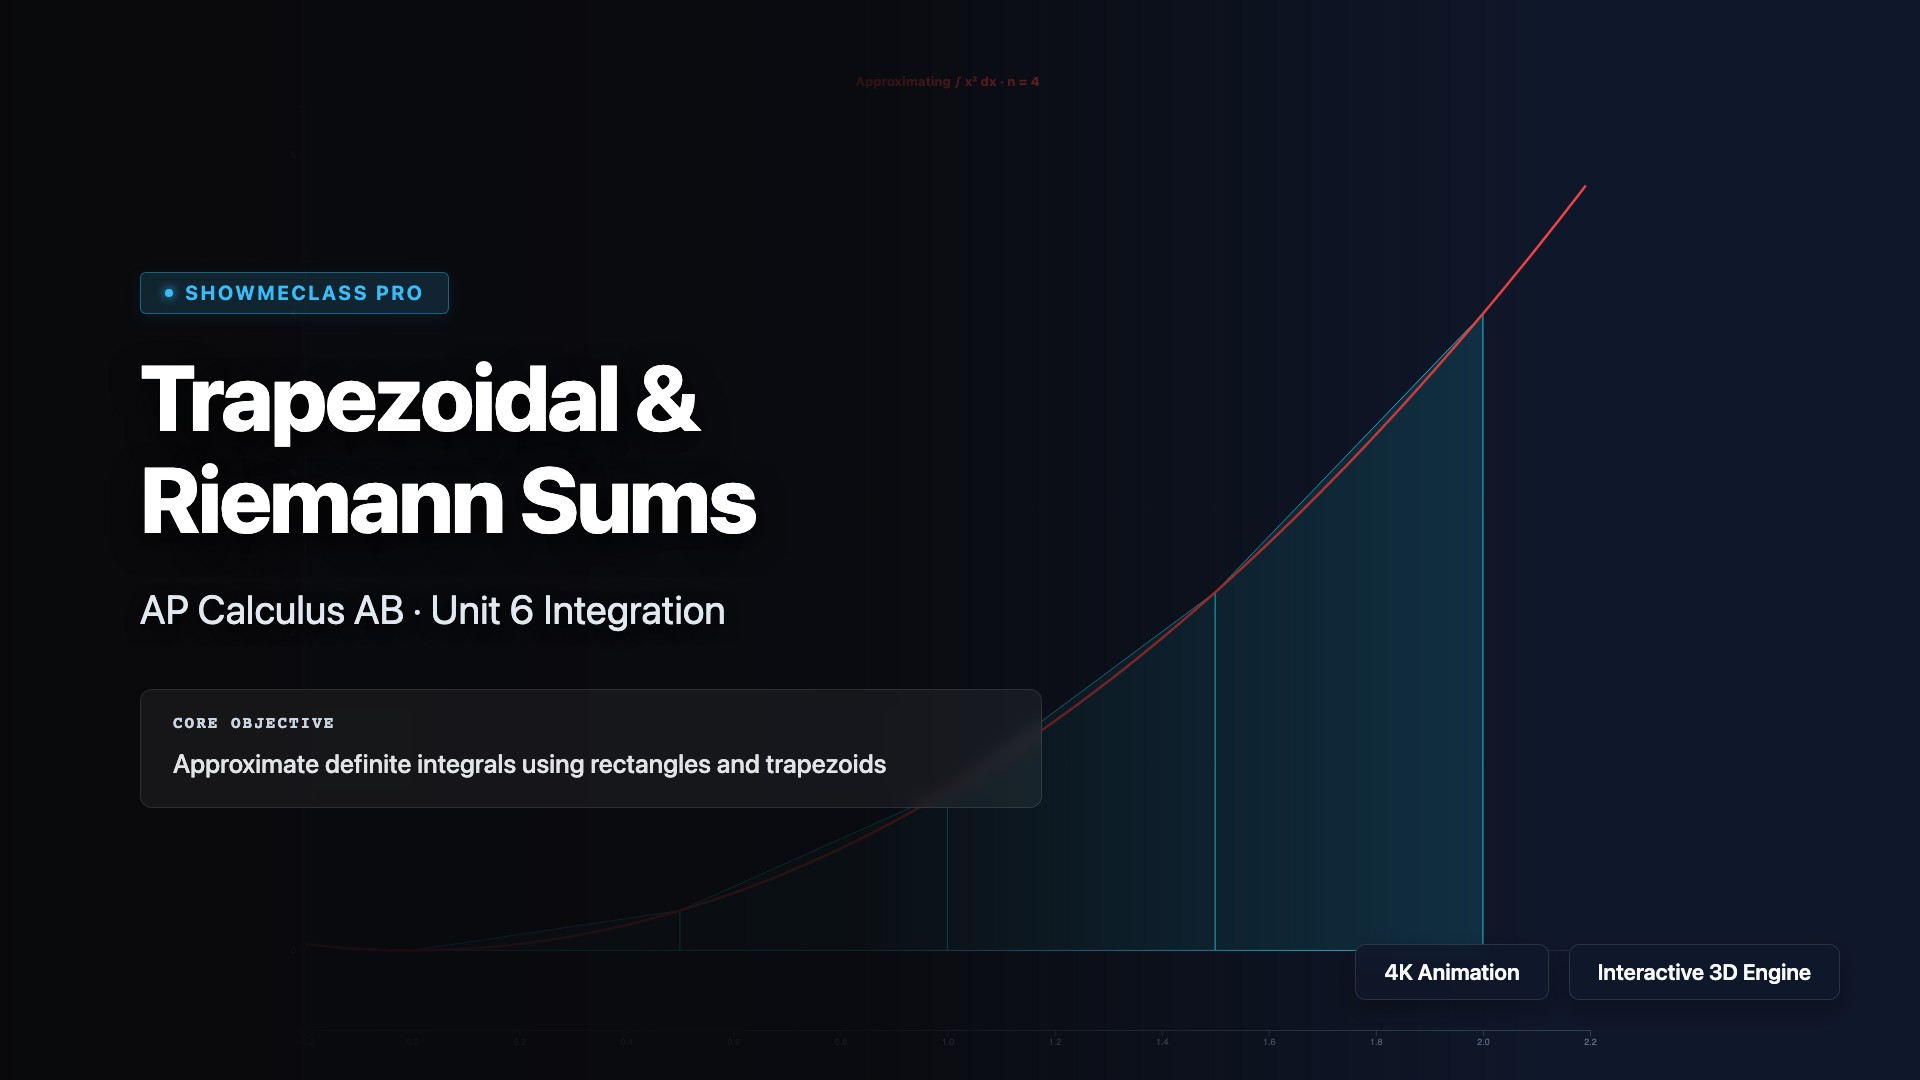
Trapezoidal & Riemann Sum Approximation
Interactive numerical integration comparing Left, Right, Midpoint, and Trapezoidal rules. 4 functions with adjustable number of subintervals (n=1 to 50). Shows exact value, approximation, absolute and percentage error. Visualizes rectangles/trapezoids overlaid on curve.
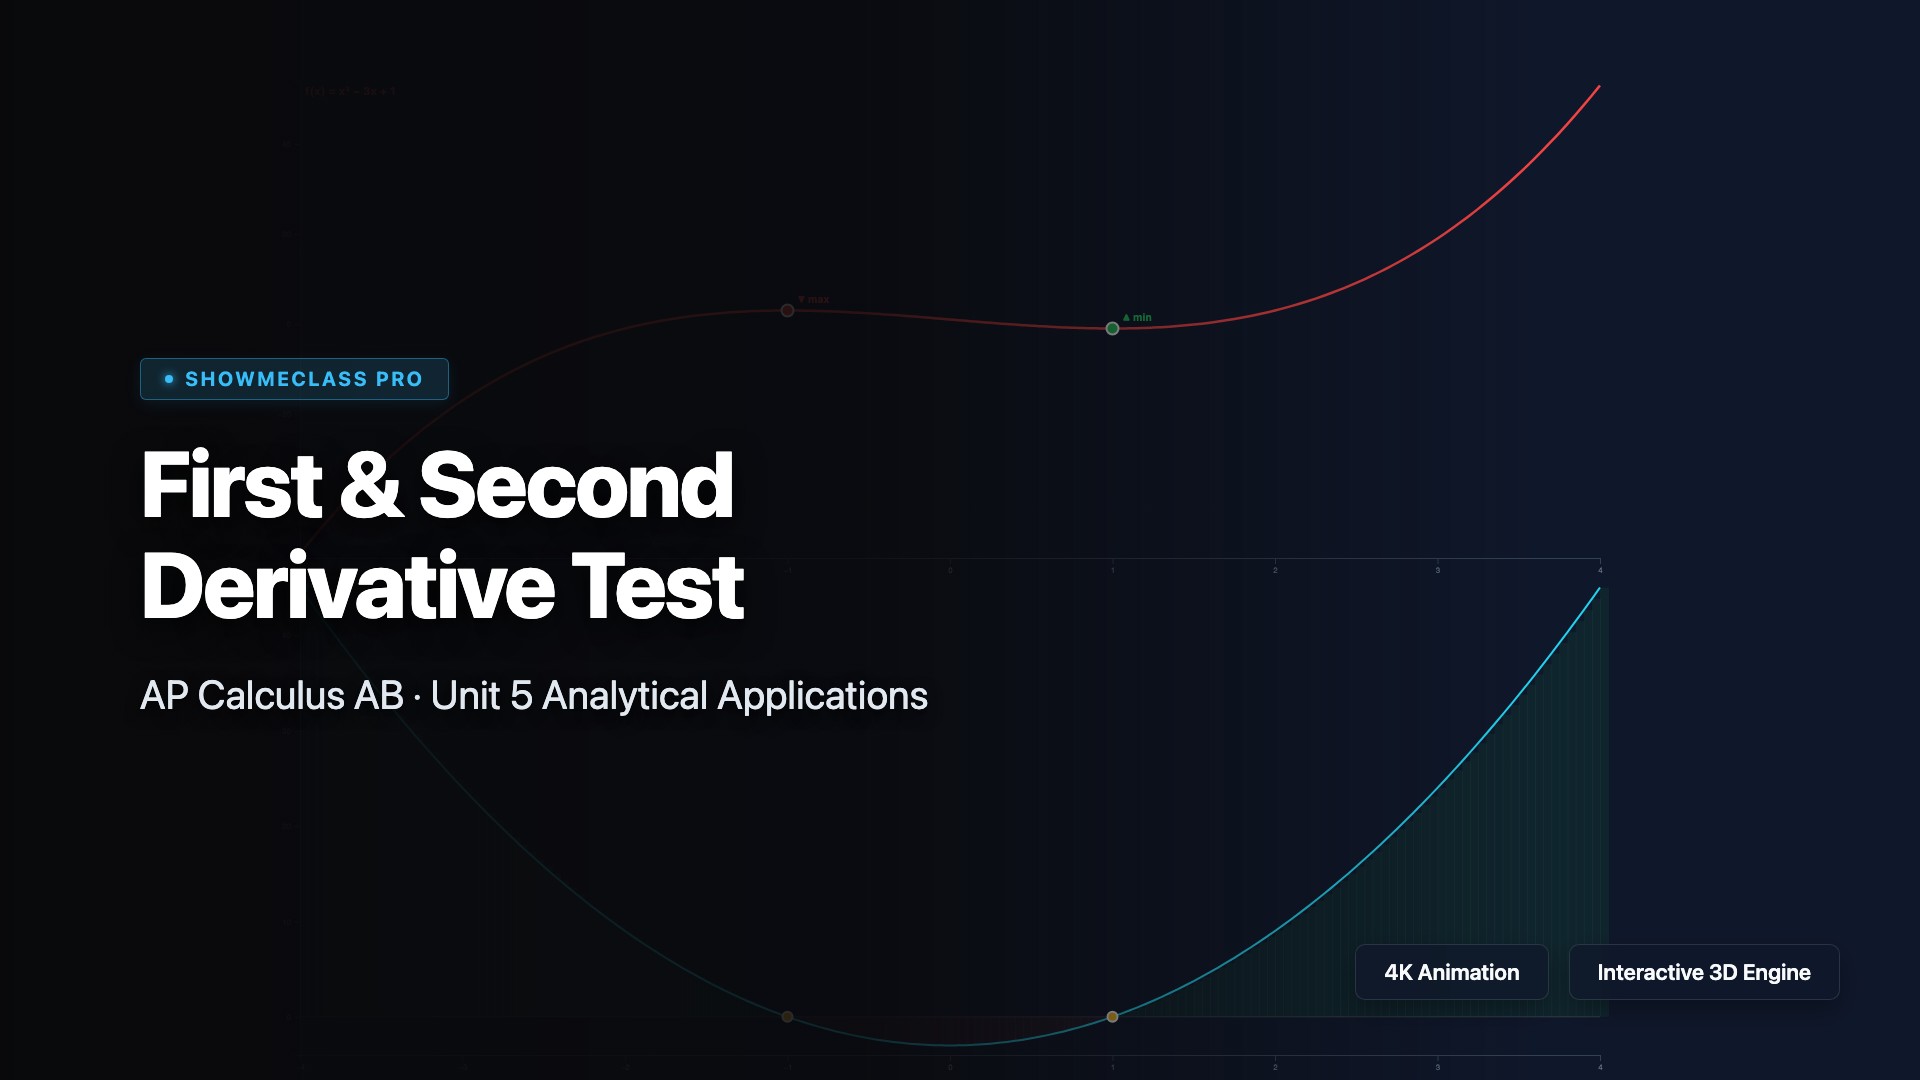
First & Second Derivative Test
Dual-panel display of f(x) and f′(x) for 4 polynomial/exponential functions. Critical points marked with max/min labels, f′ sign shading (green=increasing, red=decreasing). Second derivative test verification at each critical point. Interactive function selection.
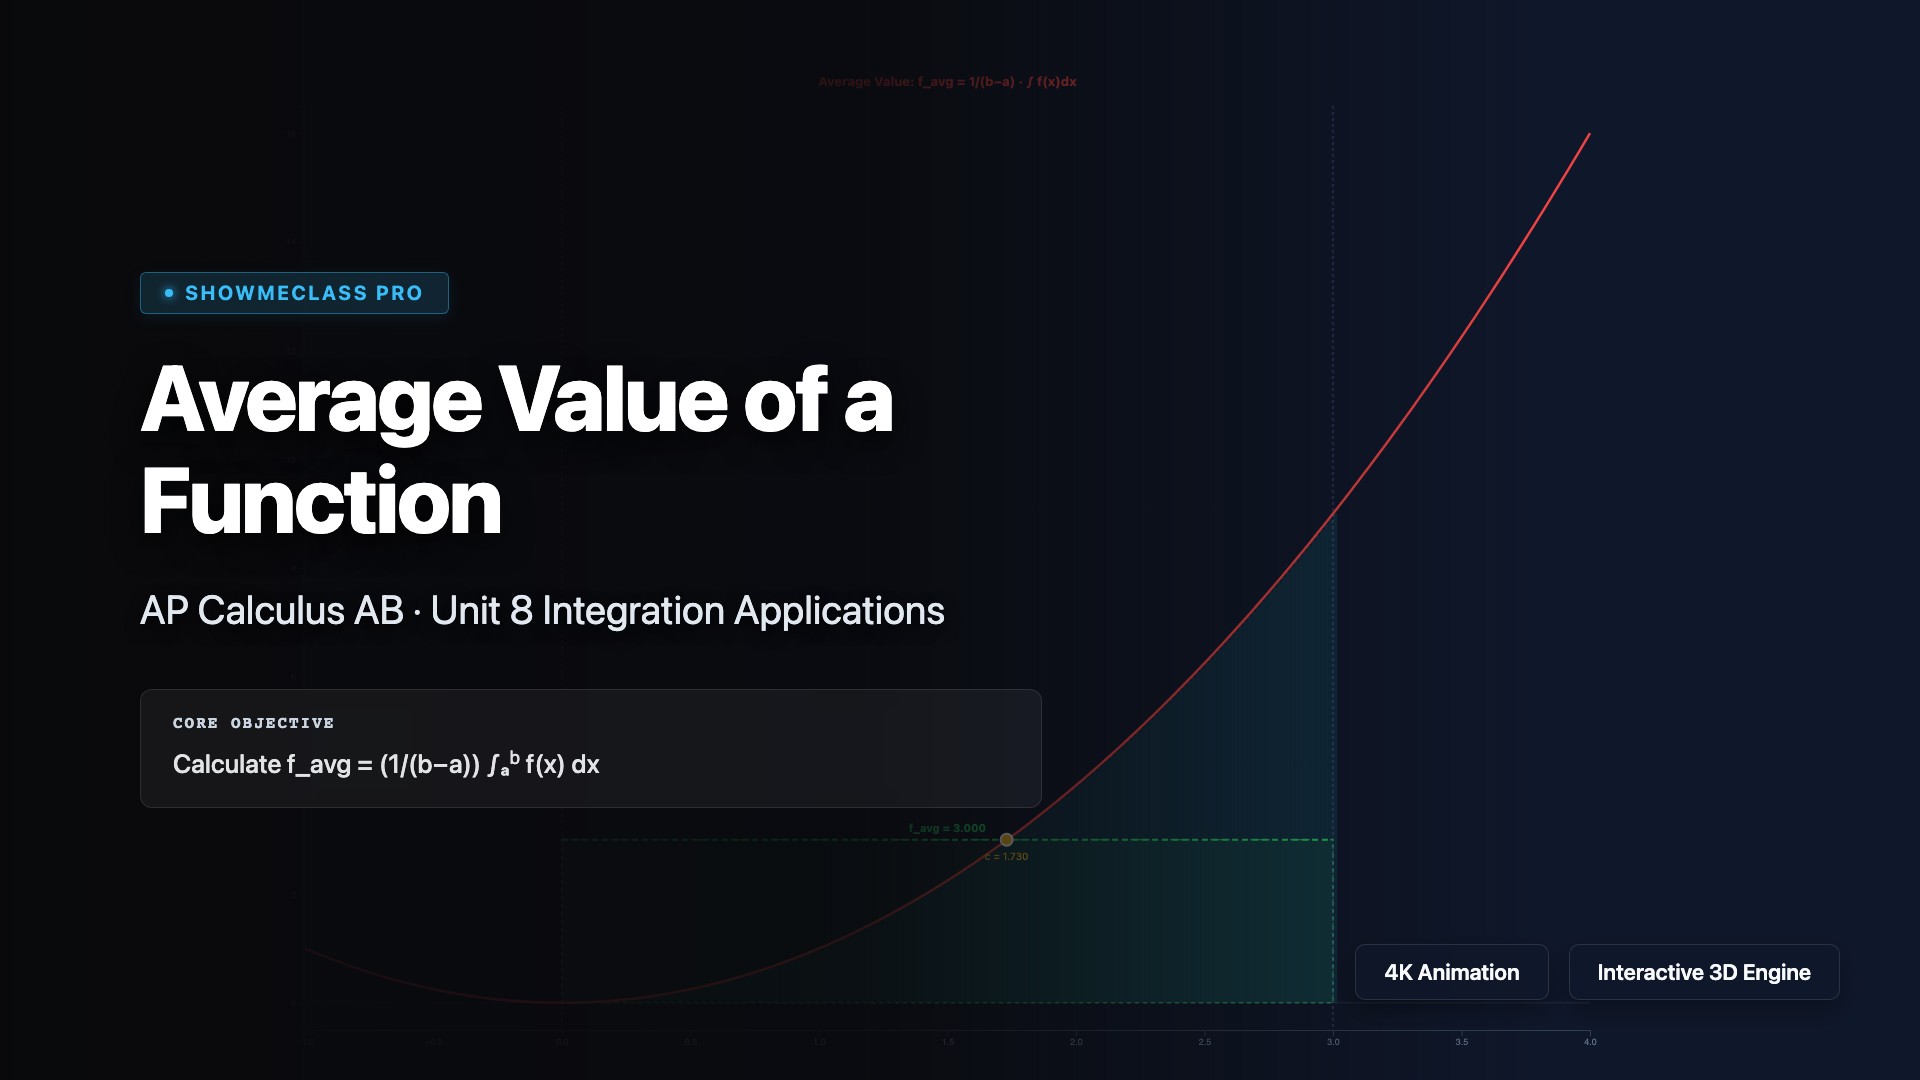
Average Value of a Function
Interactive average value calculator showing f_avg = 1/(b−a)·∫f(x)dx with equal-area rectangle visualization. Green dashed line at f_avg height creates a rectangle with the same area as the integral. Finds MVT for Integrals c-value. Adjustable bounds a and b.
Parametric Speed & Arc Length
Interactive parametric curve visualizer showing position, velocity vector, instantaneous speed |v(t)|, and arc length via Simpson integration. Animate particles along Cycloid, Ellipse, Lissajous, and Butterfly curves with real-time distance accumulation.
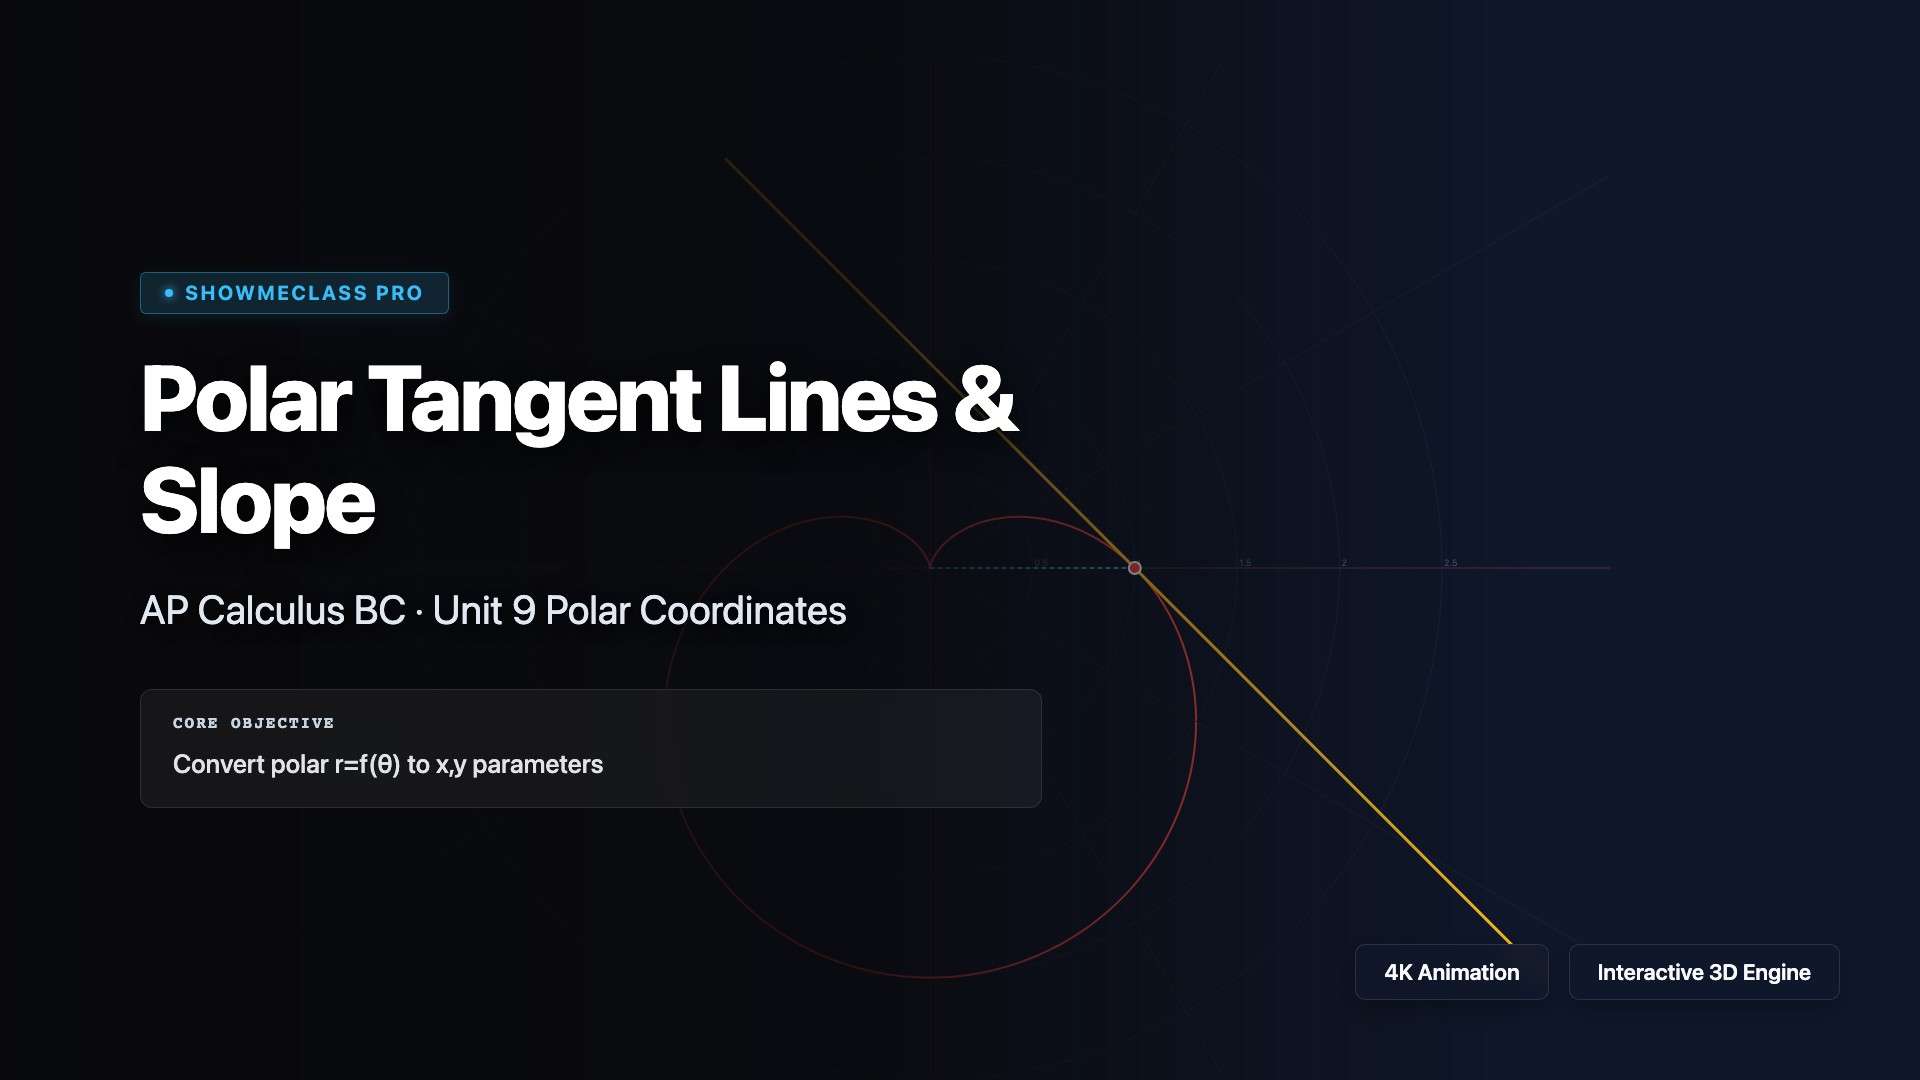
Polar Tangent Lines & Slope
Visualize dy/dx for polar curves r=f(θ) using the chain rule conversion to Cartesian. Shows tangent lines, radial vectors, and identifies horizontal/vertical tangents on Cardioid, Rose, Limaçon, and Lemniscate curves.
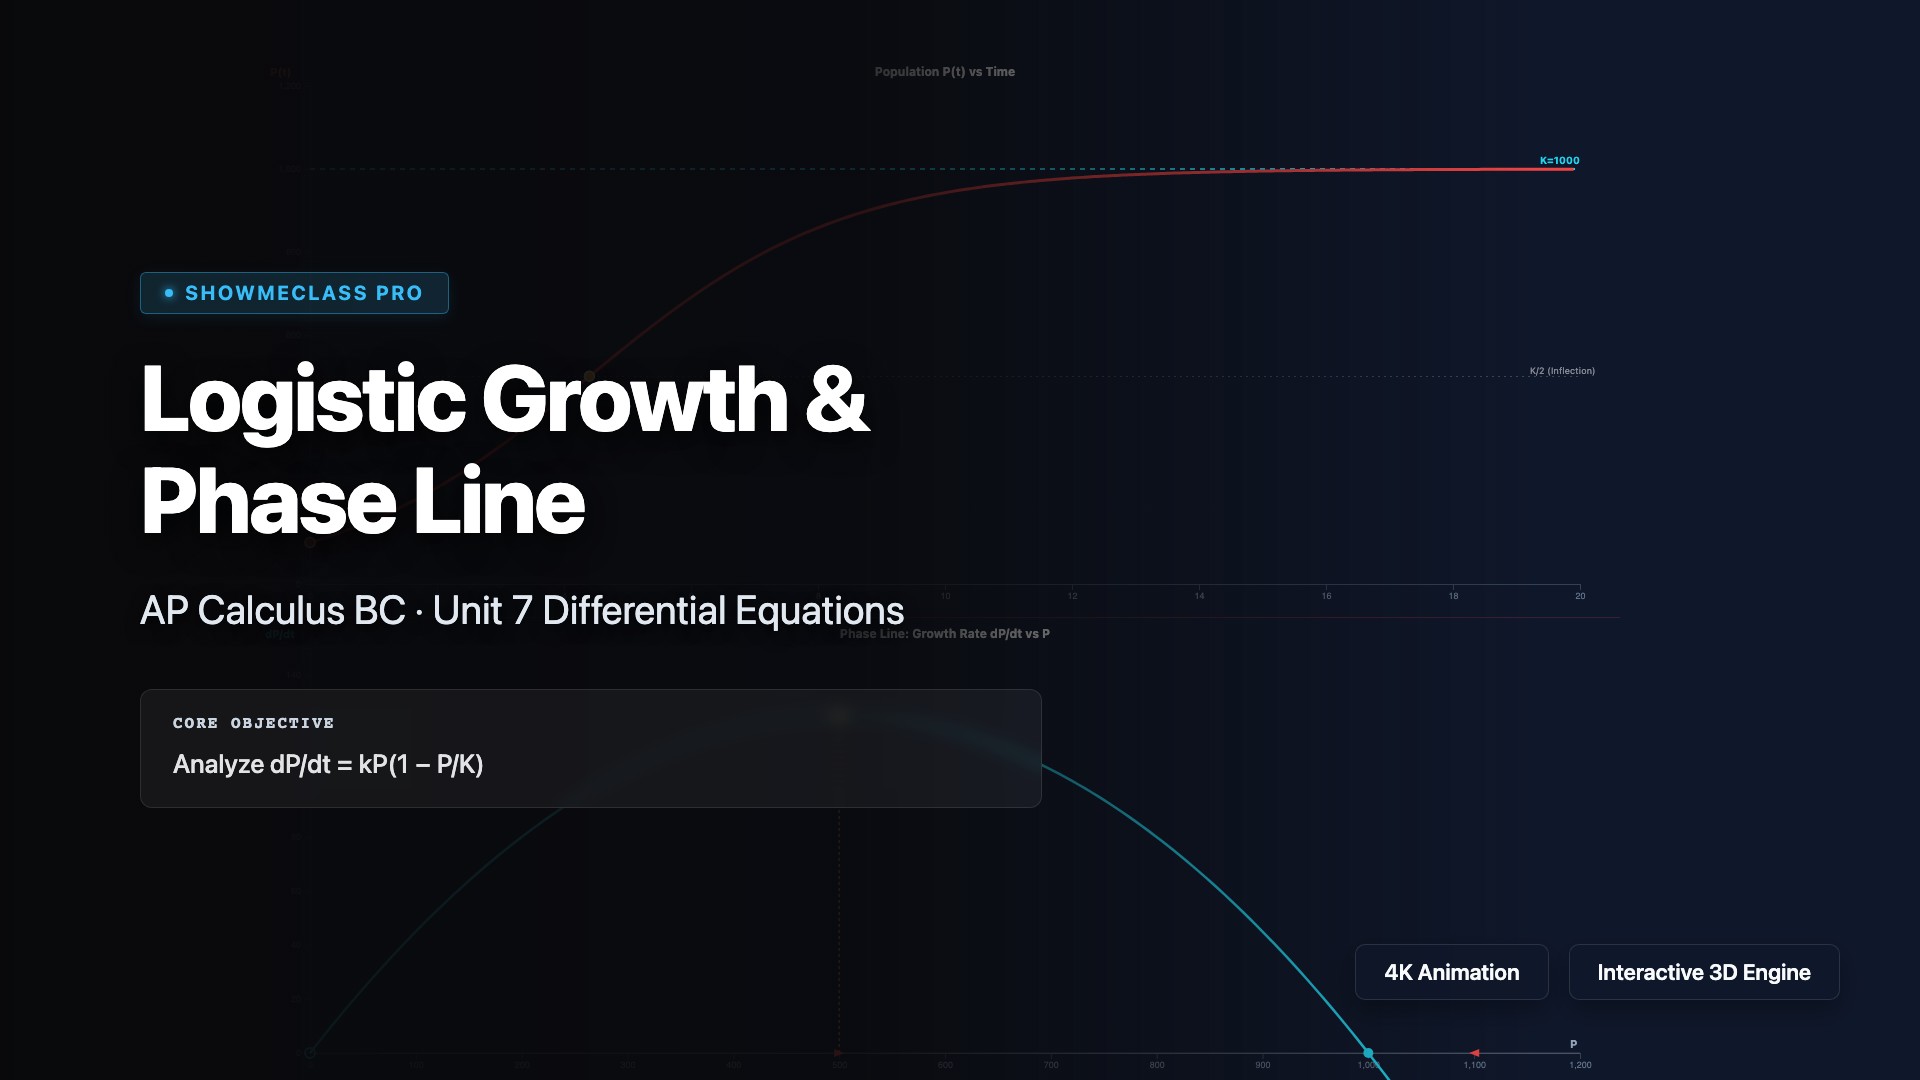
Logistic Growth & Phase Line
Dual-panel logistic differential equation analyzer. Top: P(t) solution curve with carrying capacity K and inflection at K/2. Bottom: dP/dt vs P parabolic phase space showing stable/unstable equilibria and maximum growth rate. Adjustable k, K, and P₀.
Vector Curvature & Acceleration
Vector-valued function analyzer showing velocity (tangent), acceleration vectors, curvature κ, and osculating circle with radius R=1/κ. Explore Parabola, Sine Wave, Spiral, and Astroid trajectories with animated particle motion.
Surface Area of Revolution
3D wireframe rendering of surfaces of revolution around the x-axis. Demonstrates S = ∫2πf(x)√(1+f'(x)²)dx with interactive rotation angle and bounds. Explore Sphere, Cone, Gabriel's Horn, and Sine Vase with drag-to-orbit camera.
Partial Fractions Decomposition
Step-by-step partial fractions decomposition walkthrough using the Heaviside Cover-Up Method. Color-coded algebraic steps for 4 integral types including factoring, coefficient solving, and natural log integration with u-substitution bypass detection.
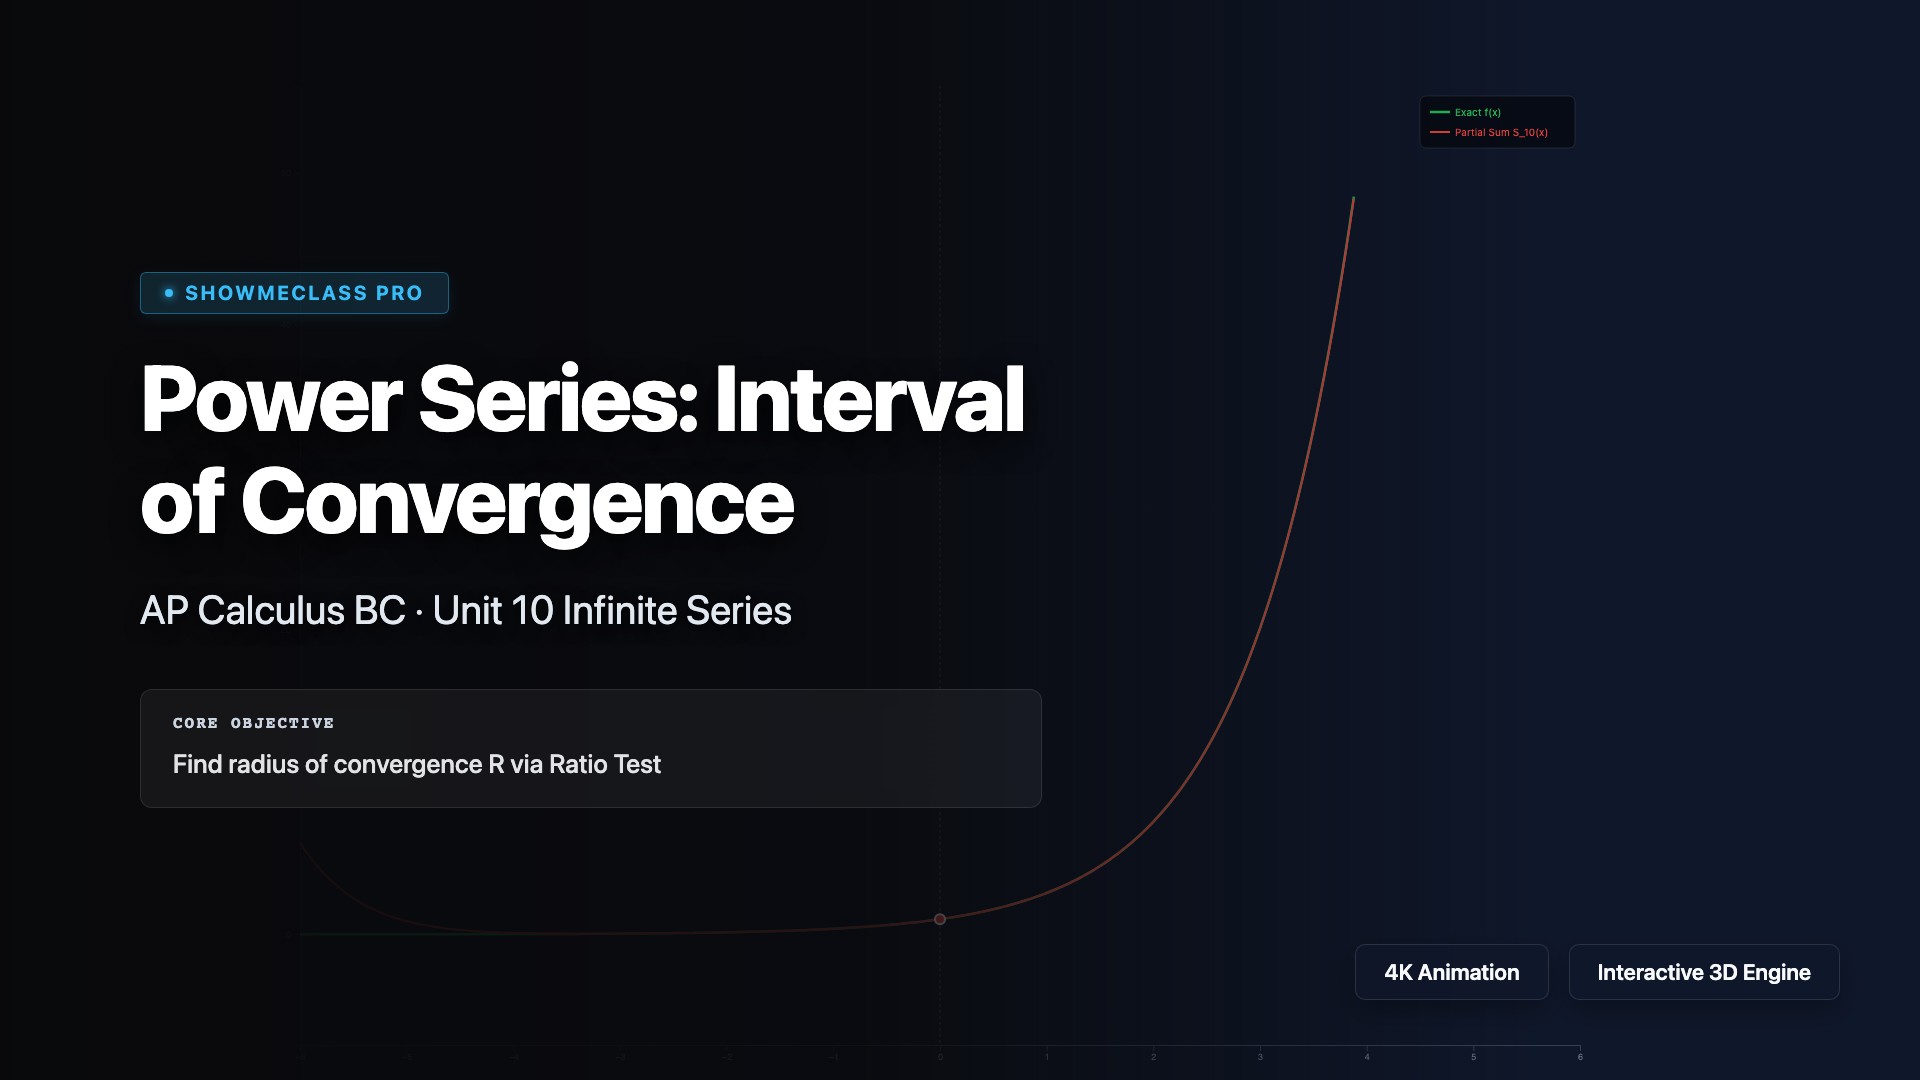
Power Series: Interval of Convergence
Interactive power series convergence visualizer comparing partial sums S_N(x) against exact functions. Shows convergence interval with amber boundary lines, Ratio Test explanations, and endpoint analysis for e^x, geometric, ln, cos(x), and n^n x^n/n! series.