Showing 12 results
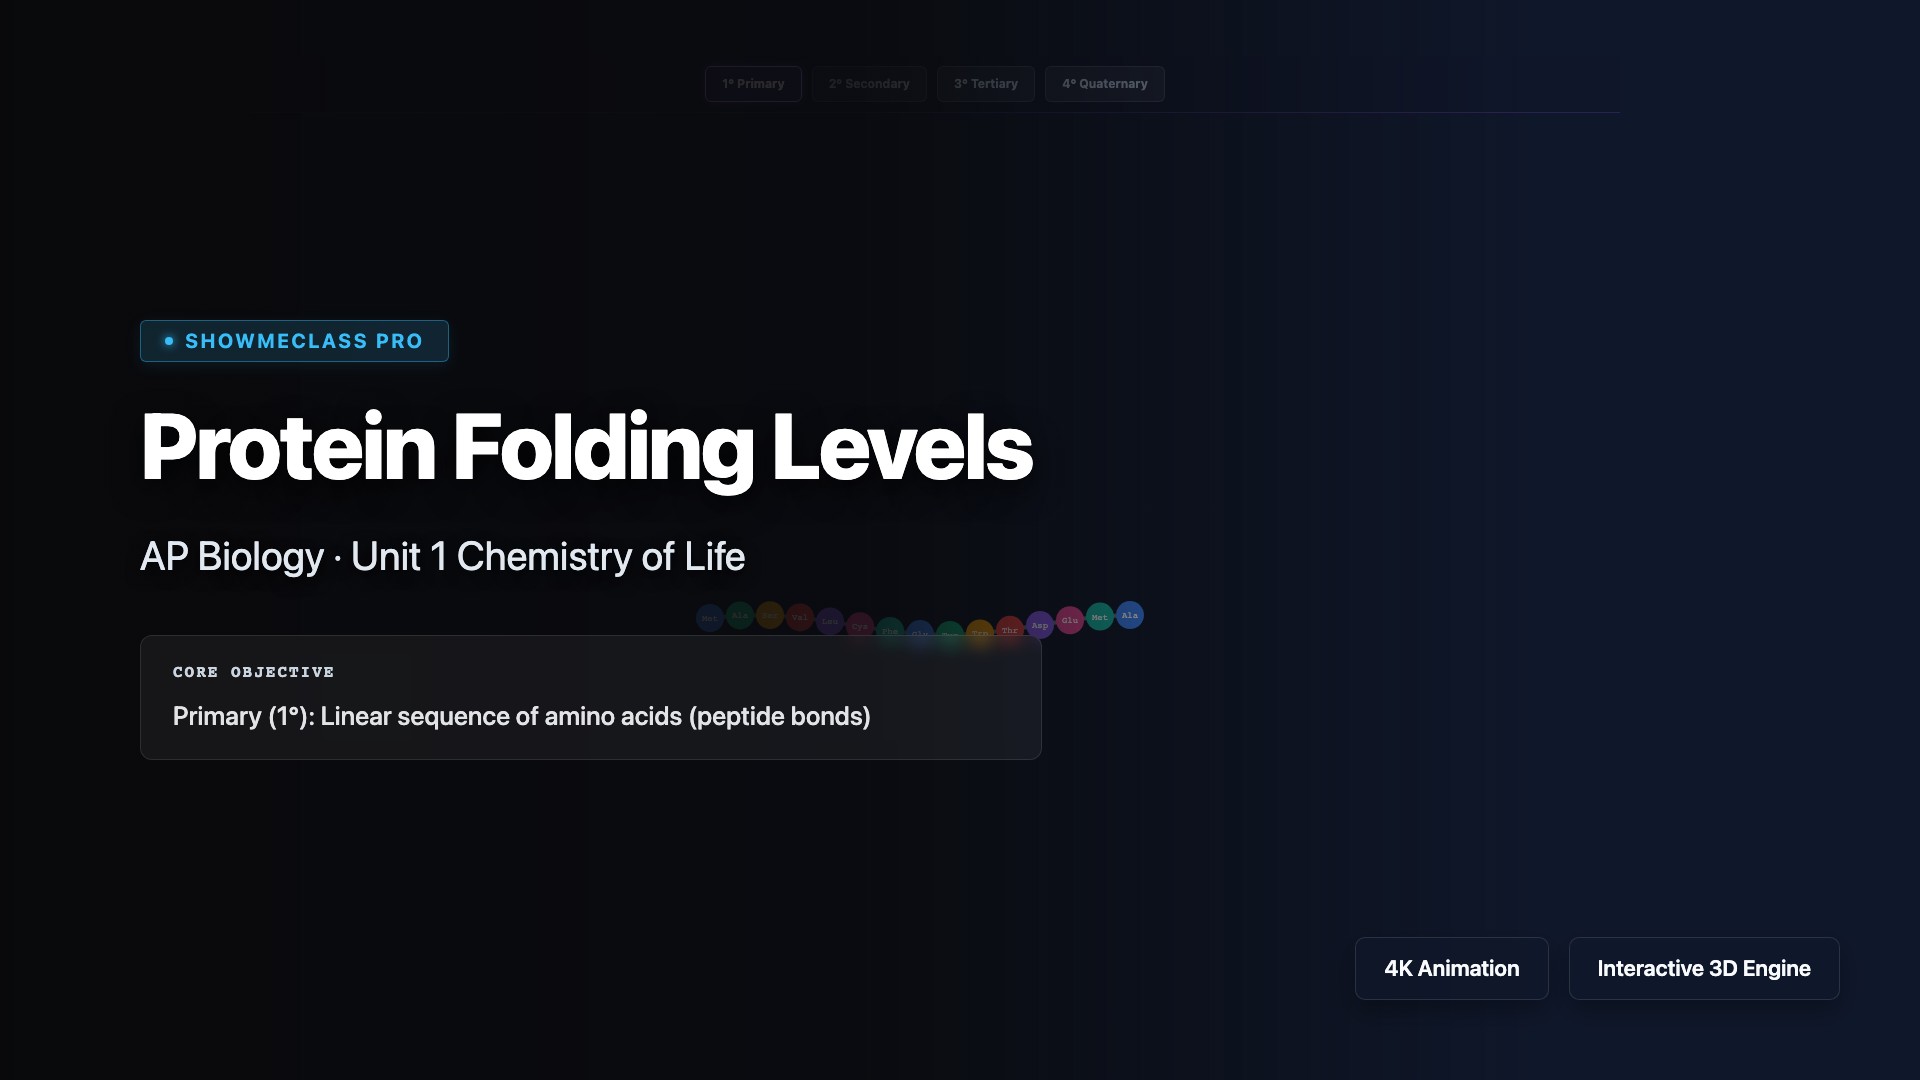
Protein Folding Levels (1°-4°)
Animated stepwise assembly of a protein from its primary amino acid sequence through alpha-helices/beta-sheets to complex 3D tertiary and quaternary structures, including extreme heat denaturation.
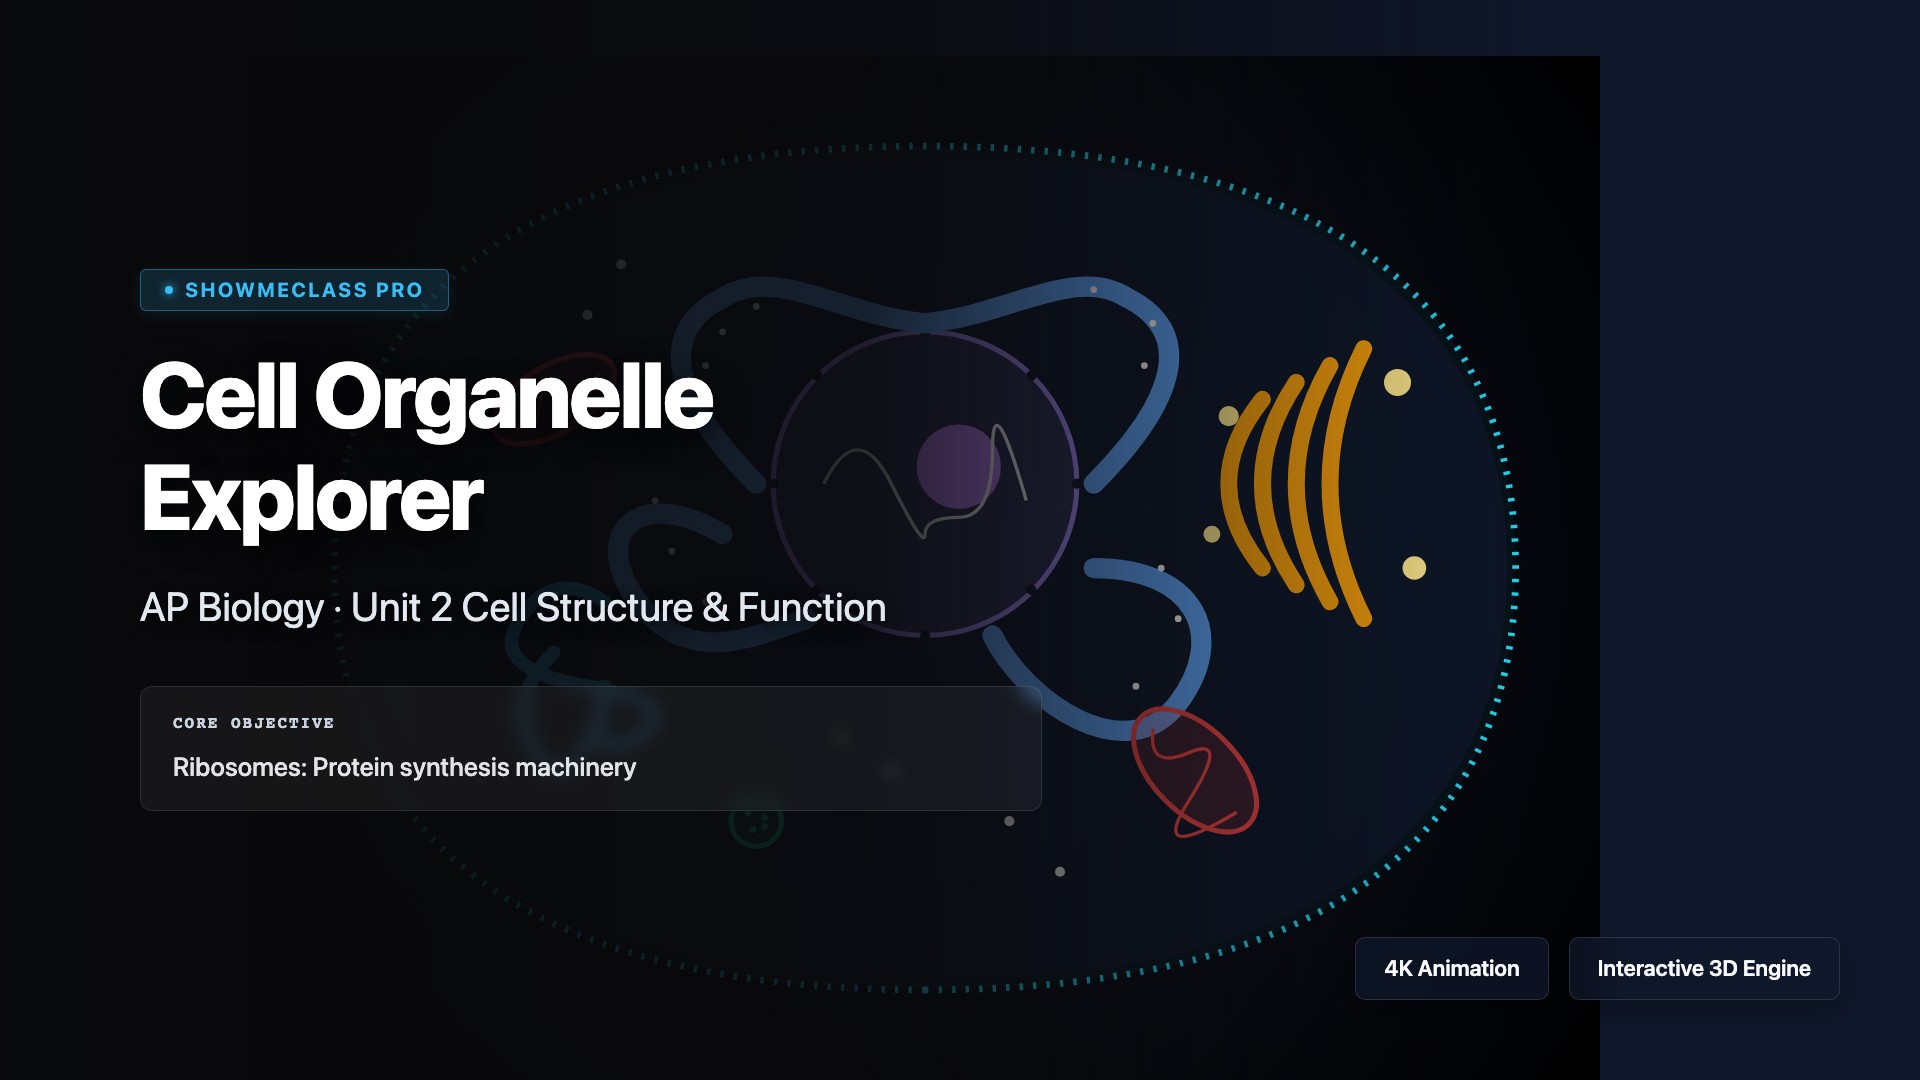
Cell Organelle Function Explorer
Explore an interactive diagram of a eukaryotic cell. Click on organelles like the Nucleus, Rough/Smooth ER, Golgi, and Mitochondria to view detailed functions.
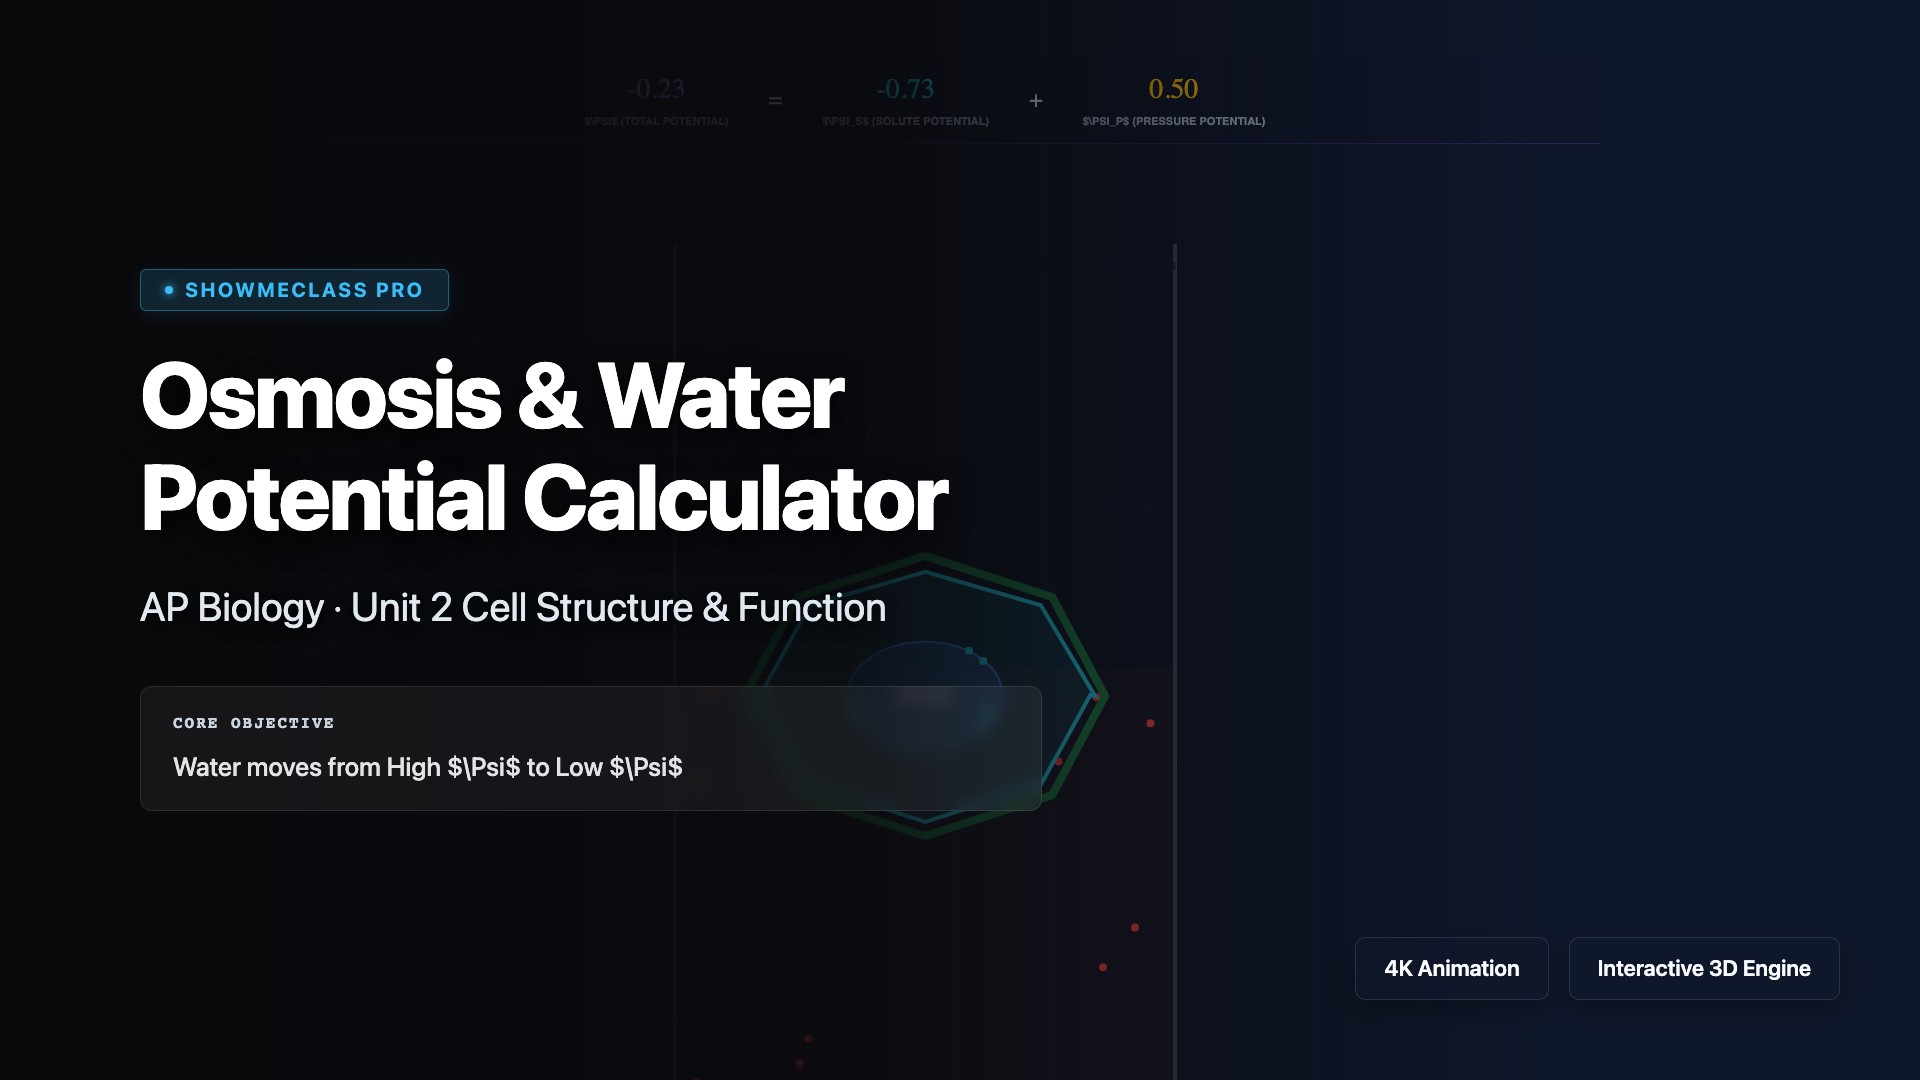
Osmosis & Water Potential Calculator
Calculate and visualize water potential (Ψ = Ψs + Ψp) across a plant cell membrane. Watch water movement and cell plasmolysis/turgidity based on hypertonic/hypotonic environments.
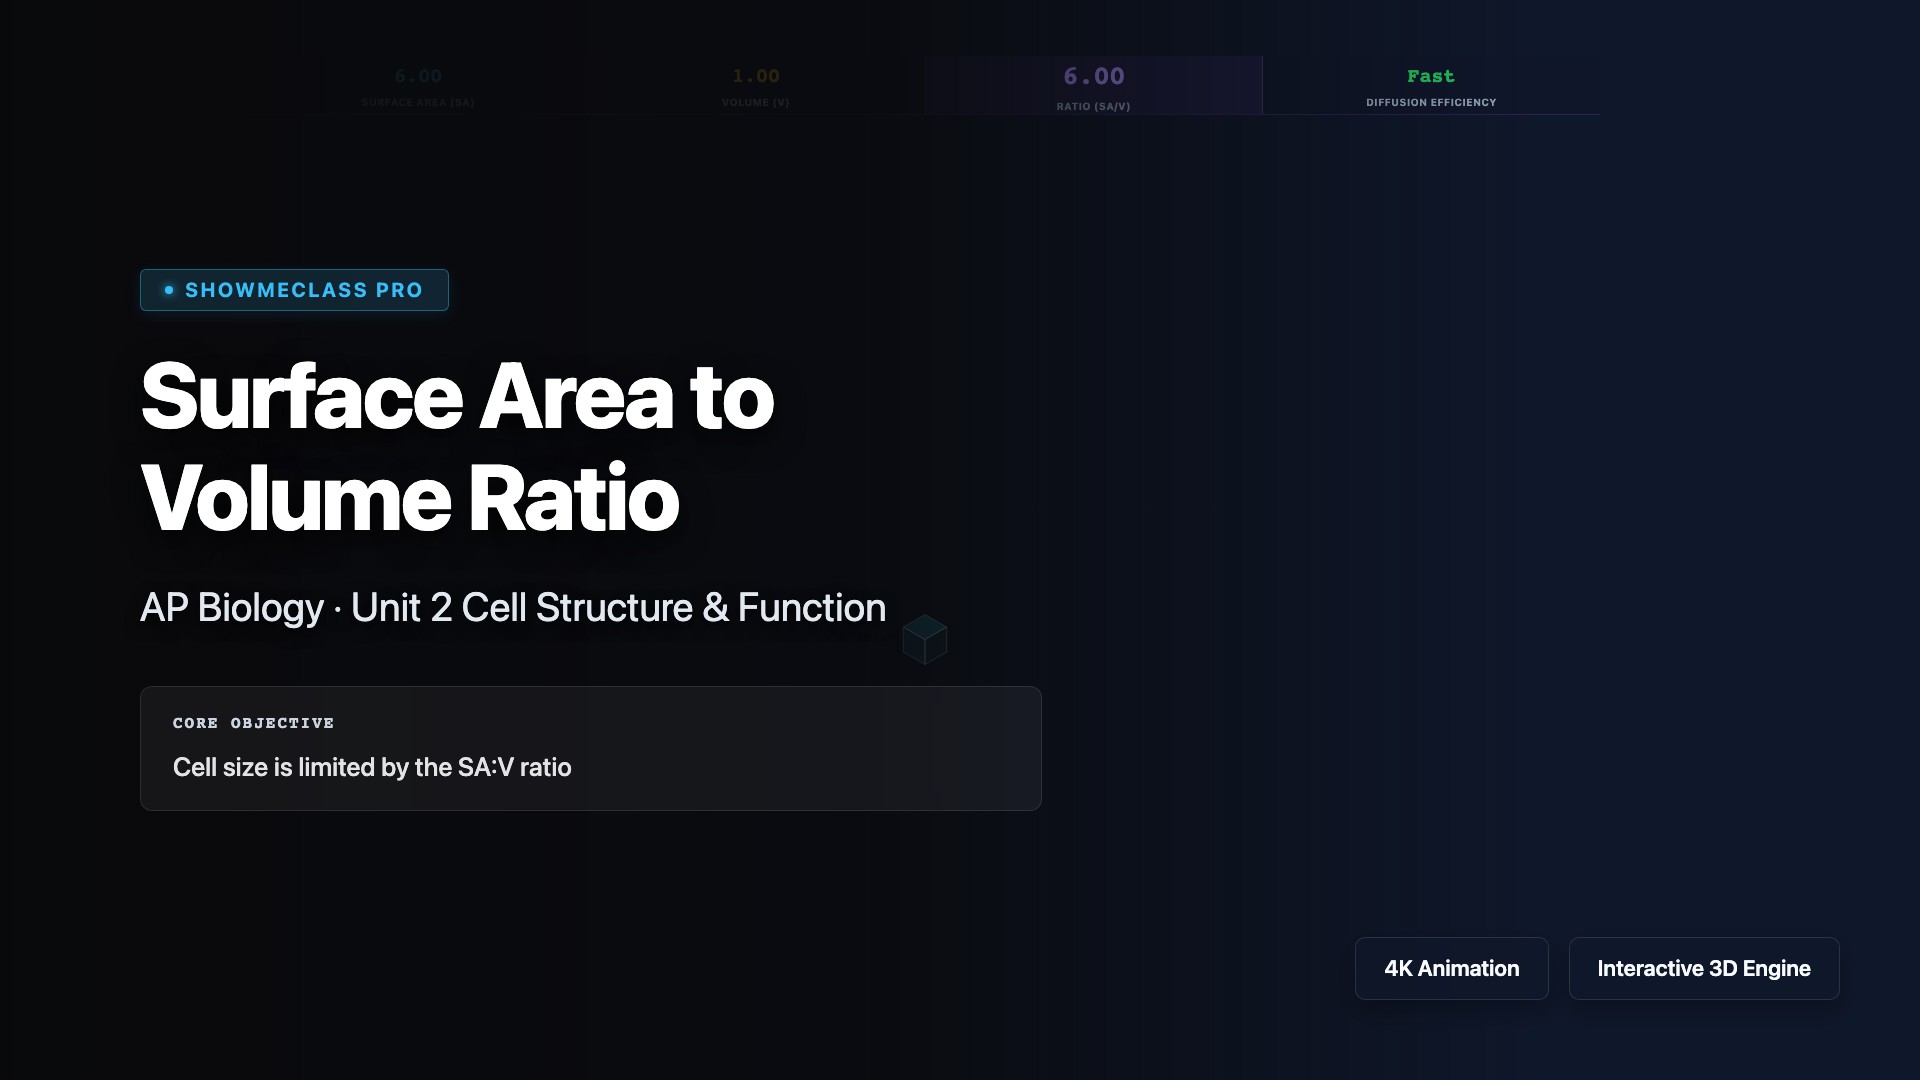
Surface Area to Volume Ratio Animator
Visualize how increasing cell size severely decreases the SA:V ratio, simulating diffusion waves to show why cells must remain small or develop folds.
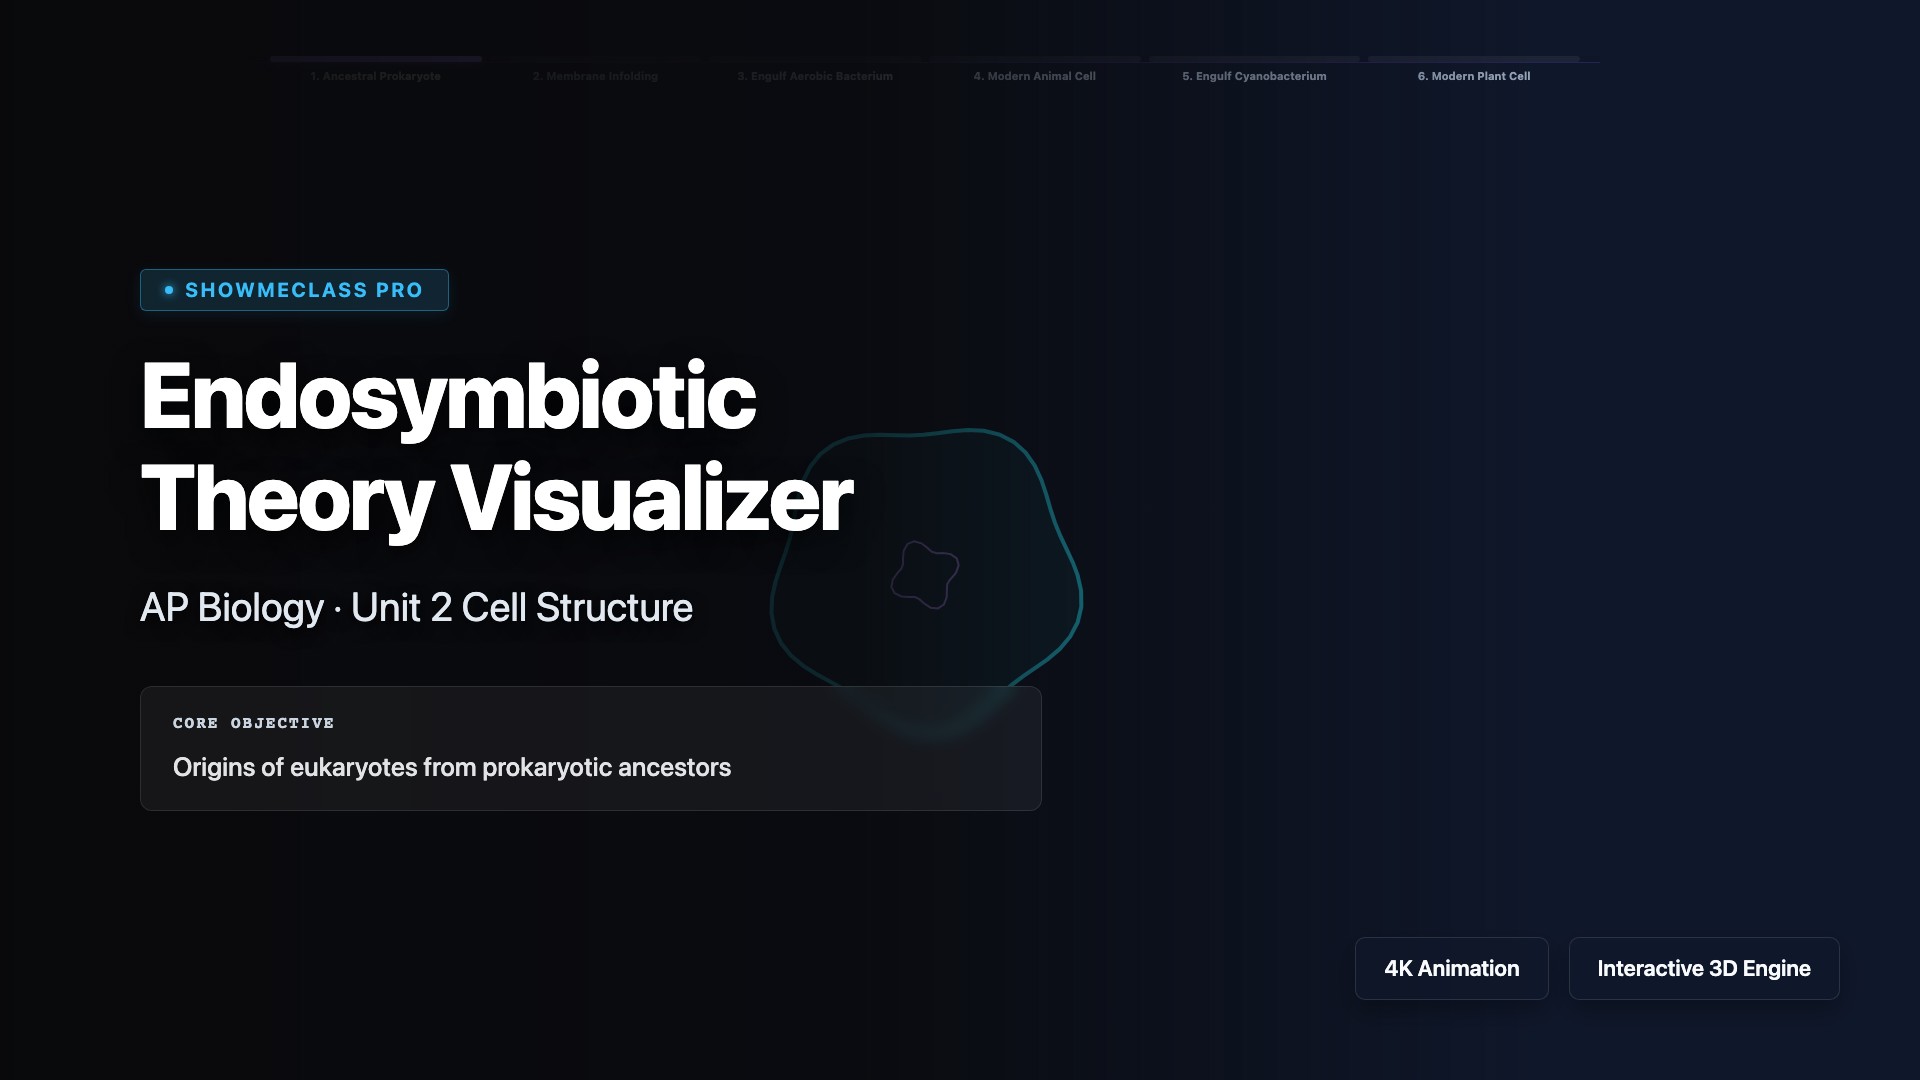
Endosymbiotic Theory Visualizer
Step through an animated history of a eukaryotic cell engulfing aerobic and photosynthetic bacteria to form mitochondria and chloroplasts, respectively.
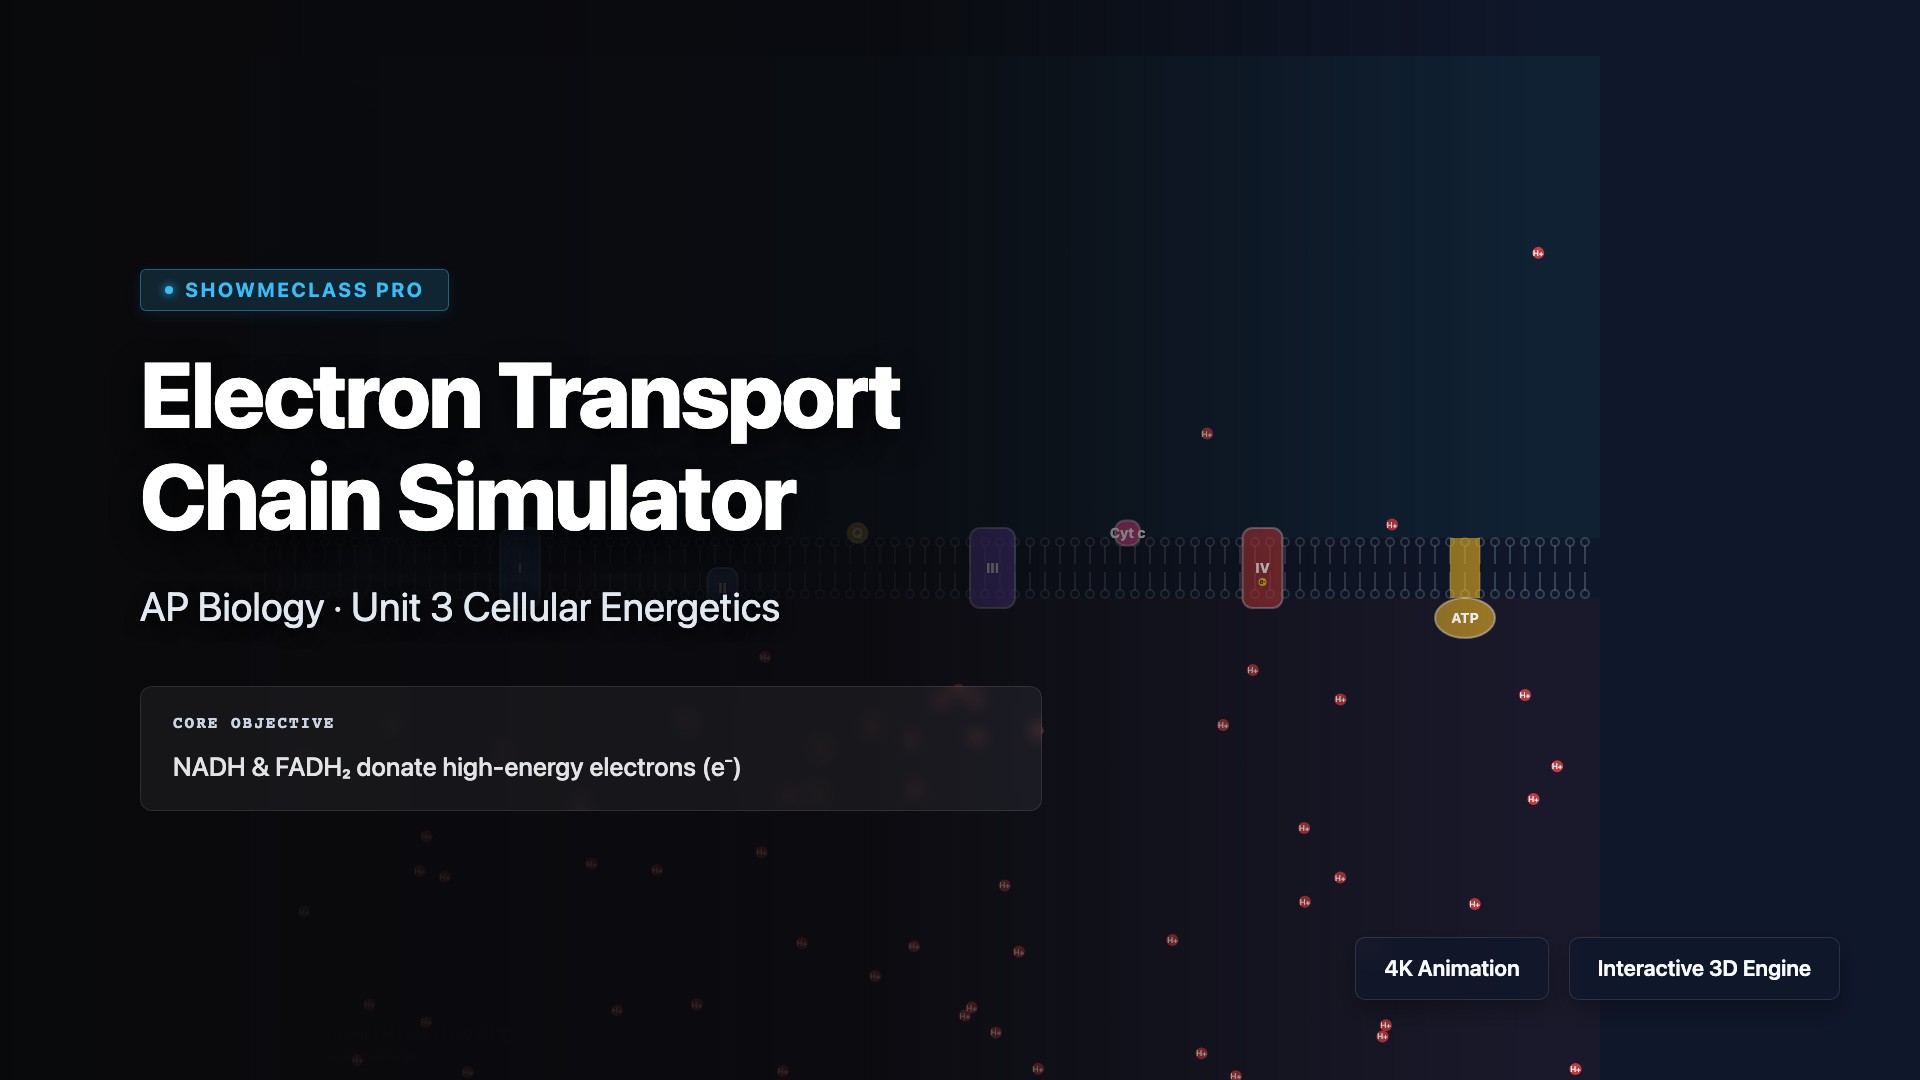
Electron Transport Chain Simulator
Interact with Mitochondrion Complexes I-IV and ATP Synthase. Adjust NADH/O₂ supplies and apply inhibitors (Cyanide, DNP) to observe effects on the proton motive force.
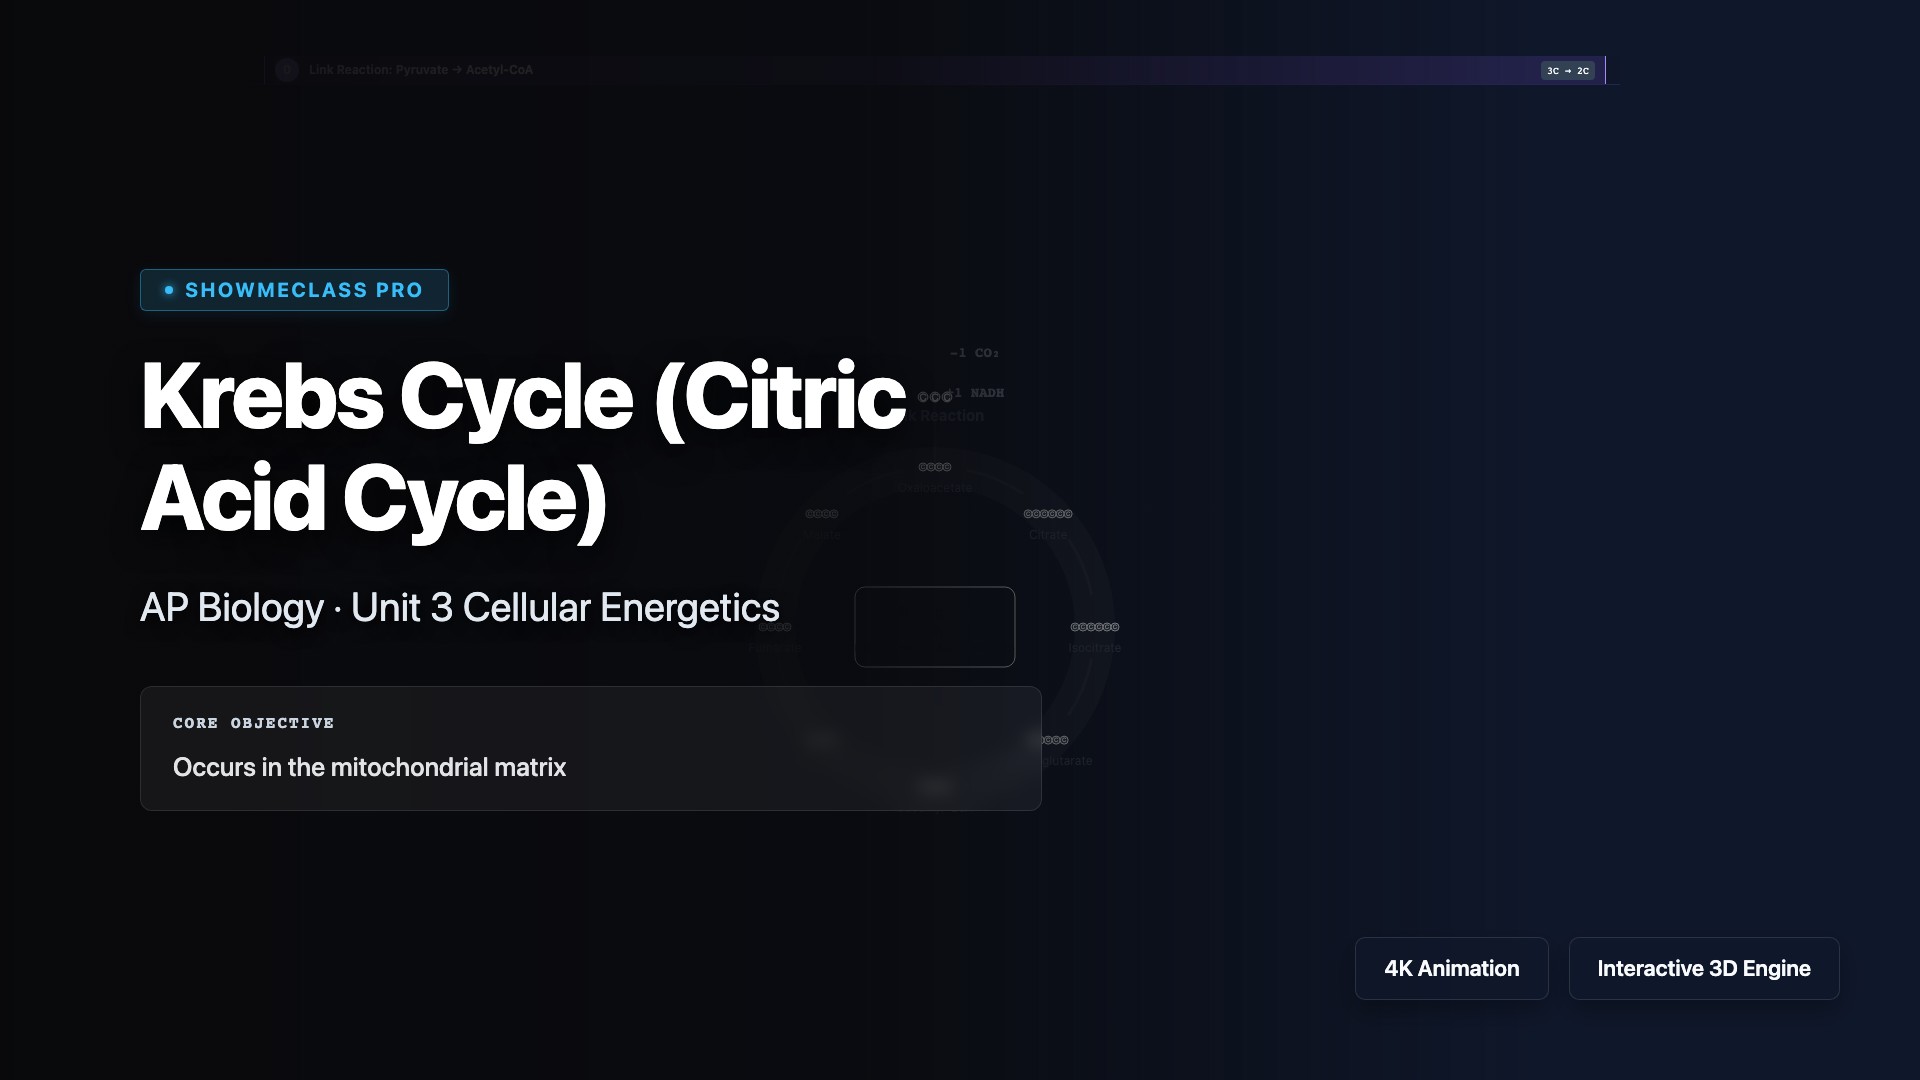
Krebs Cycle Step-by-Step
Step through the 8 stages of the Citric Acid Cycle, visualizing the breakdown of Acetyl-CoA and the tracking of Carbon, NADH, FADH₂, and ATP yields.
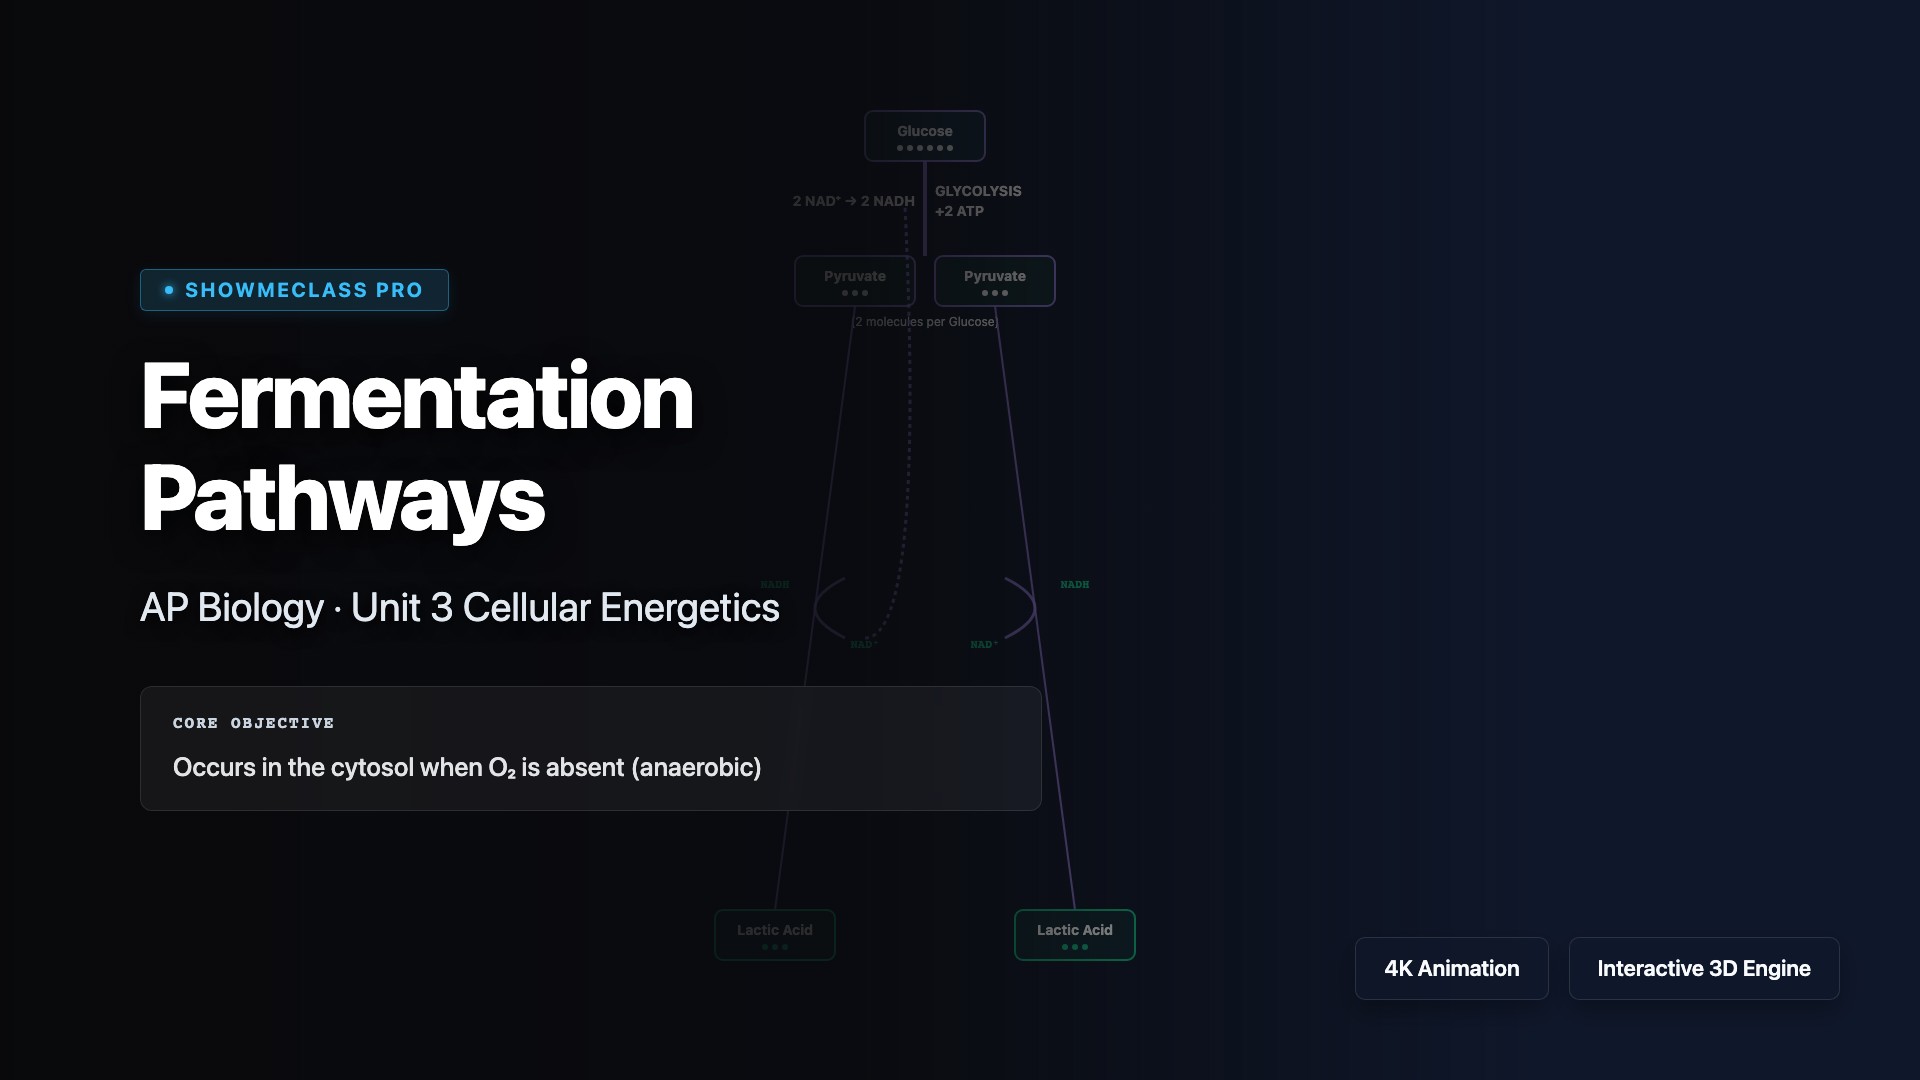
Fermentation Pathways Simulator
Compare anaerobic Lactic Acid Fermentation vs Alcoholic Fermentation to Aerobic Respiration, emphasizing the critical need to regenerate NAD⁺ for glycolysis.
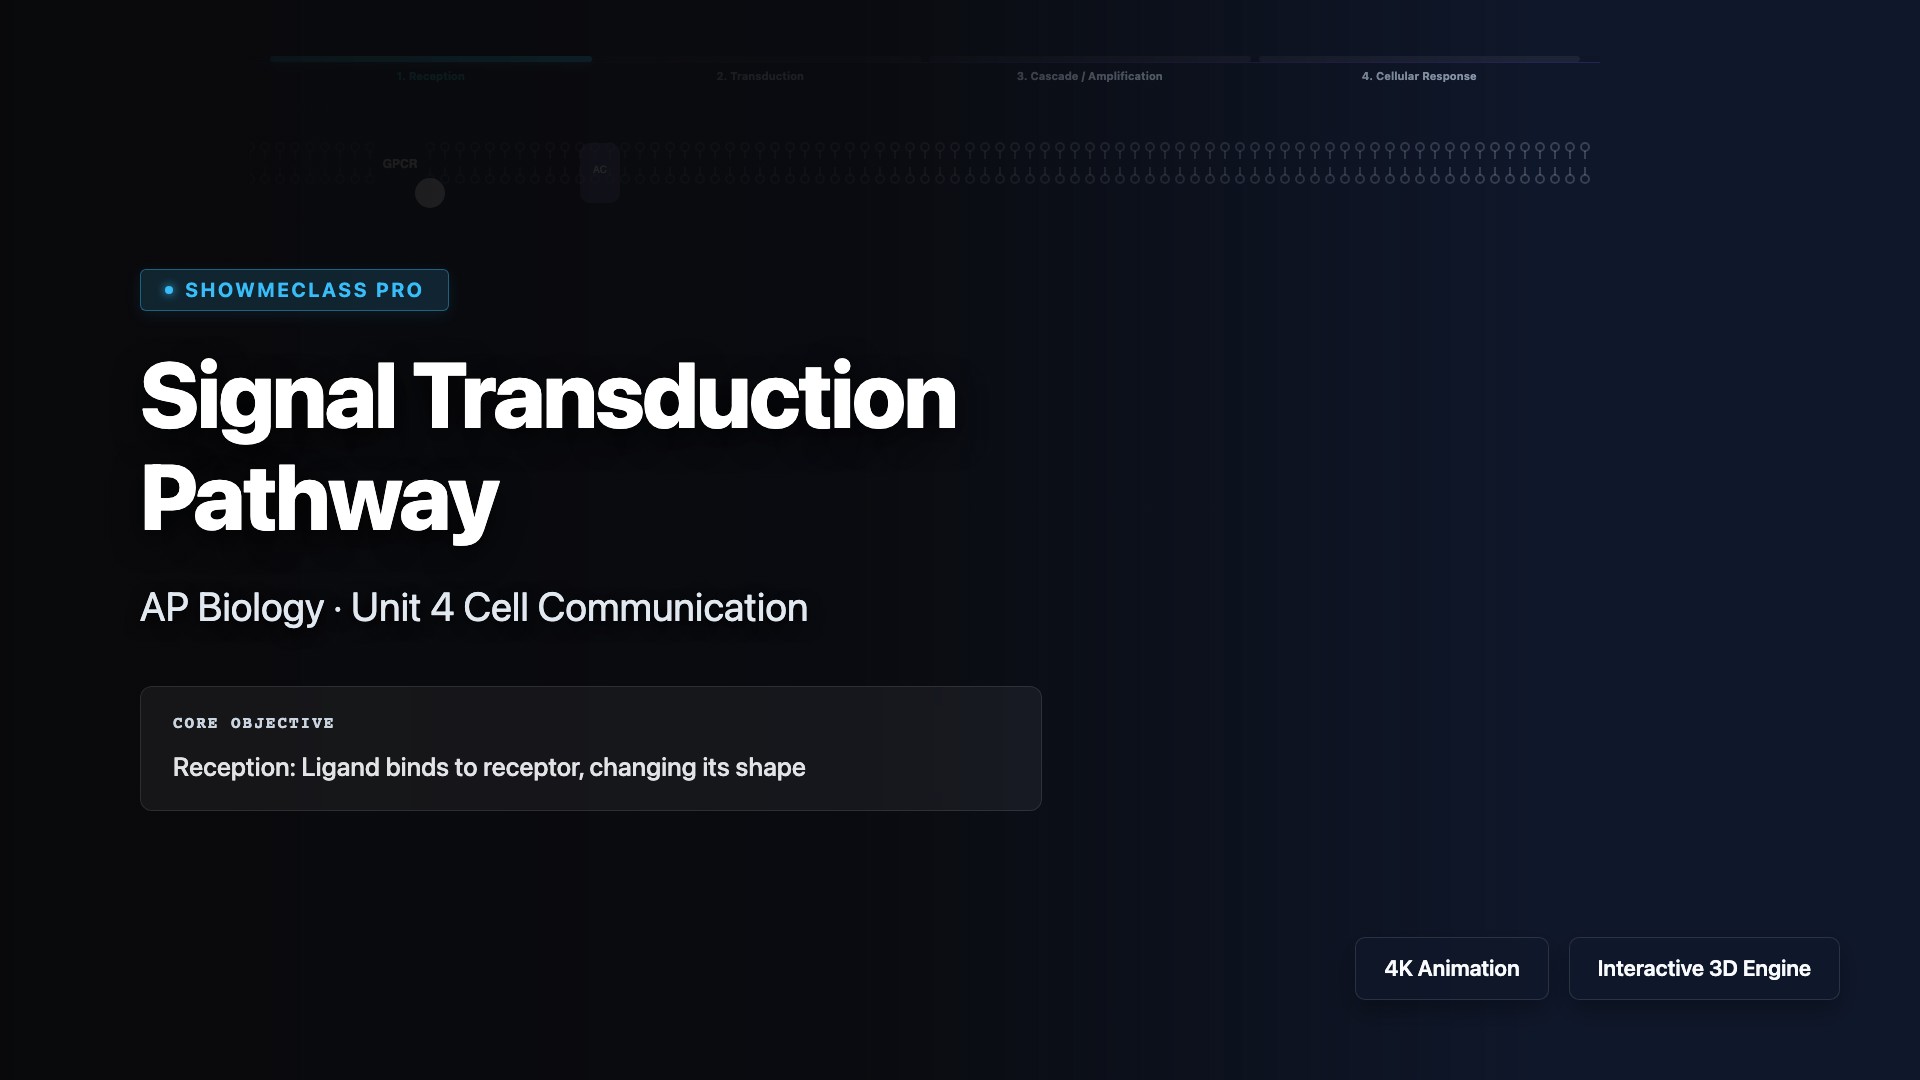
Signal Transduction Pathway
Trigger an epinephrine signaling cascade spanning Reception (GPCR), Transduction (G-protein, Adenylyl Cyclase, cAMP), and Response (PKA kinase amplification).
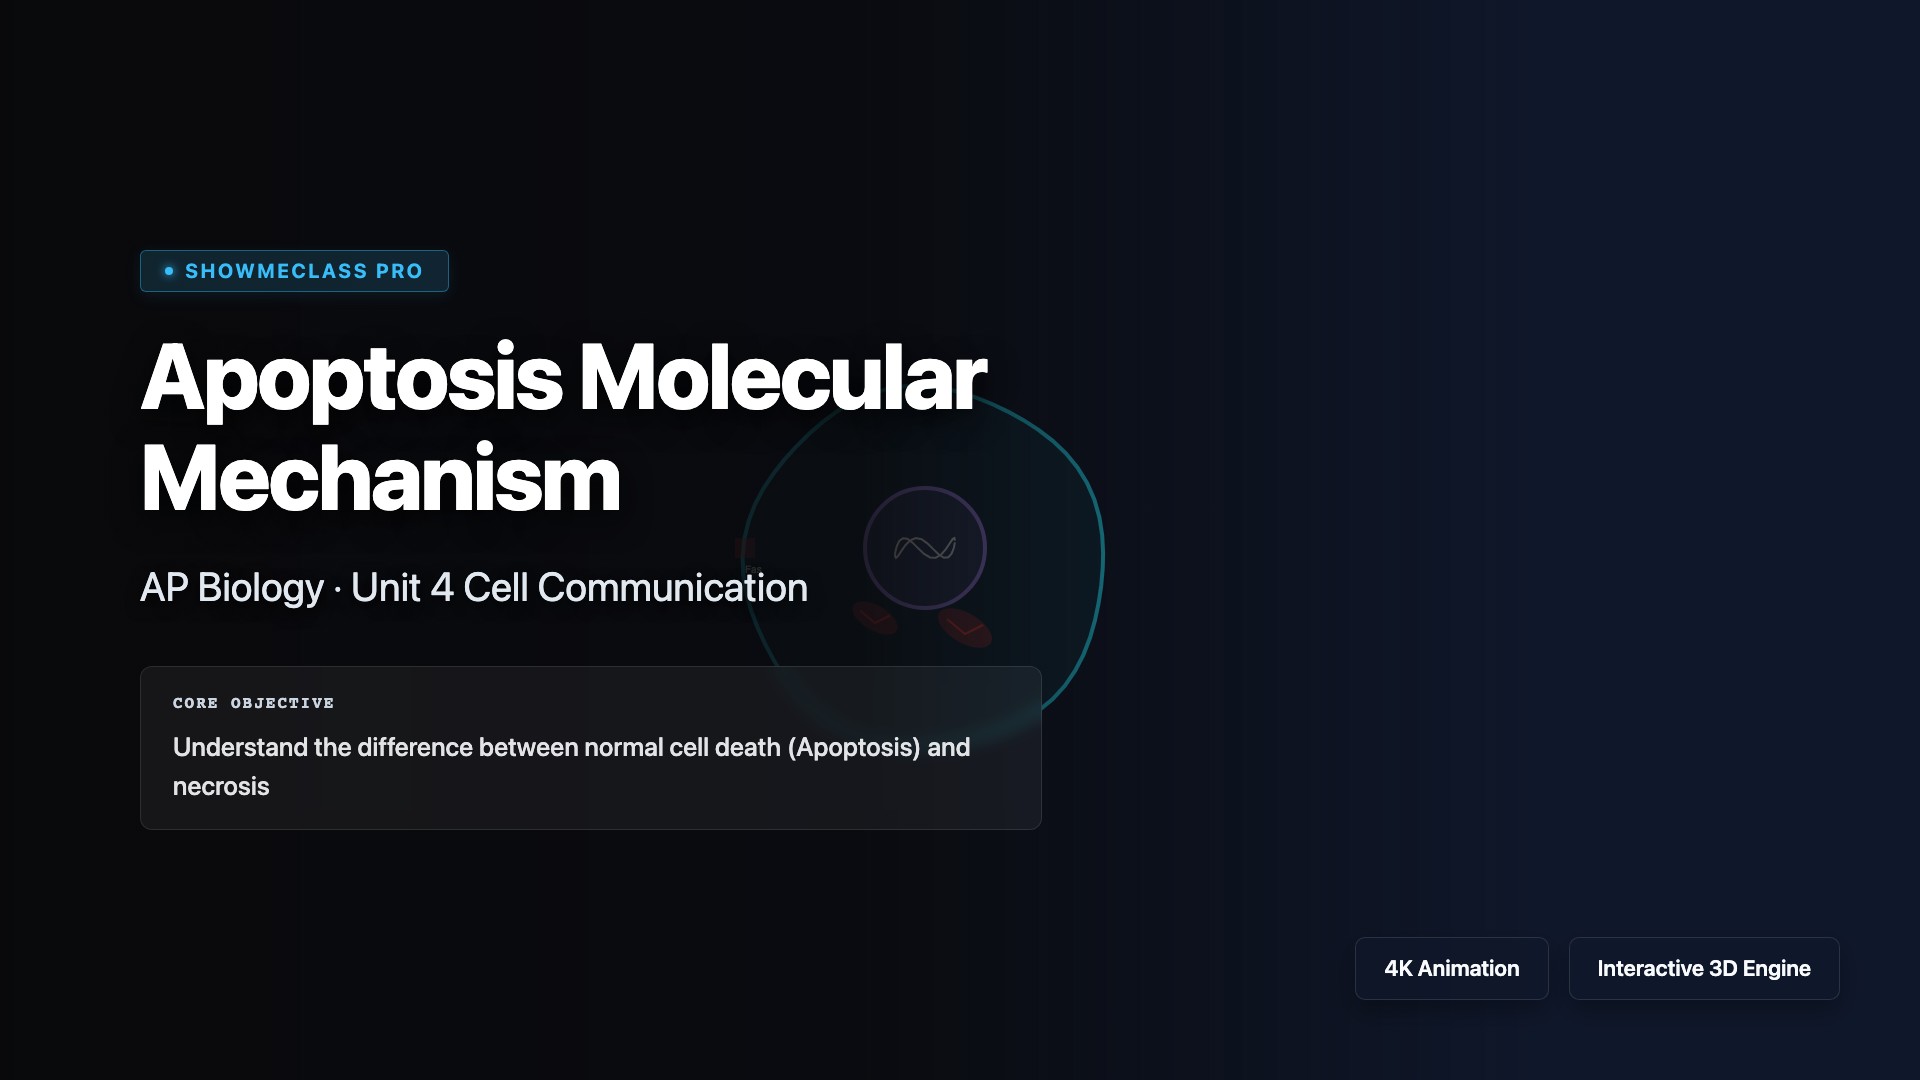
Apoptosis Molecular Mechanism
Trigger the intrinsic (mitochondrial/cytochrome c leakage) or extrinsic pathways of programmed cell death leading to the destructive Caspase cascade and cellular blebbing.
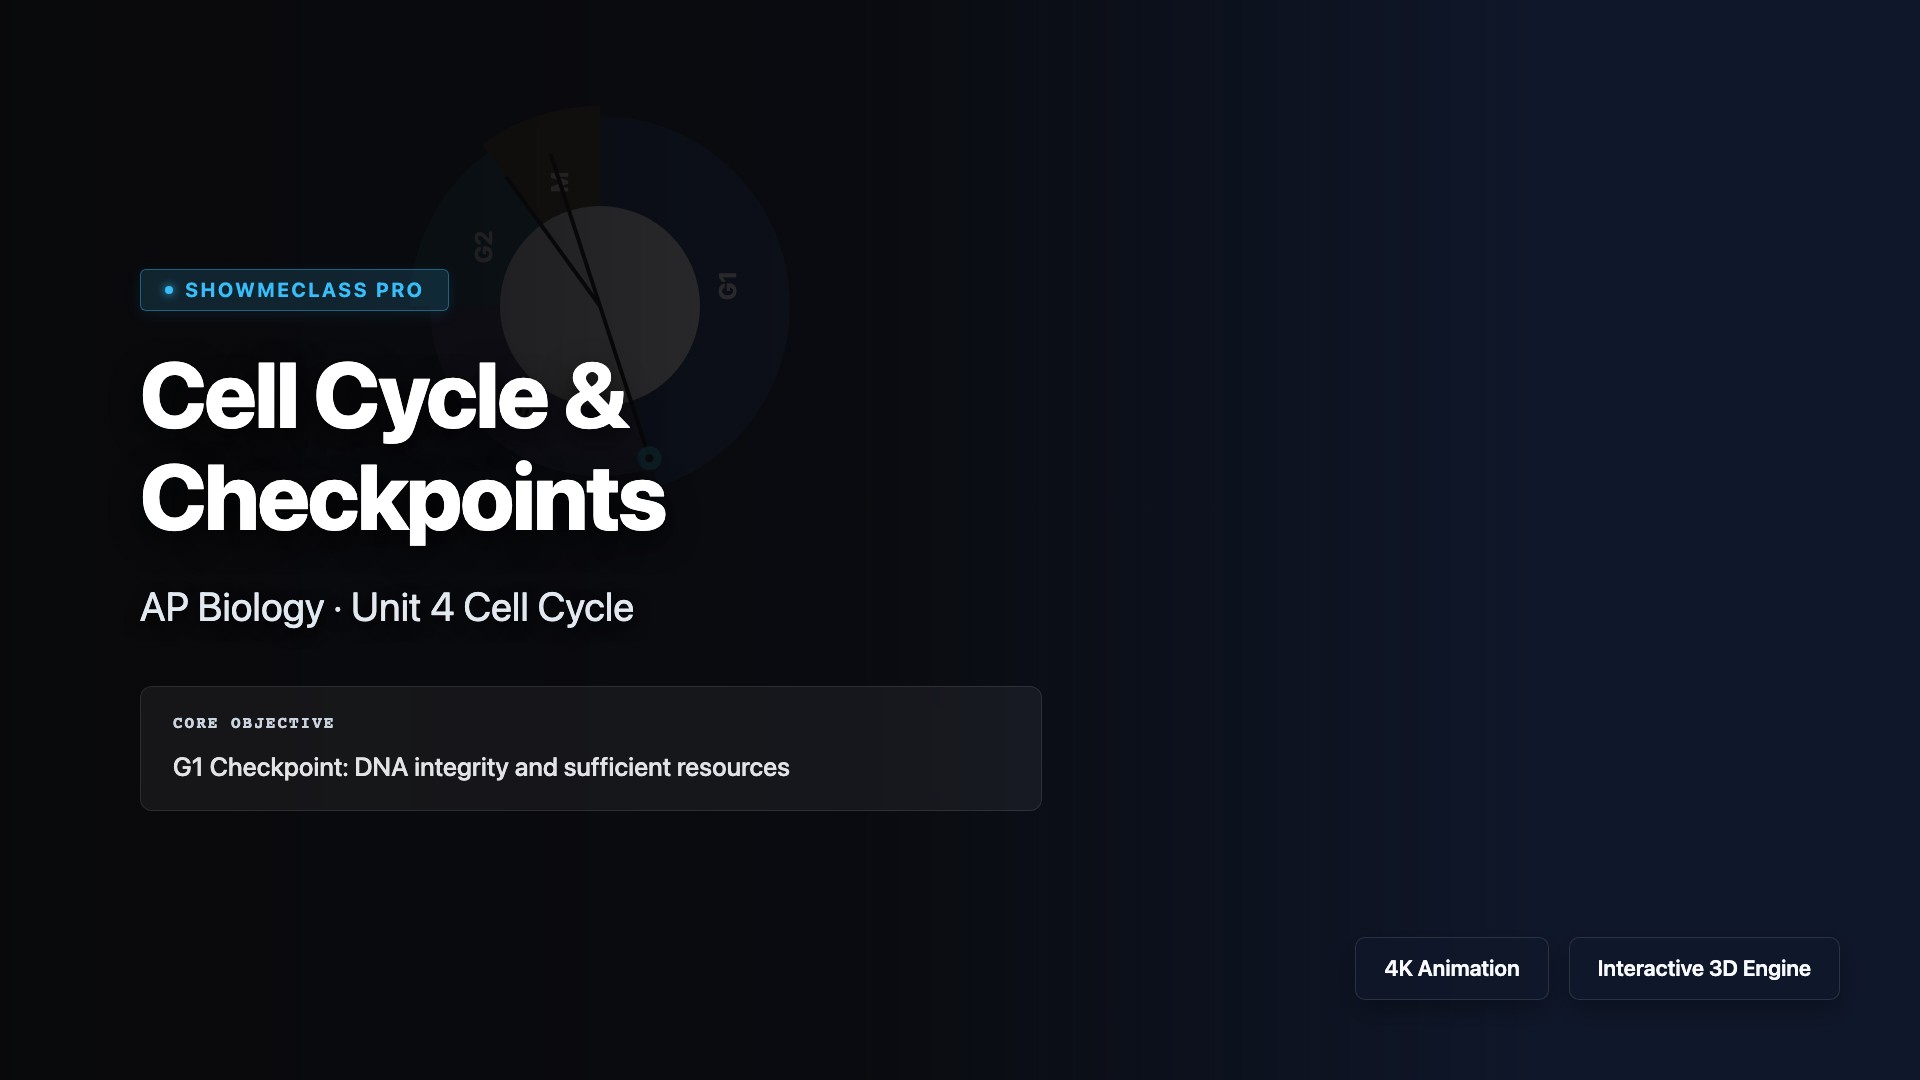
Cell Cycle & Checkpoints
Trace the cell cycle through Interphase and Mitosis. Mutate p53 tumor suppressors to bypass checkpoints, visualizing how unregulated division leads directly to cancer.
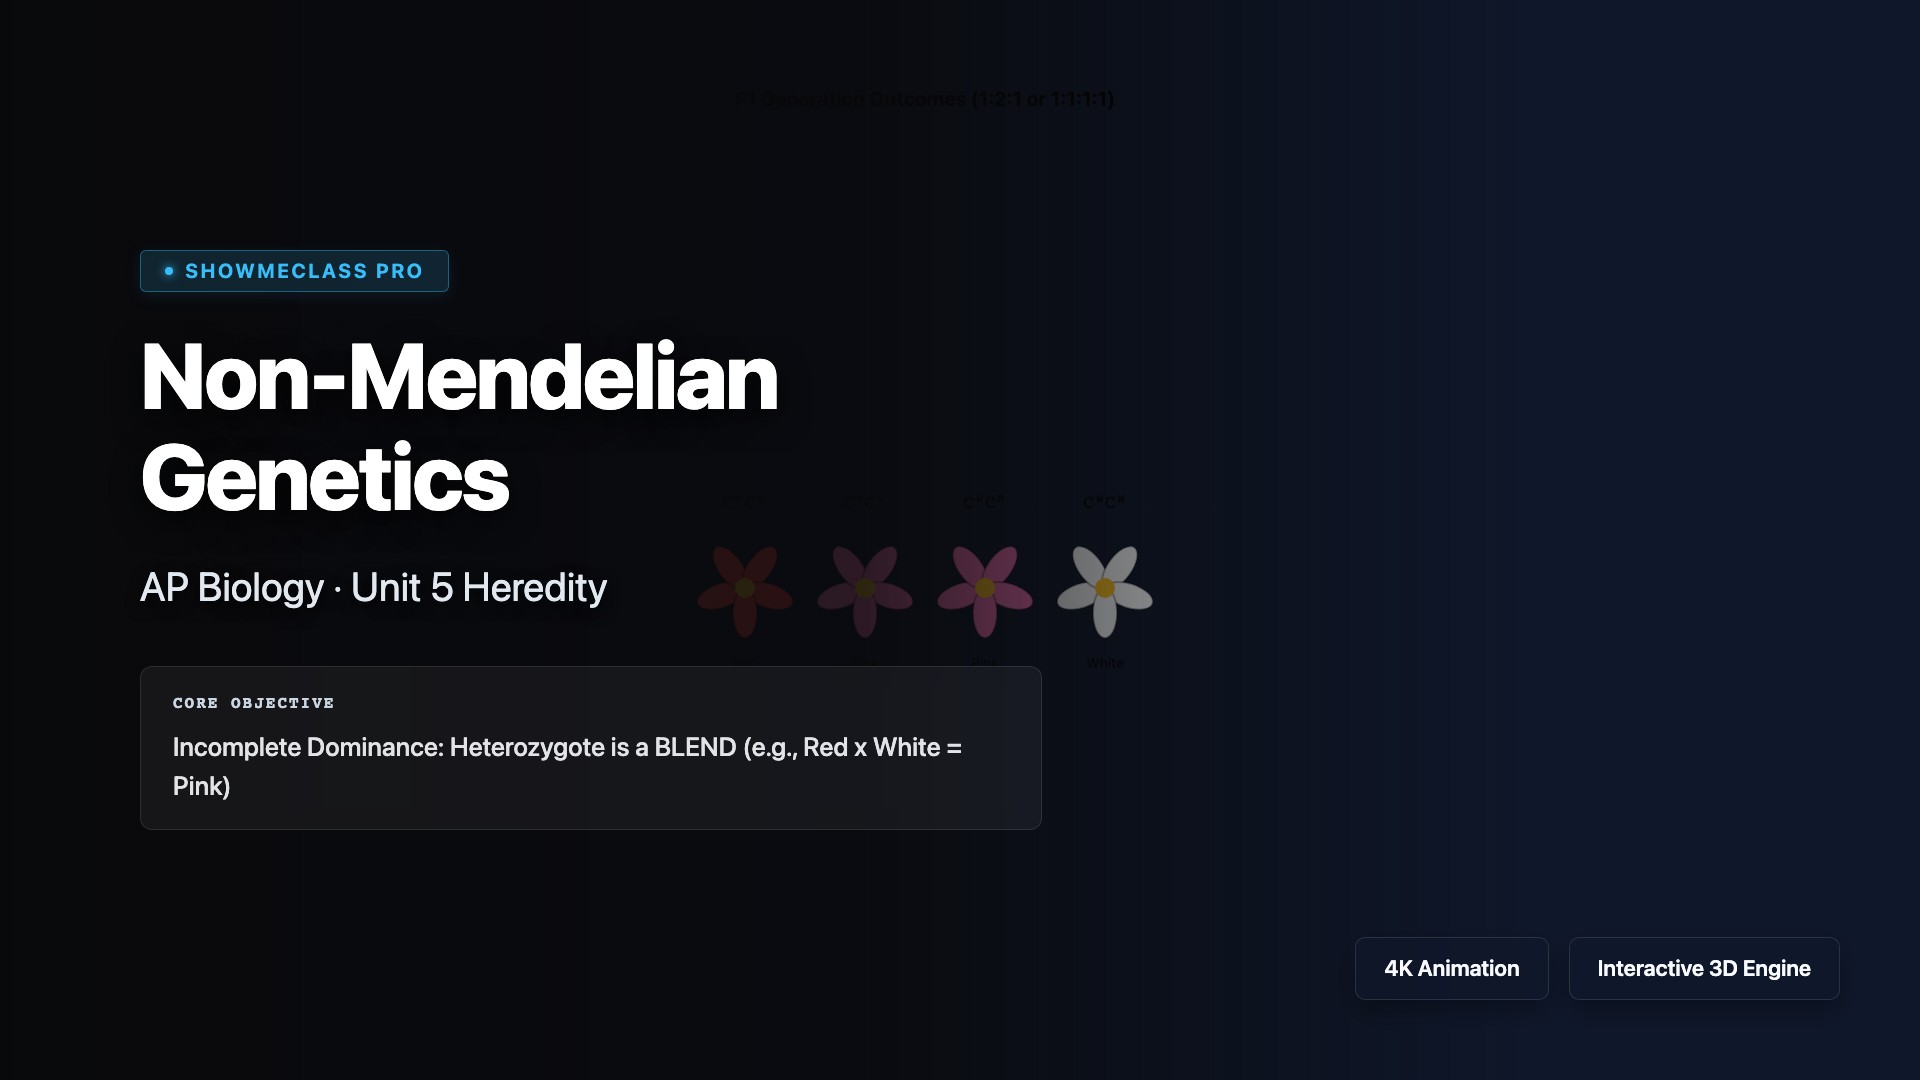
Non-Mendelian Genetics
Interactive Punnett Squares detailing Incomplete Dominance (Pink Flowers), Codominance (Roan Cattle), and Multiple Alleles (ABO Blood Types).