Showing 12 results
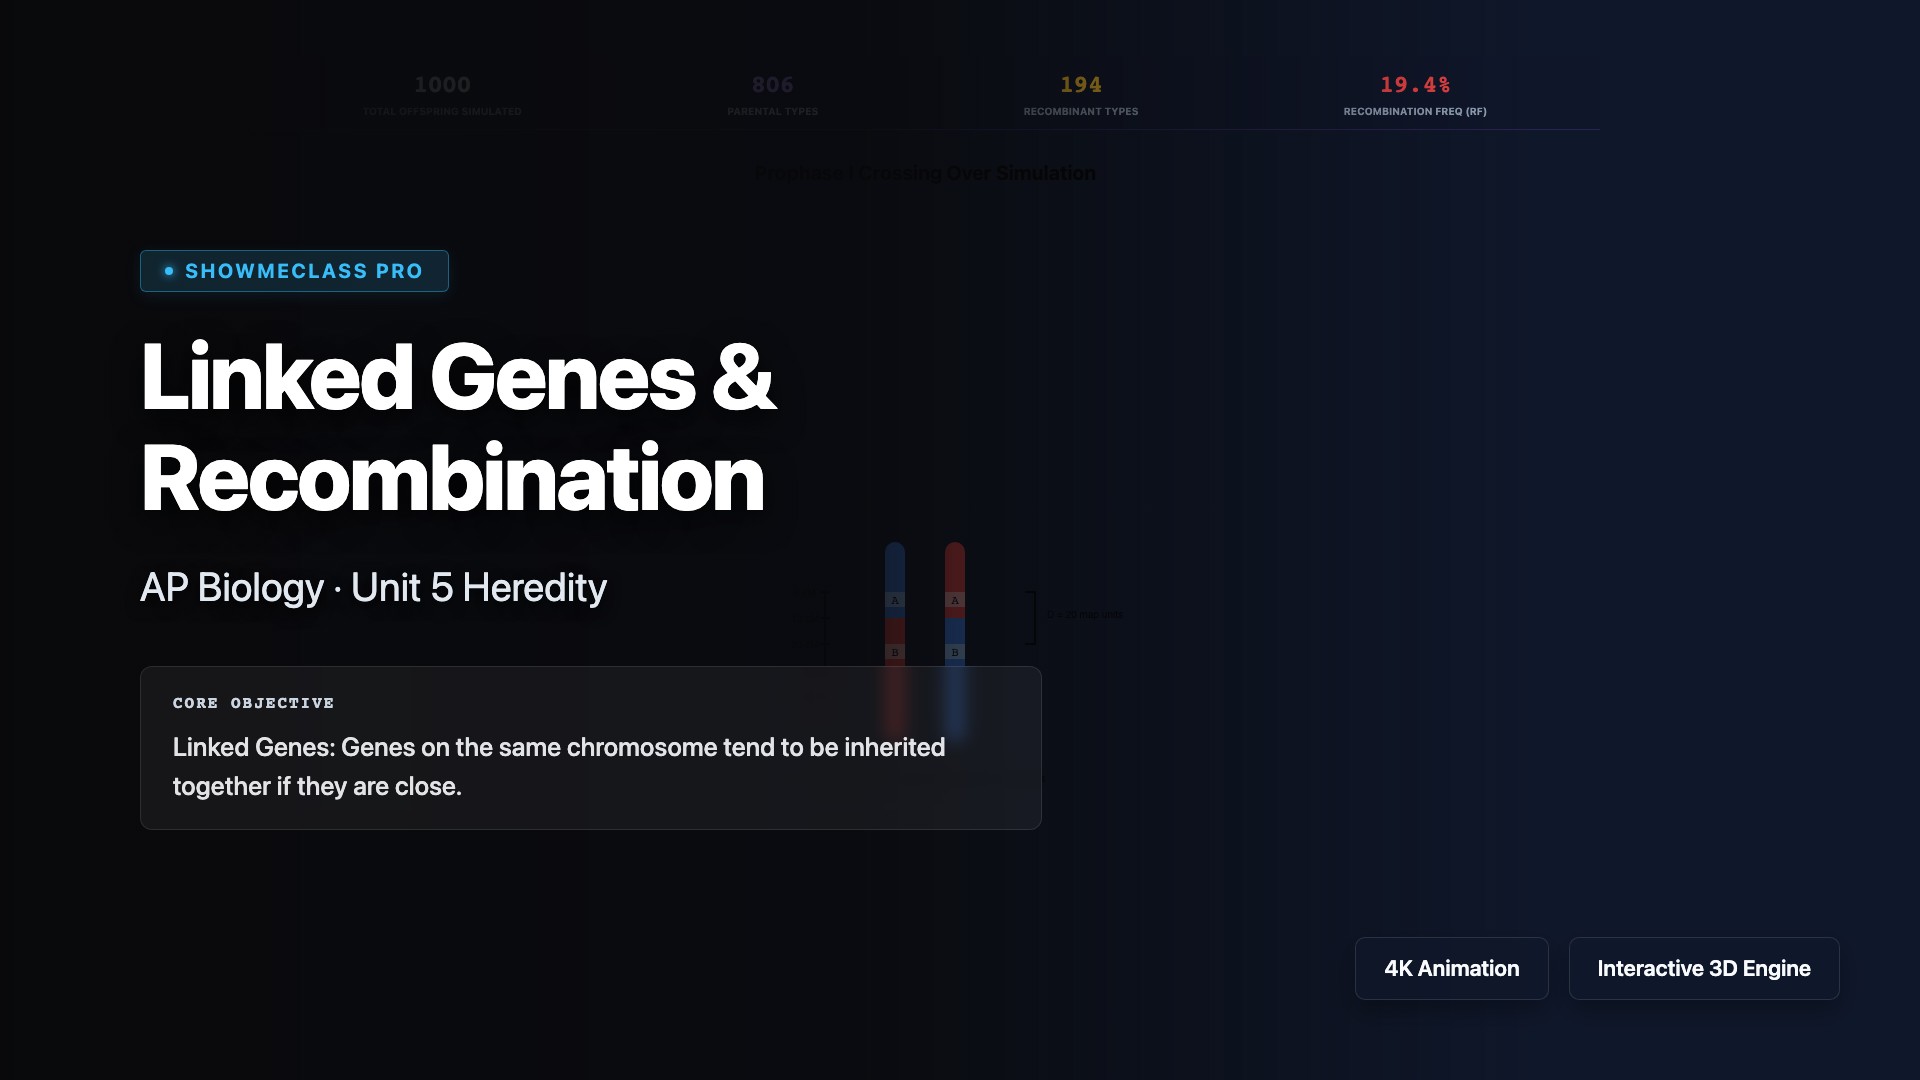
Linked Genes & Recombination
Adjust the physical map units between two genes to observe the dynamic probability of Prophase I crossing over and mathematically predict offspring Recombination Frequency.

Ribosome Translation Simulator
Step through translation: Small/Large ribosomal subunit assembly, A/P/E site tRNA translocation, peptide bond formation, and termination at a STOP codon.

Operon Regulation (Lac vs Trp)
Compare Inducible (Lac) vs Repressible (Trp) bacterial operons. Toggle inducer/corepressor presence to observe immediate repressor conformational changes and RNAP blockage.

Epigenetic Regulation
Visualize how DNA Methylation tightly coils chromatin (turning genes OFF) and Histone Acetylation loosens chromatin (turning genes ON), bypassing the underlying DNA sequence.

Speciation & Reproductive Isolation
Simulate populations diverging into distinct species by interrupting gene flow through Allopatric (Geographic River) or Sympatric (Polyploidy/Behavioral) isolating mechanisms.

Evidence for Evolution Comparator
Compare the 3 main pillars of evolutionary evidence: Stratigraphic Fossil Progression, Bone Mapping of Homologous Structures, and Cytochrome c Amino Acid divergence.

Ecological Succession Simulator
Advance a lifeless rocky landscape through Primary Succession using lichen pioneers. Trigger a catastrophic fire to demonstrate the much faster, soil-rich process of Secondary Succession.
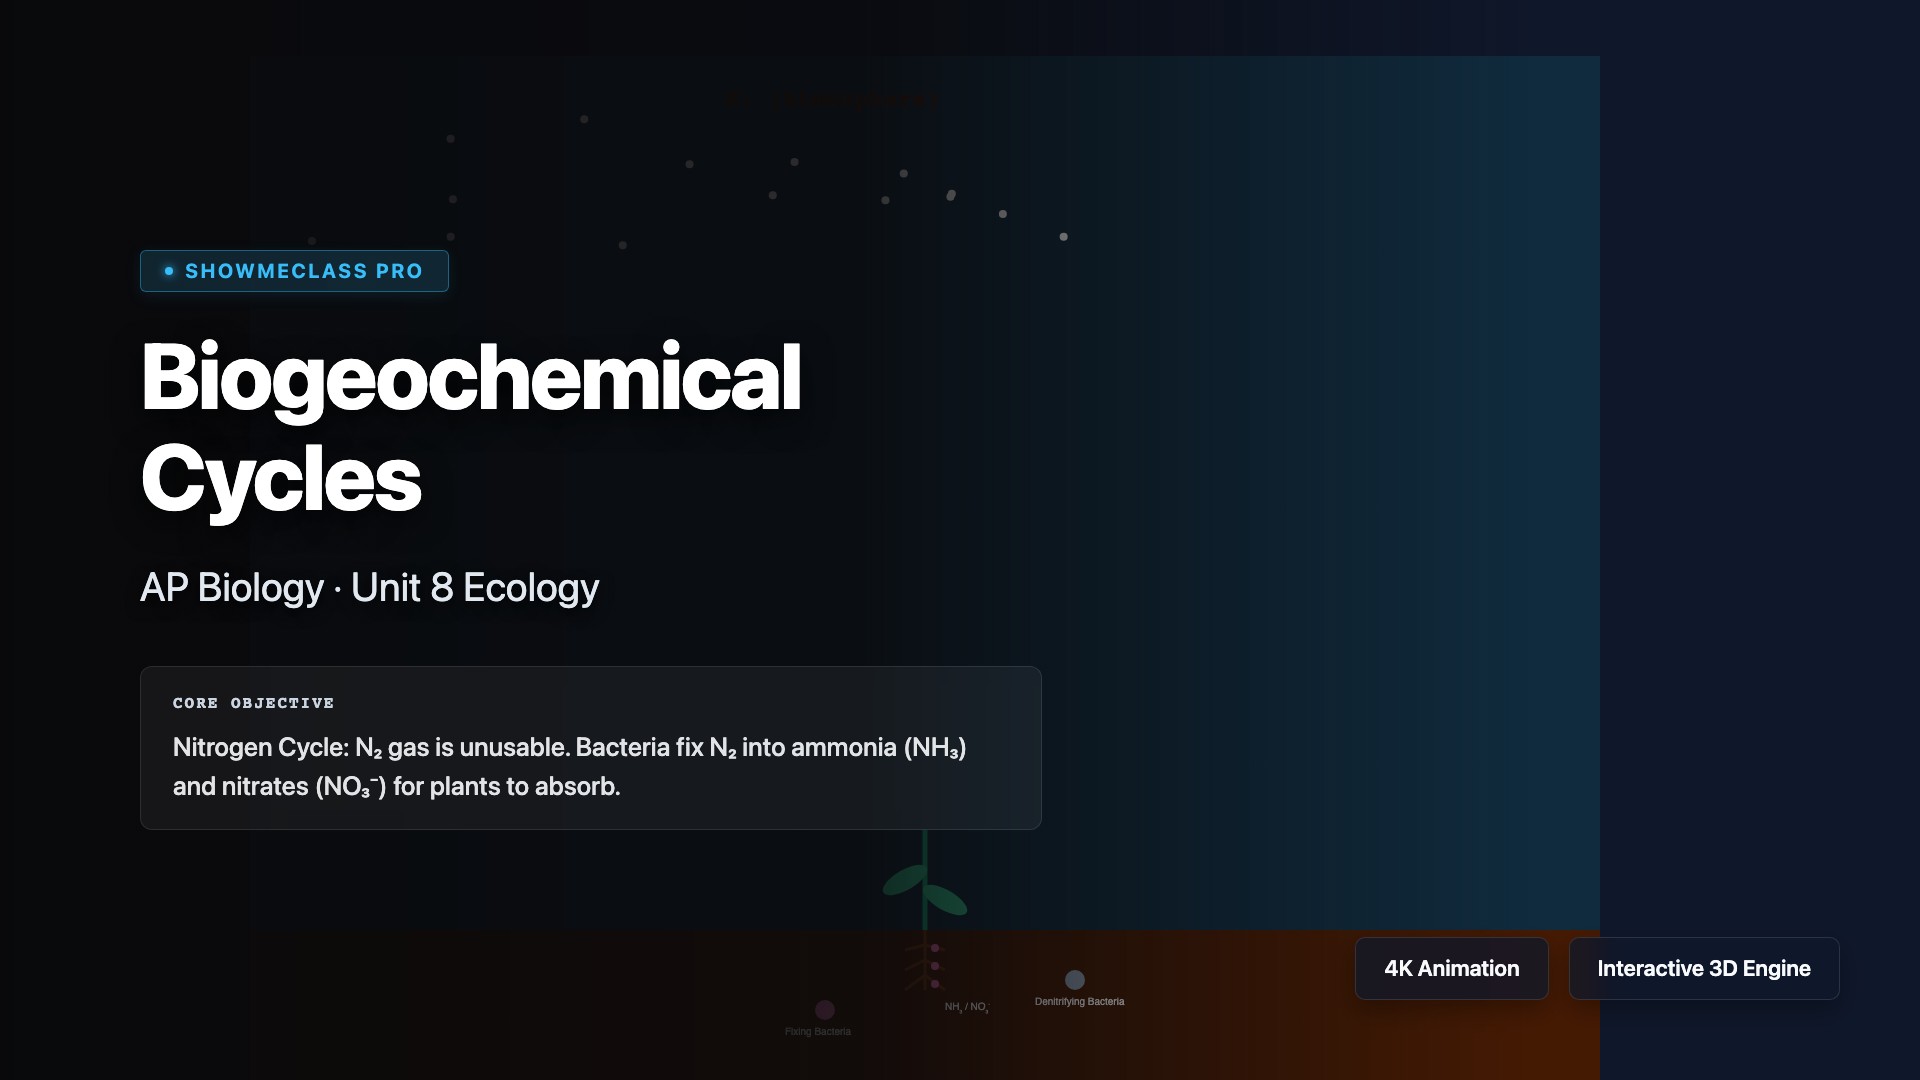
Biogeochemical Cycles (N & P)
Contrast the Nitrogen Cycle (relying entirely on root/soil bacteria to fix atmospheric N₂) against the Phosphorus Cycle (which lacks a gas phase and relies entirely on rock weathering).
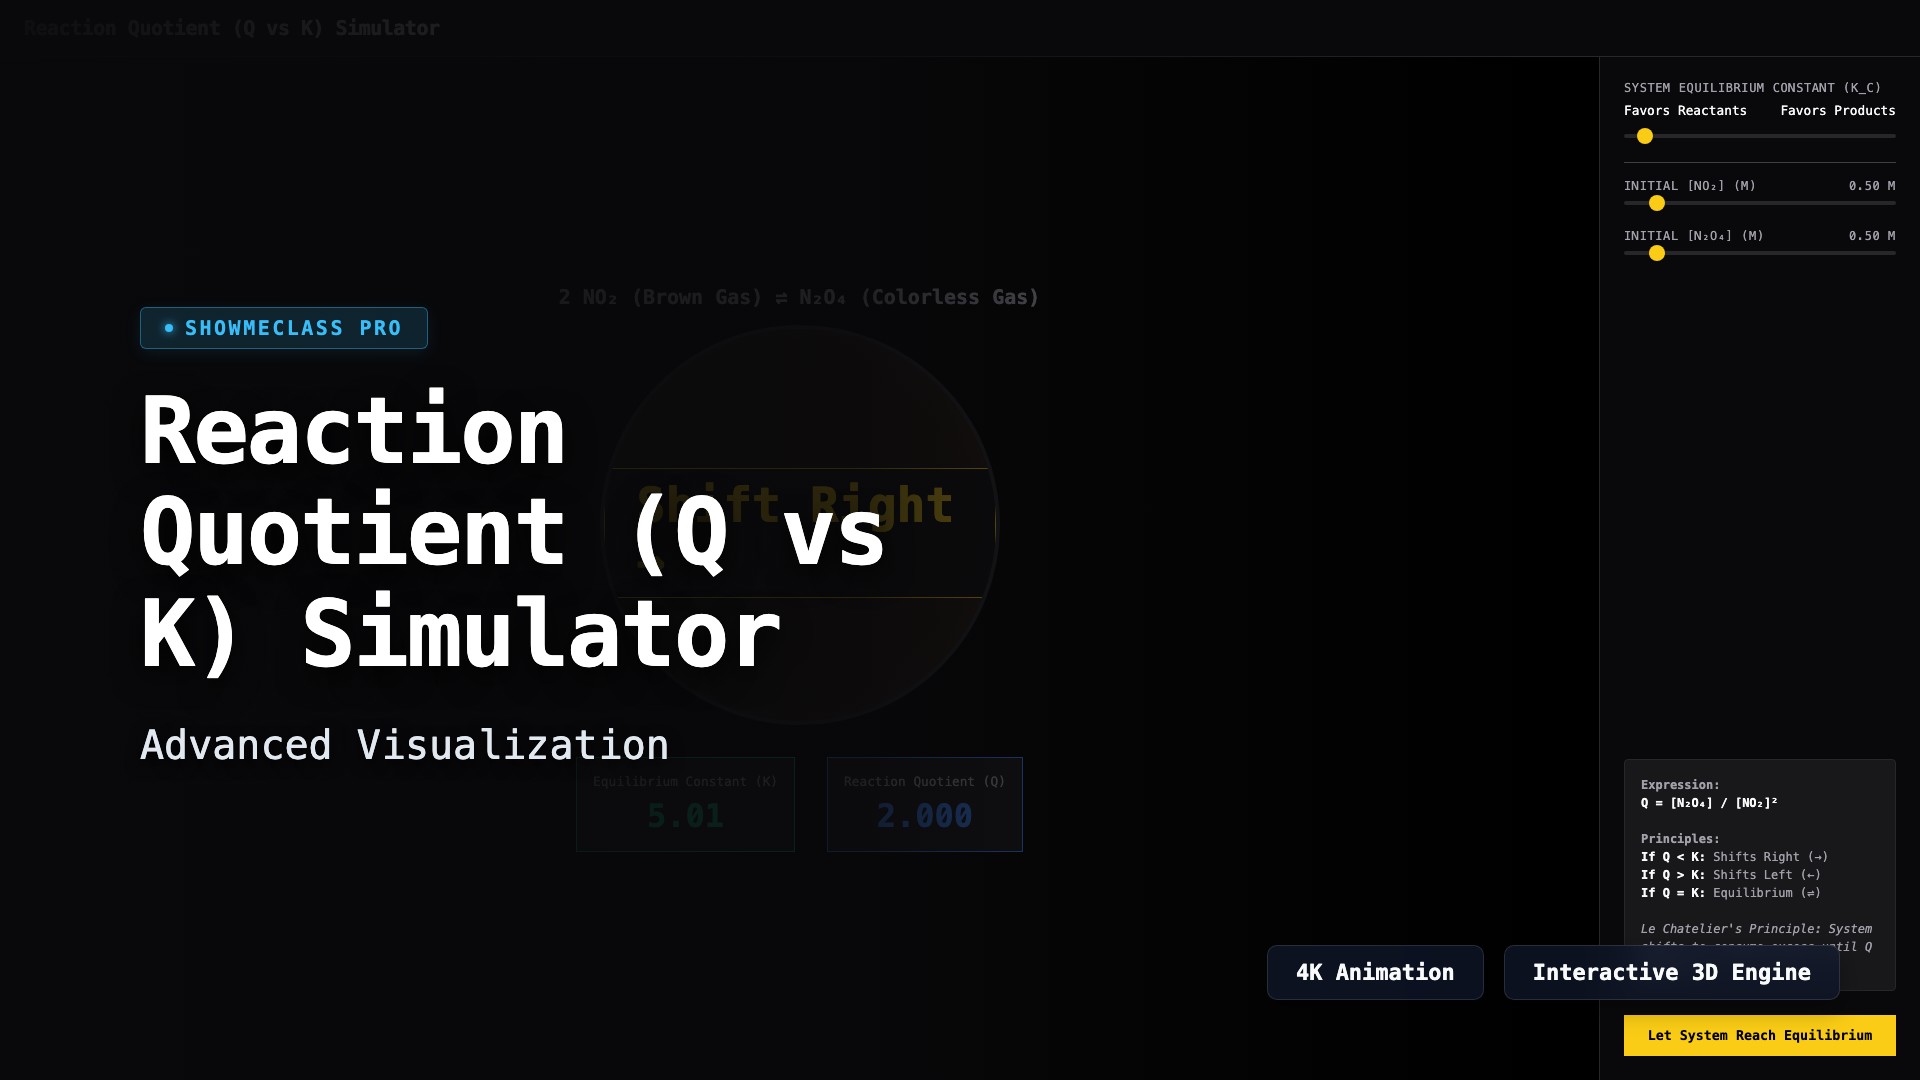
Reaction Quotient (Q vs K) Simulator
Determine the direction of equilibrium shifts using Le Chatelier's Principle. Visualize the theoretical NO2/N2O4 system and click to solve for roots to snap directly into theoretical dynamic equilibrium.

Intermolecular Forces & Phase Changes
Visually compare London Dispersion, Dipole-Dipole, and Hydrogen Bonding. Manipulate kinetic thermal energy to watch how differences in IMF strength determine exact melting and boiling point thresholds.
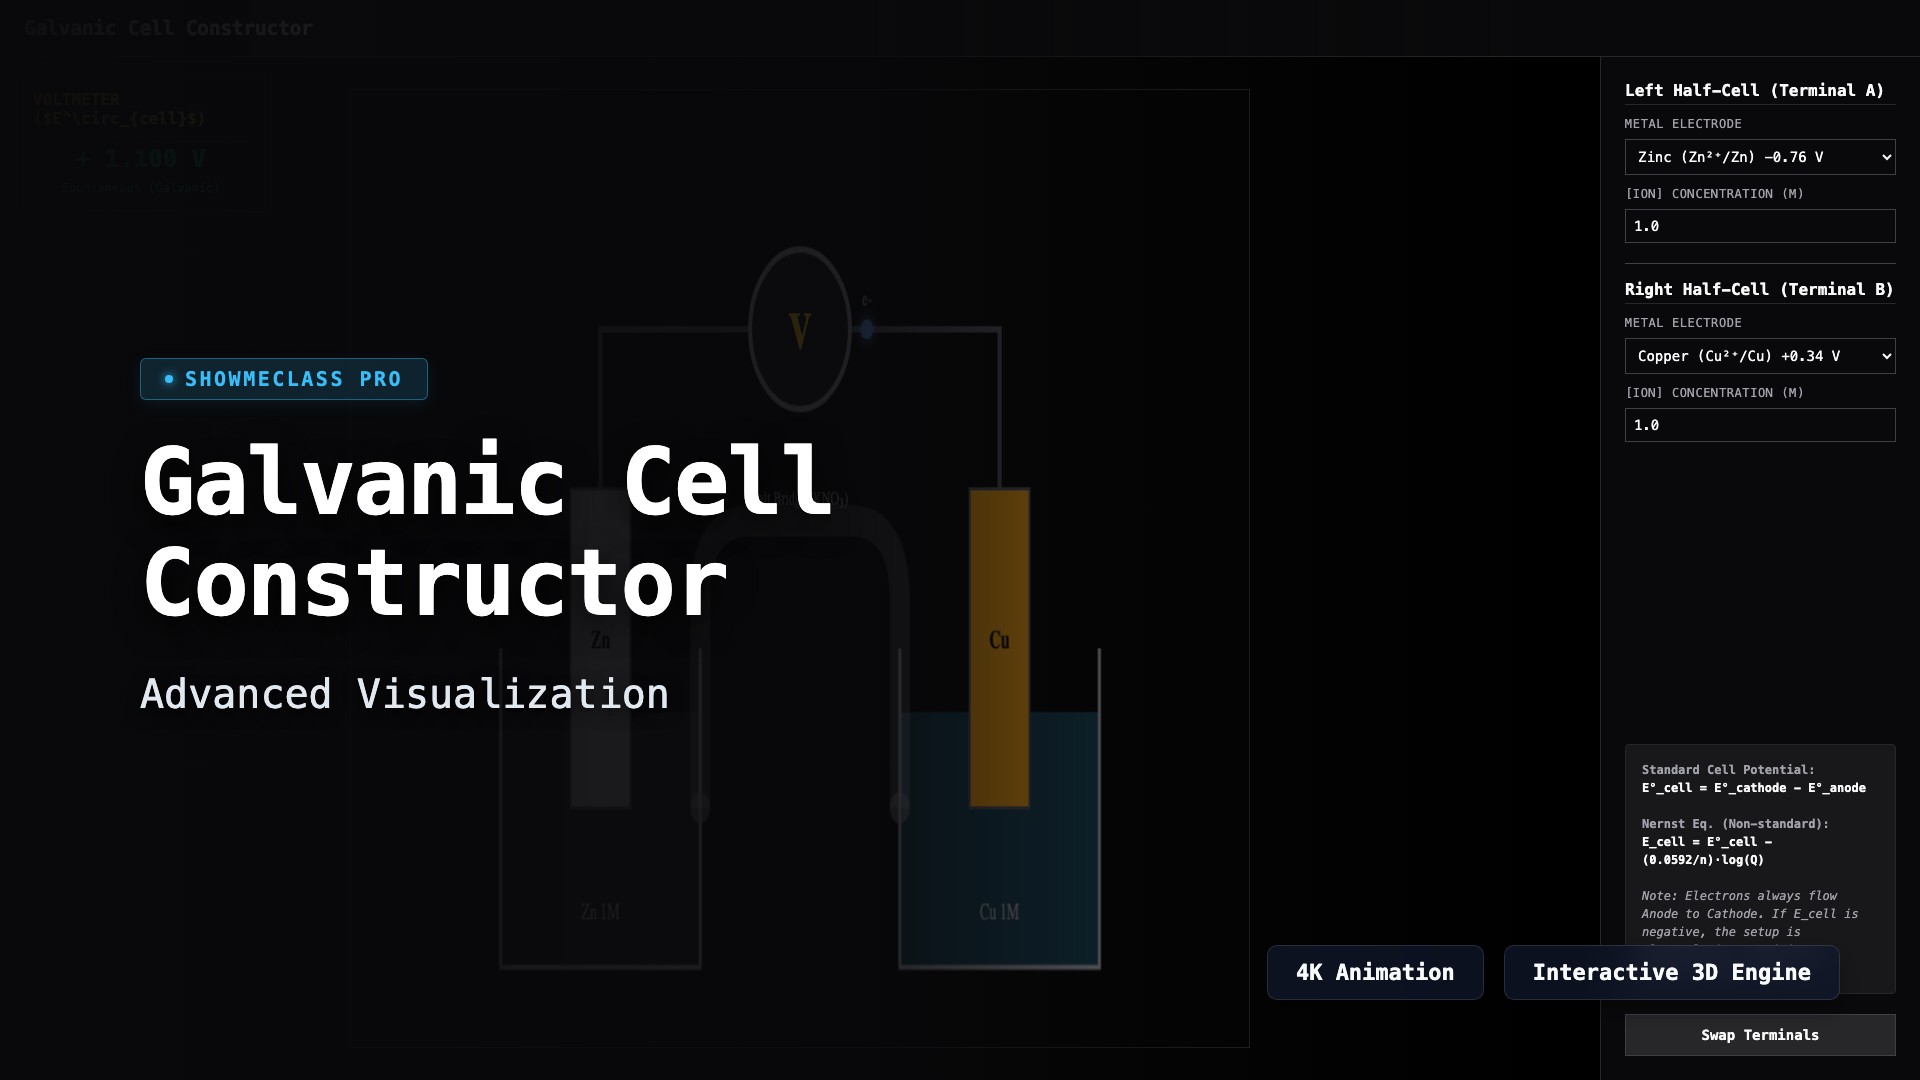
Galvanic Cell Constructor
Construct custom voltaic circuits using Zn, Cu, and Ag half-cells. The simulator utilizes real Standard Reduction Potentials and applies the Nernst Equation to calculate cell potential dynamically across varying molarities.
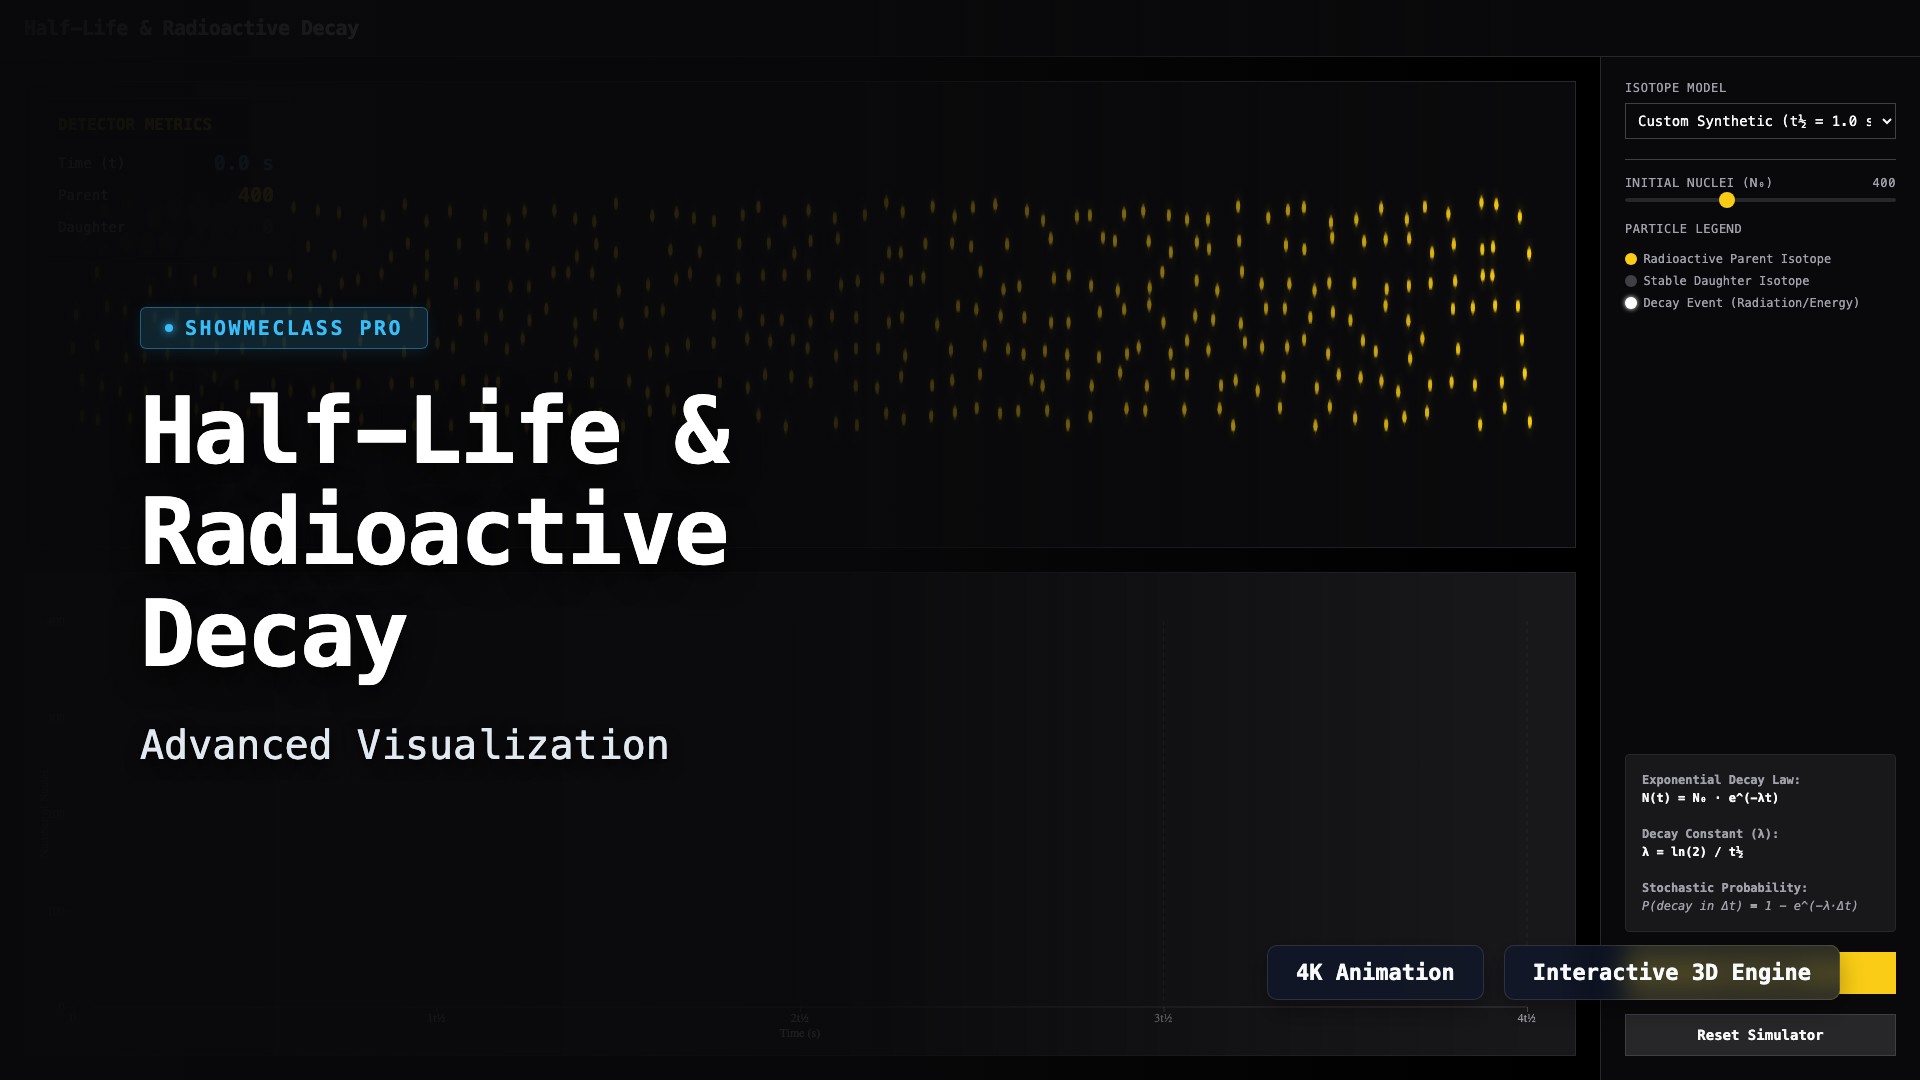
Half-Life & Radioactive Decay
Visualize stochastic exponential decay mapped against N(t) mathematical algorithms. Track Parent and Daughter isotope accumulation across customized half-lives in a real-time flashing particle engine.