Showing 12 results
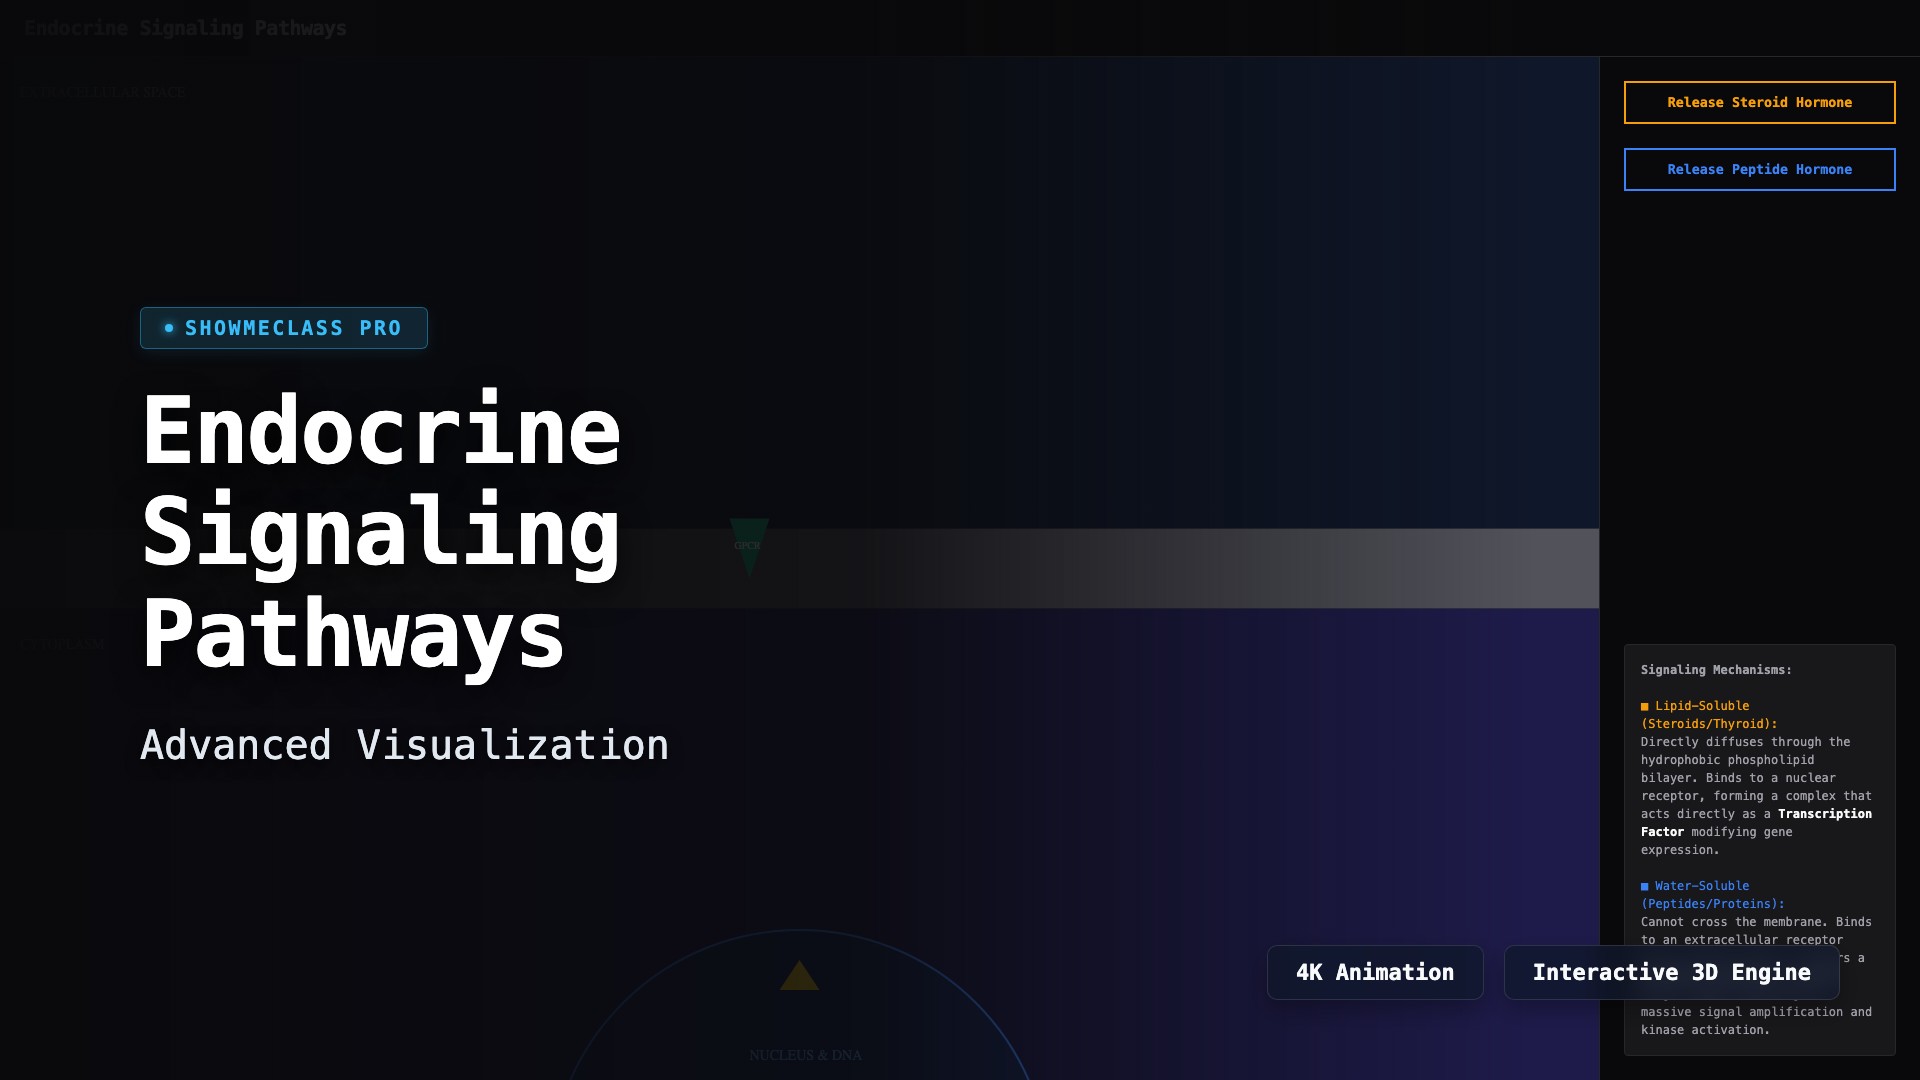
Endocrine System Signaling Pathways
Simulate hormone cell signaling. Compare lipid-soluble steroid diffusion acting as a nuclear transcription factor versus water-soluble peptide binding that triggers a massive cAMP secondary messenger cascade.
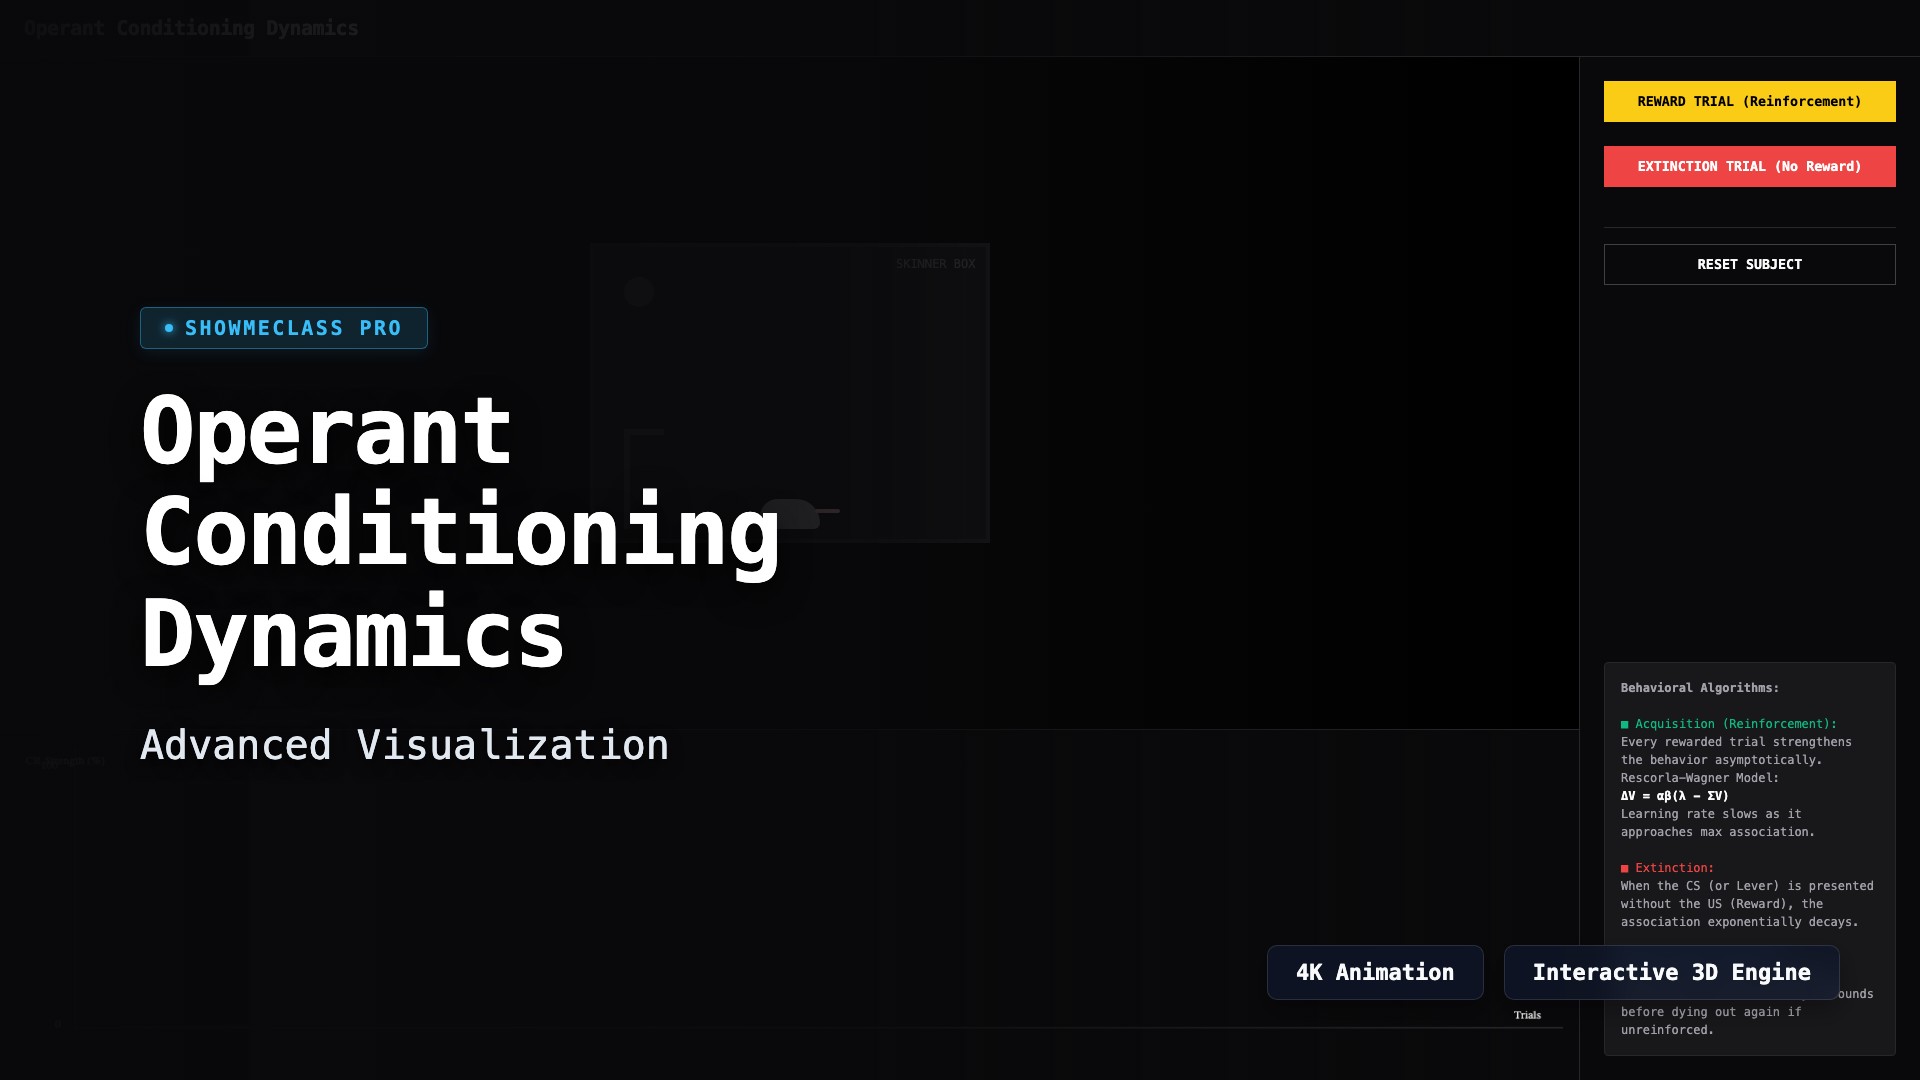
Operant vs Classical Conditioning
A cross-over behavioral simulation mapping the Rescorla-Wagner model. Execute reinforcement reward trials to plot the asymptotic acquisition curve, and trigger extinction trials to map the exponential decay in a virtual Skinner box.
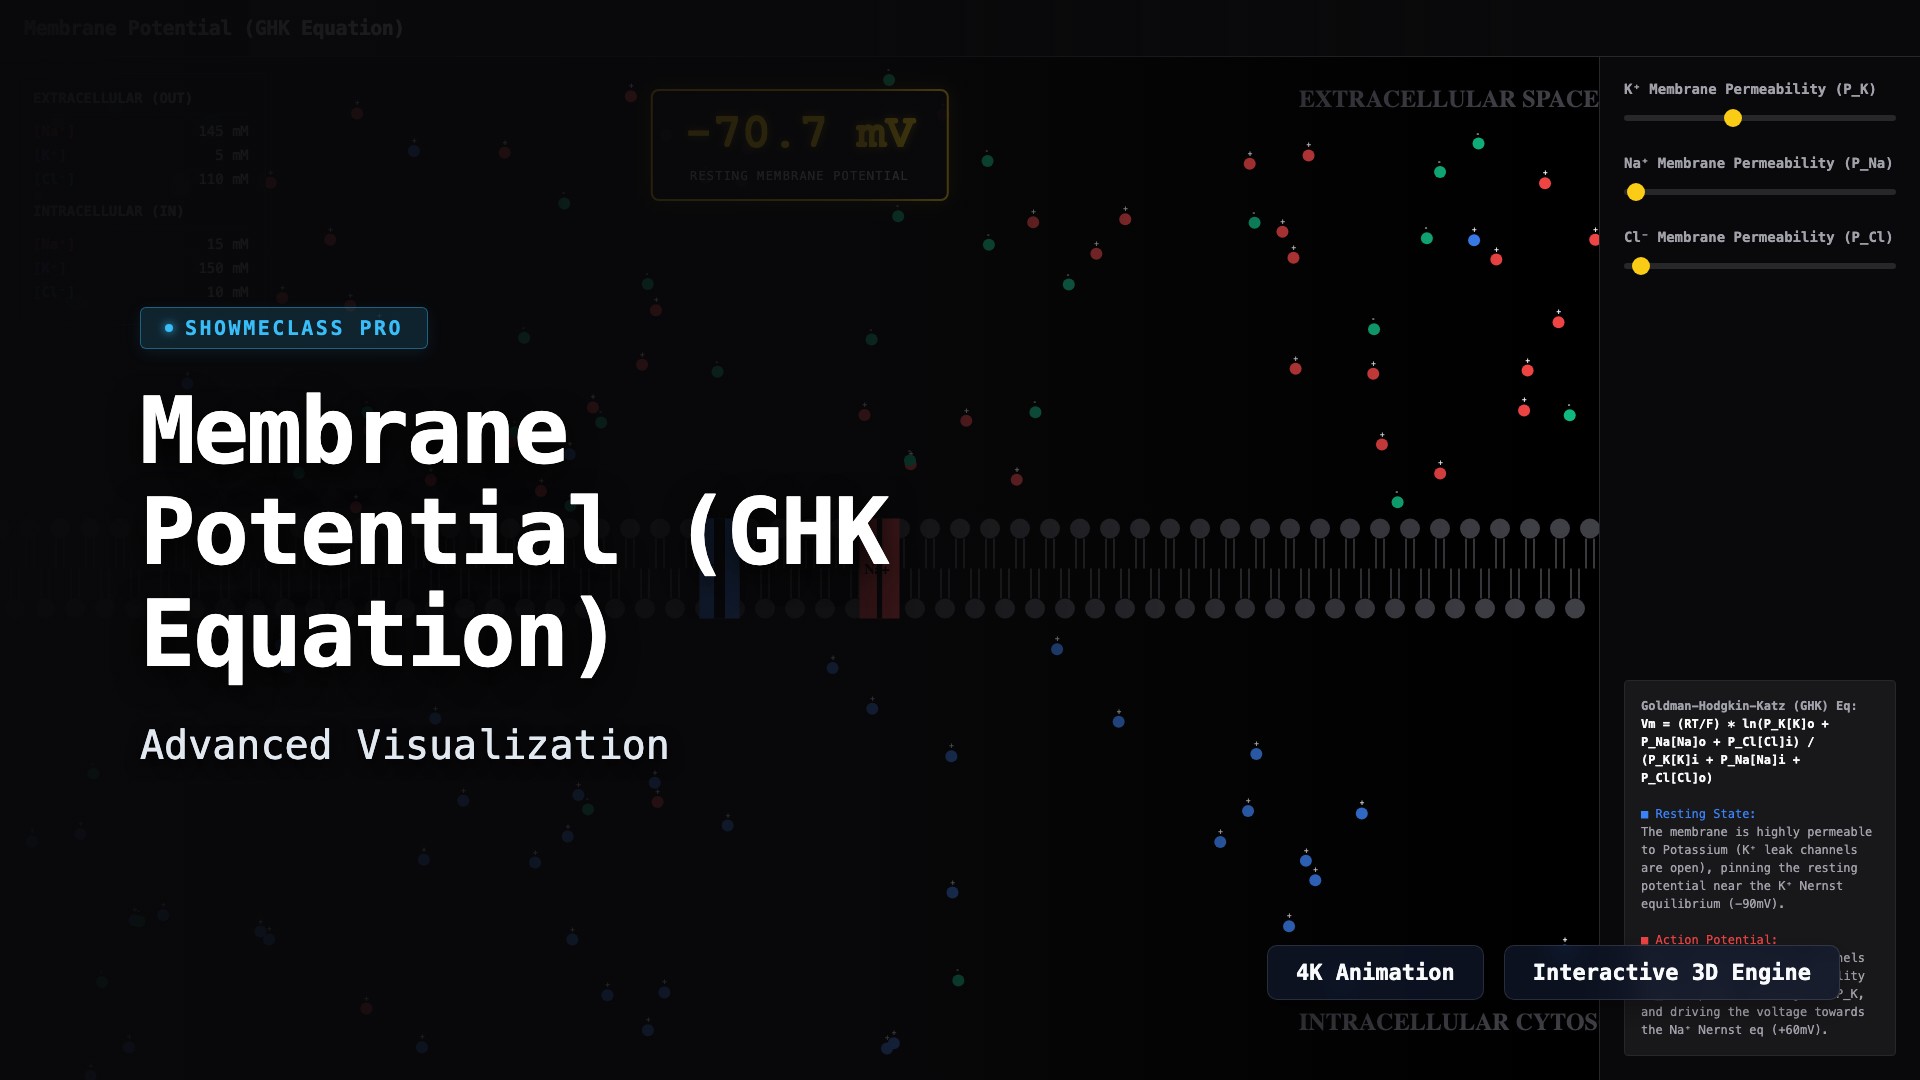
Membrane Potential & Nernst Equation
Calculate the resting membrane potential using the Goldman-Hodgkin-Katz equation. Visualize Na⁺ and K⁺ leak channels, actively tweak permeabilities, and trigger simulated action potentials.

RNA Transcription & Splicing Processing
Walk through the Central Dogma. Bind RNA Polymerase II to the promoter, elongate the pre-mRNA transcript, and execute post-transcriptional modifications including 5' Capping, Poly-A tailing, and spliceosome intron cleavage.
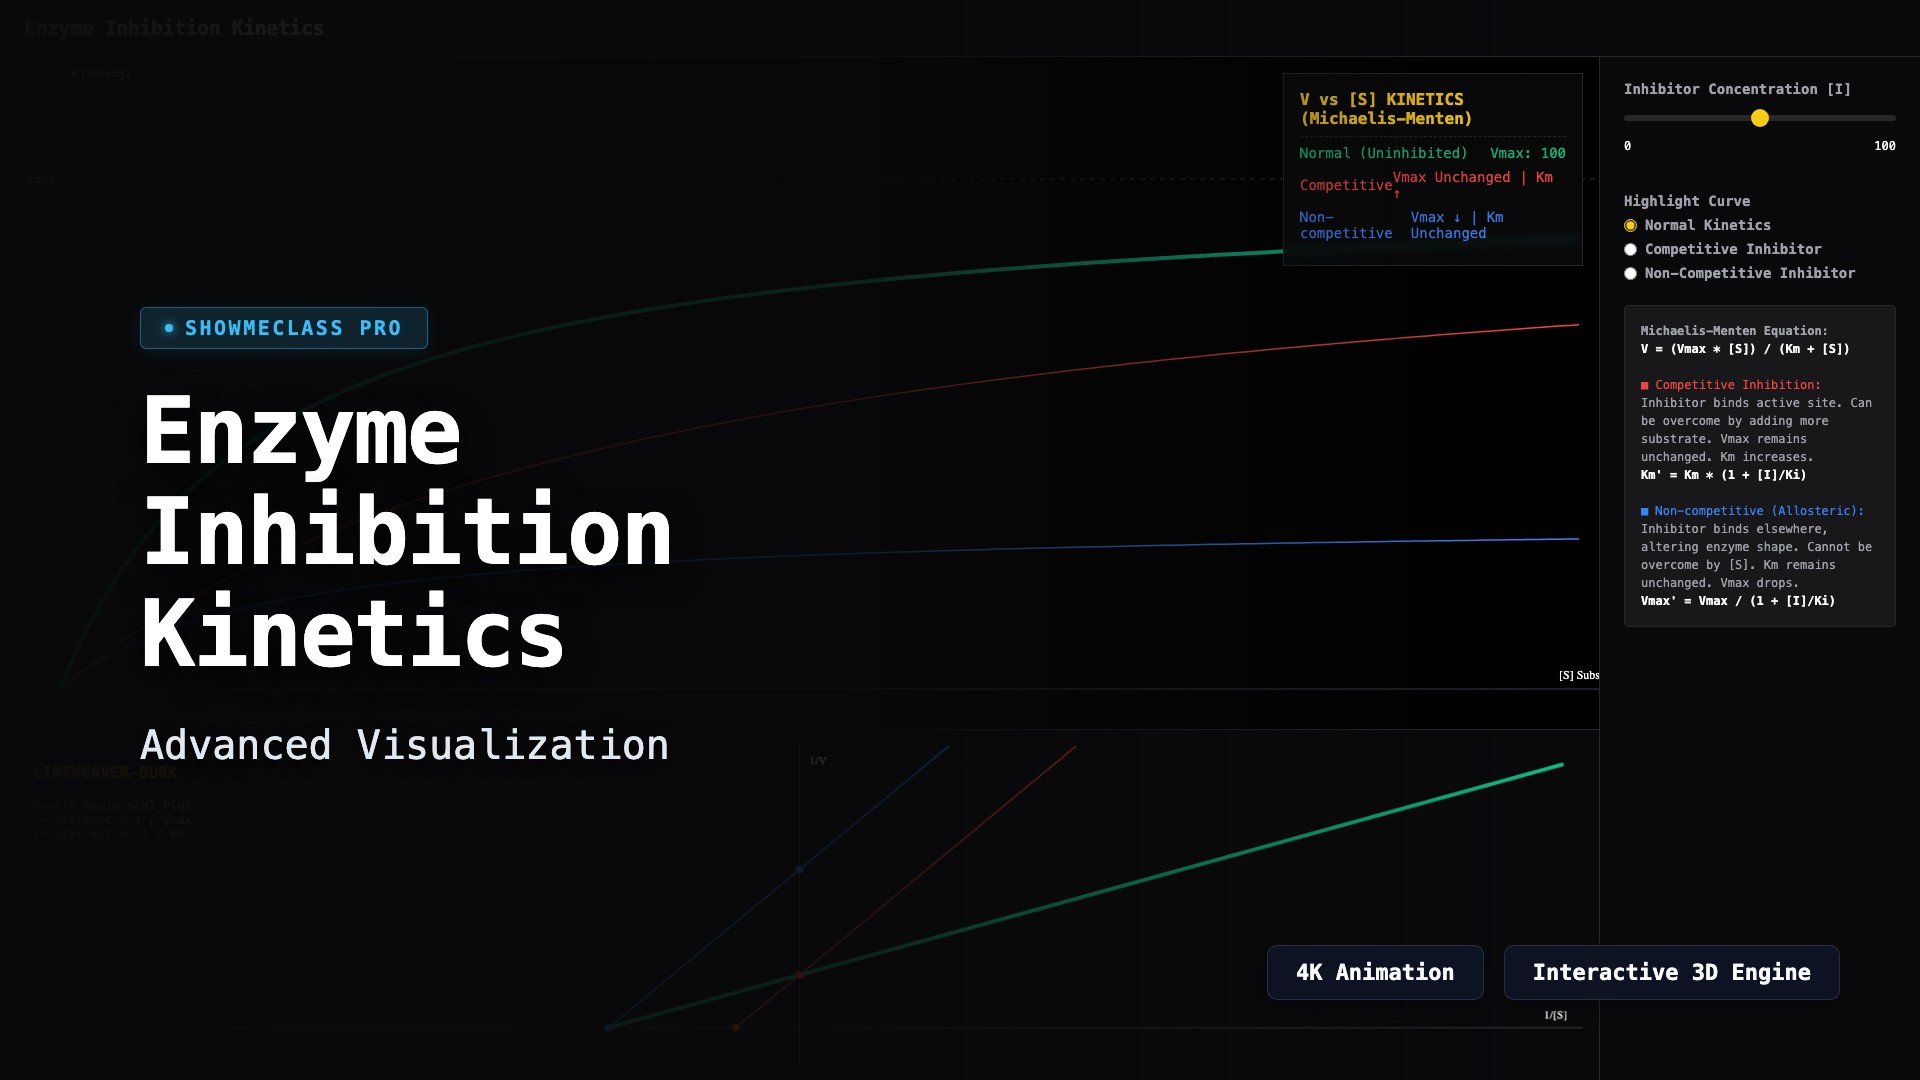
Enzyme Inhibition Kinetics
Analyze Michaelis-Menten kinetics and Lineweaver-Burk double reciprocal plots. Dynamically compare Normal, Competitive, and Non-competitive (Allosteric) inhibition by altering substrate and inhibitor concentrations.
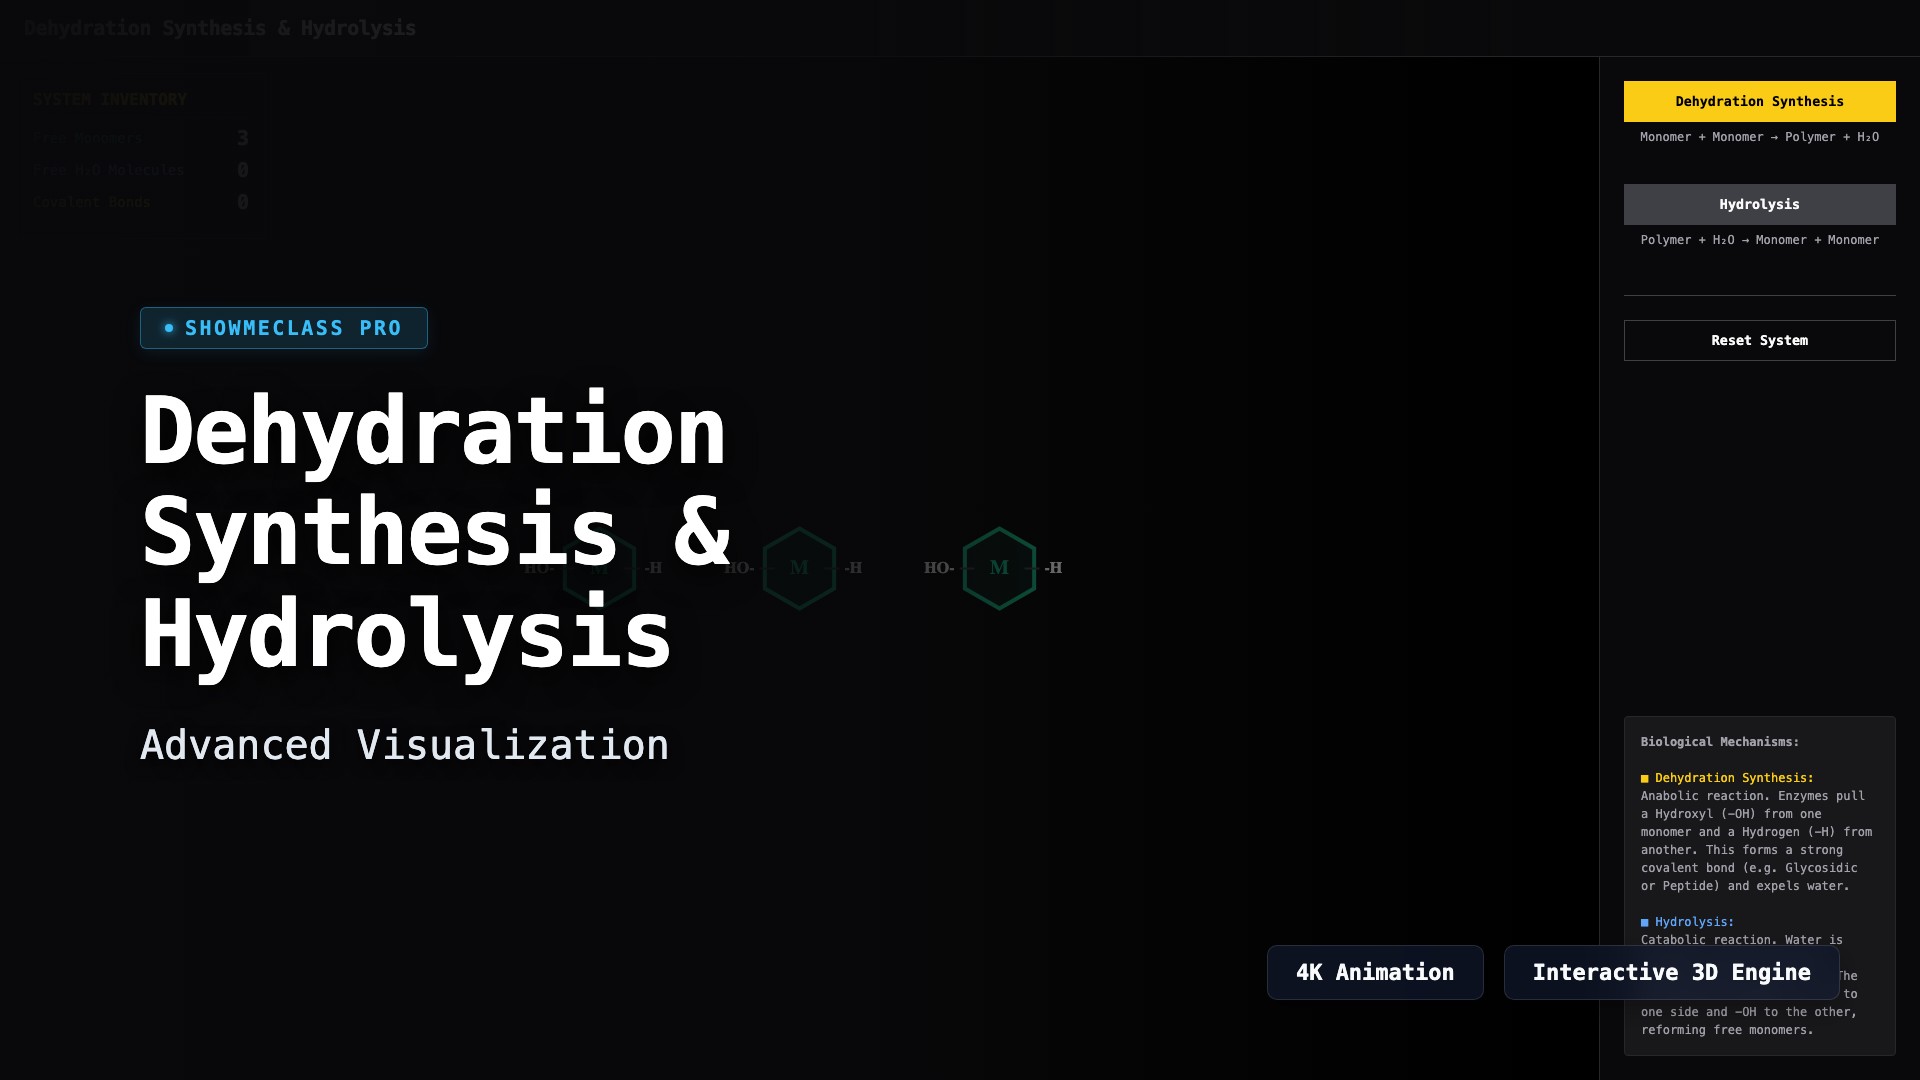
Biomolecule Dehydration Synthesis & Hydrolysis
Visualize the anabolic and catabolic mechanisms of macromolecules. Trigger Dehydration Synthesis to form covalent bonds and expel water, or inject H2O via Hydrolysis to cleave polymers back into monomers.

Immune System Clonal Selection
Simulate the Lock-and-Key mechanism of the immune system. Inject various pathogen epitopes and observe how massive clonal expansion and antibody production is triggered only when a naive B-Cell matches the exact molecular geometry.
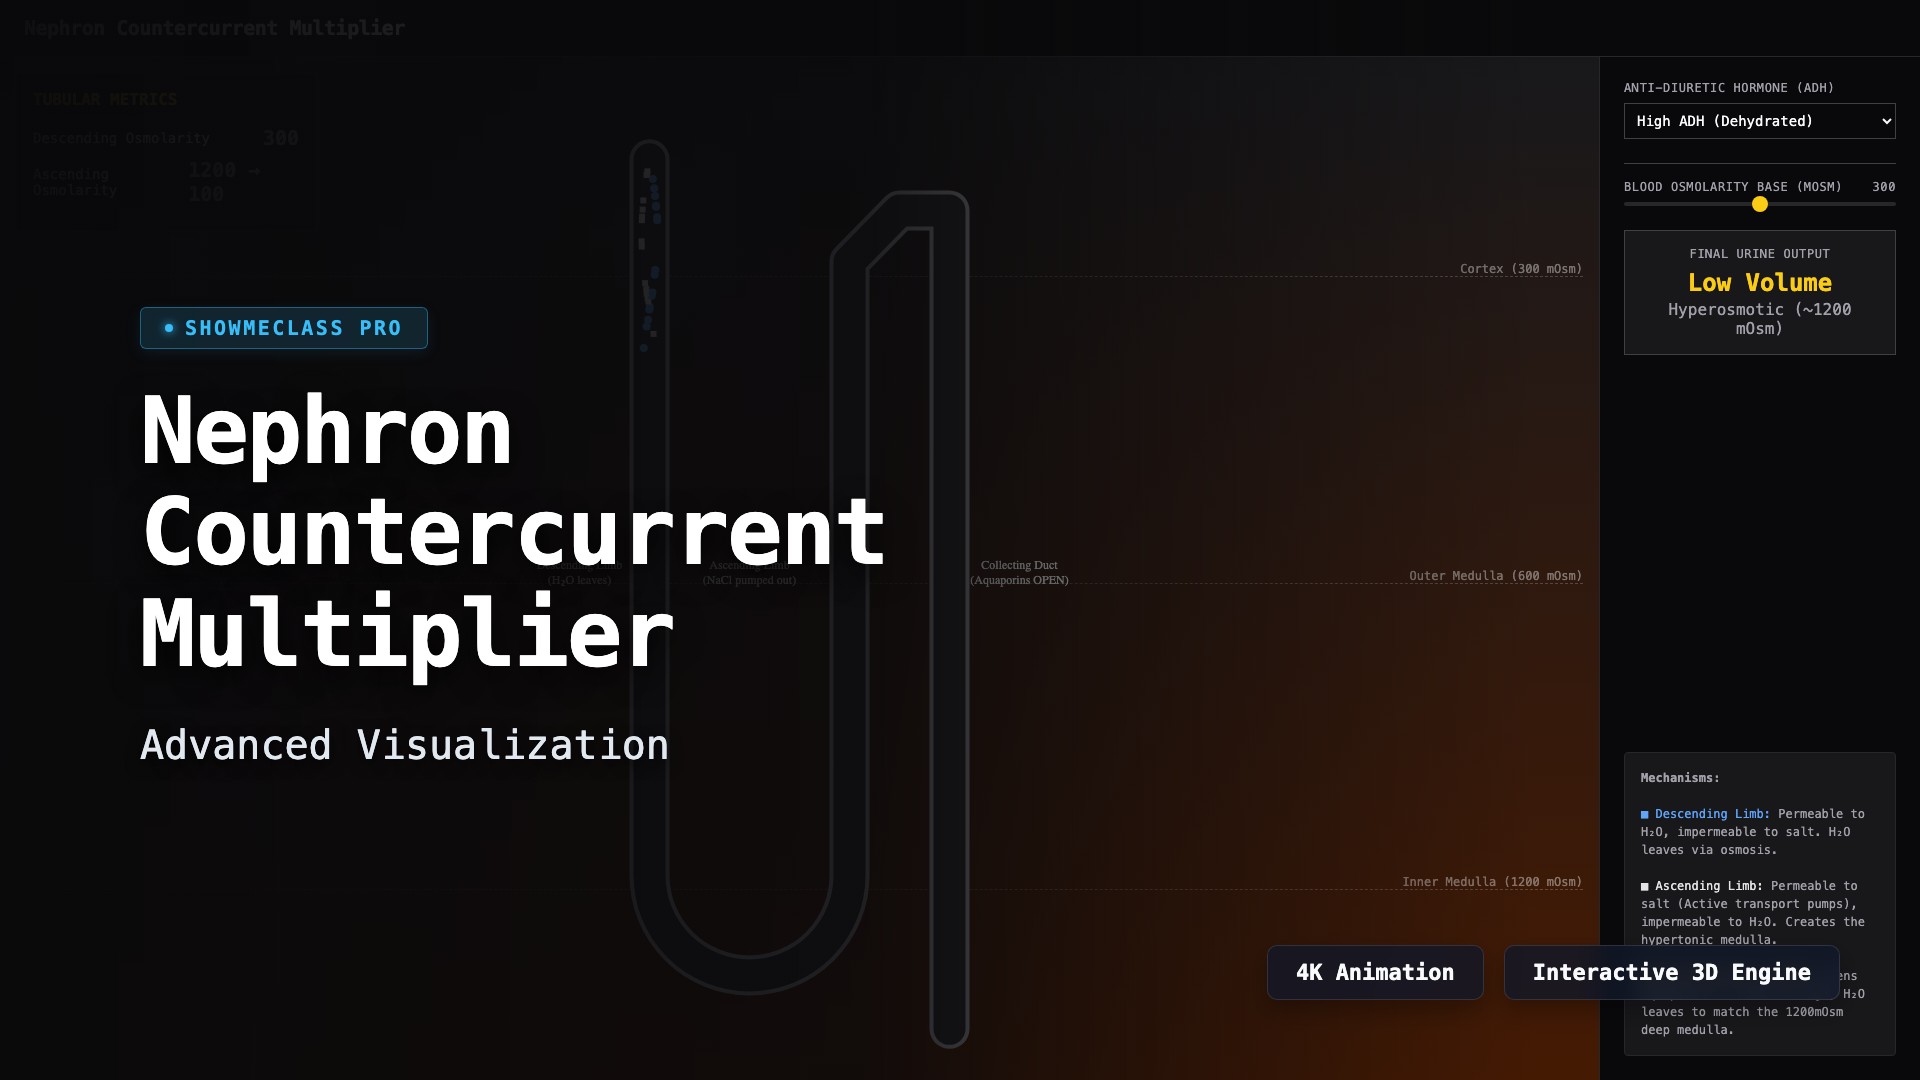
Kidney Nephron Countercurrent Multiplier
Visualize the complex osmotic gradients of the Loop of Henle. Observe how the active transport of NaCl in the ascending limb drives the passive reabsorption of H2O in the descending limb and collecting duct via ADH regulation.
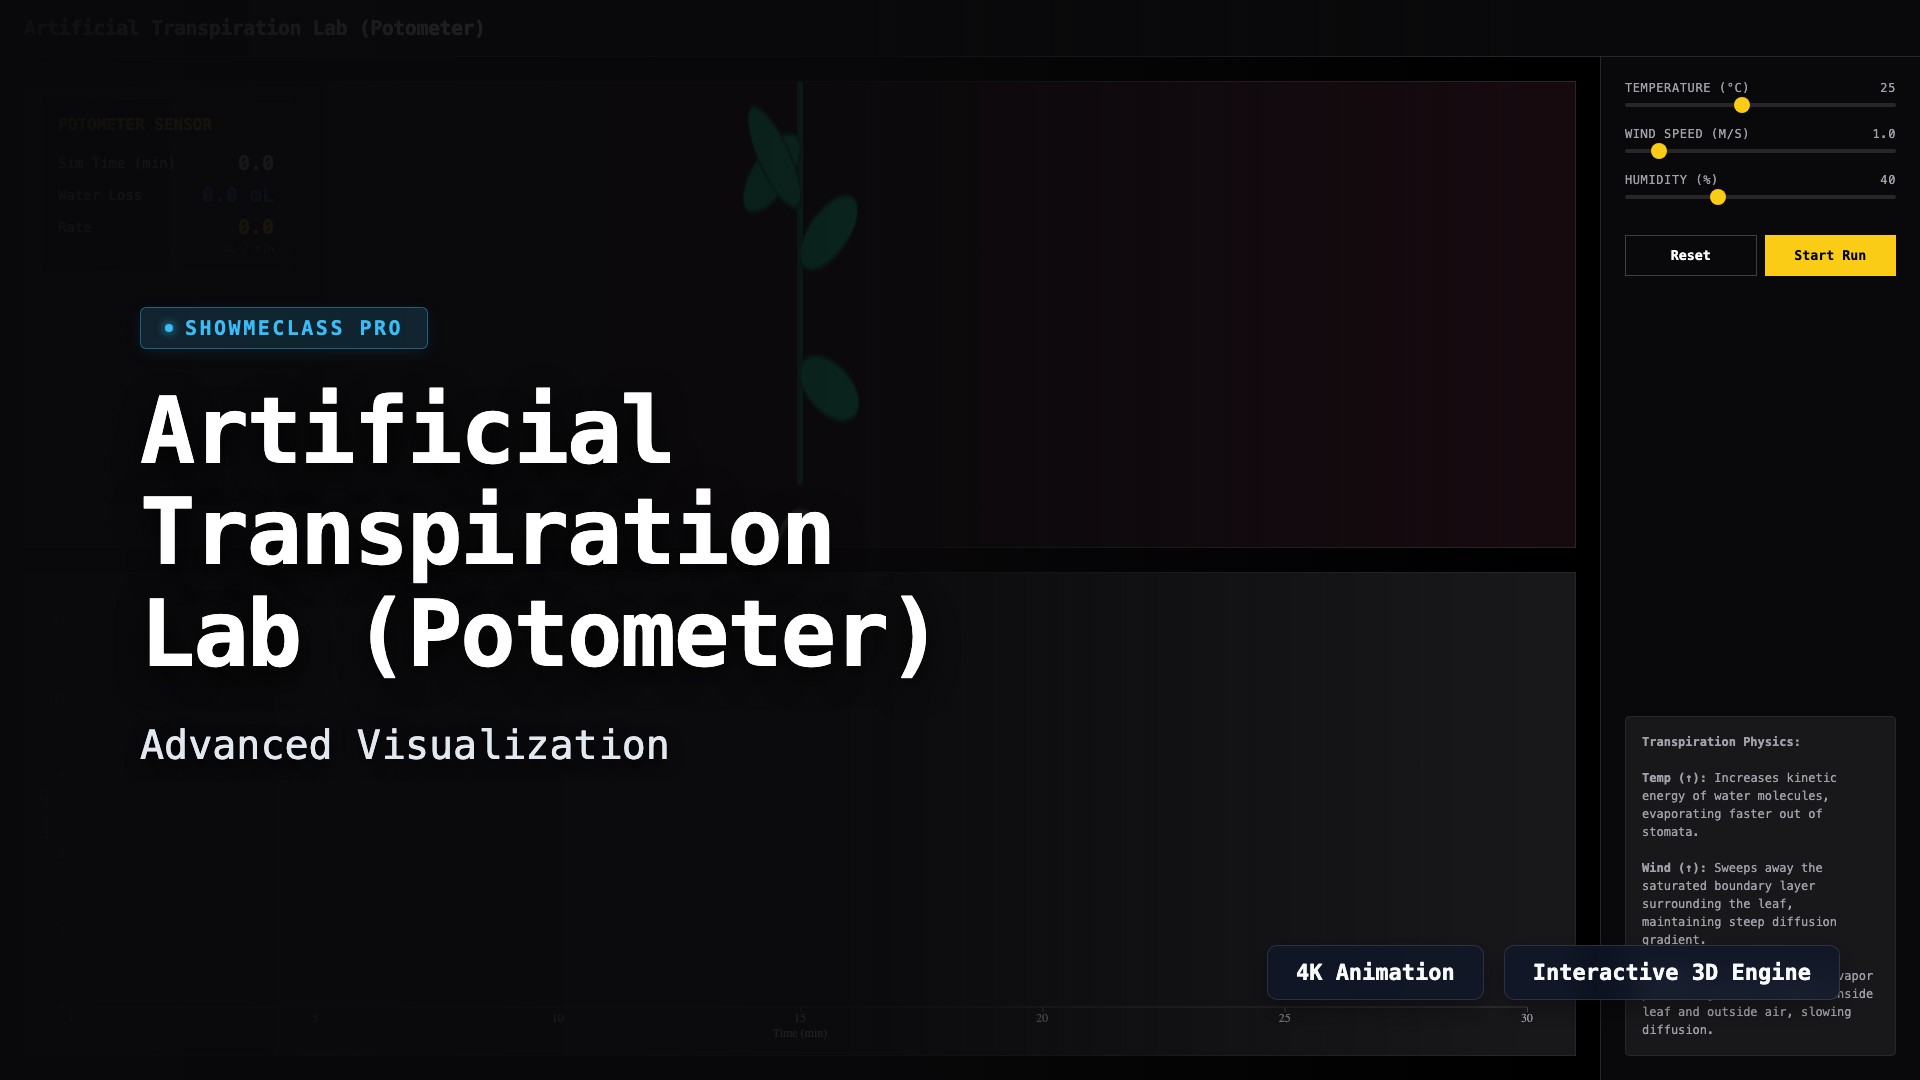
Artificial Transpiration Lab (Potometer)
Measure the rate of water loss in a simulated plant cutting using a virtual potometer. Adjust environmental physics variables including Temperature, Wind Speed, and Humidity to determine their exact multiplicative effects on evaporation.
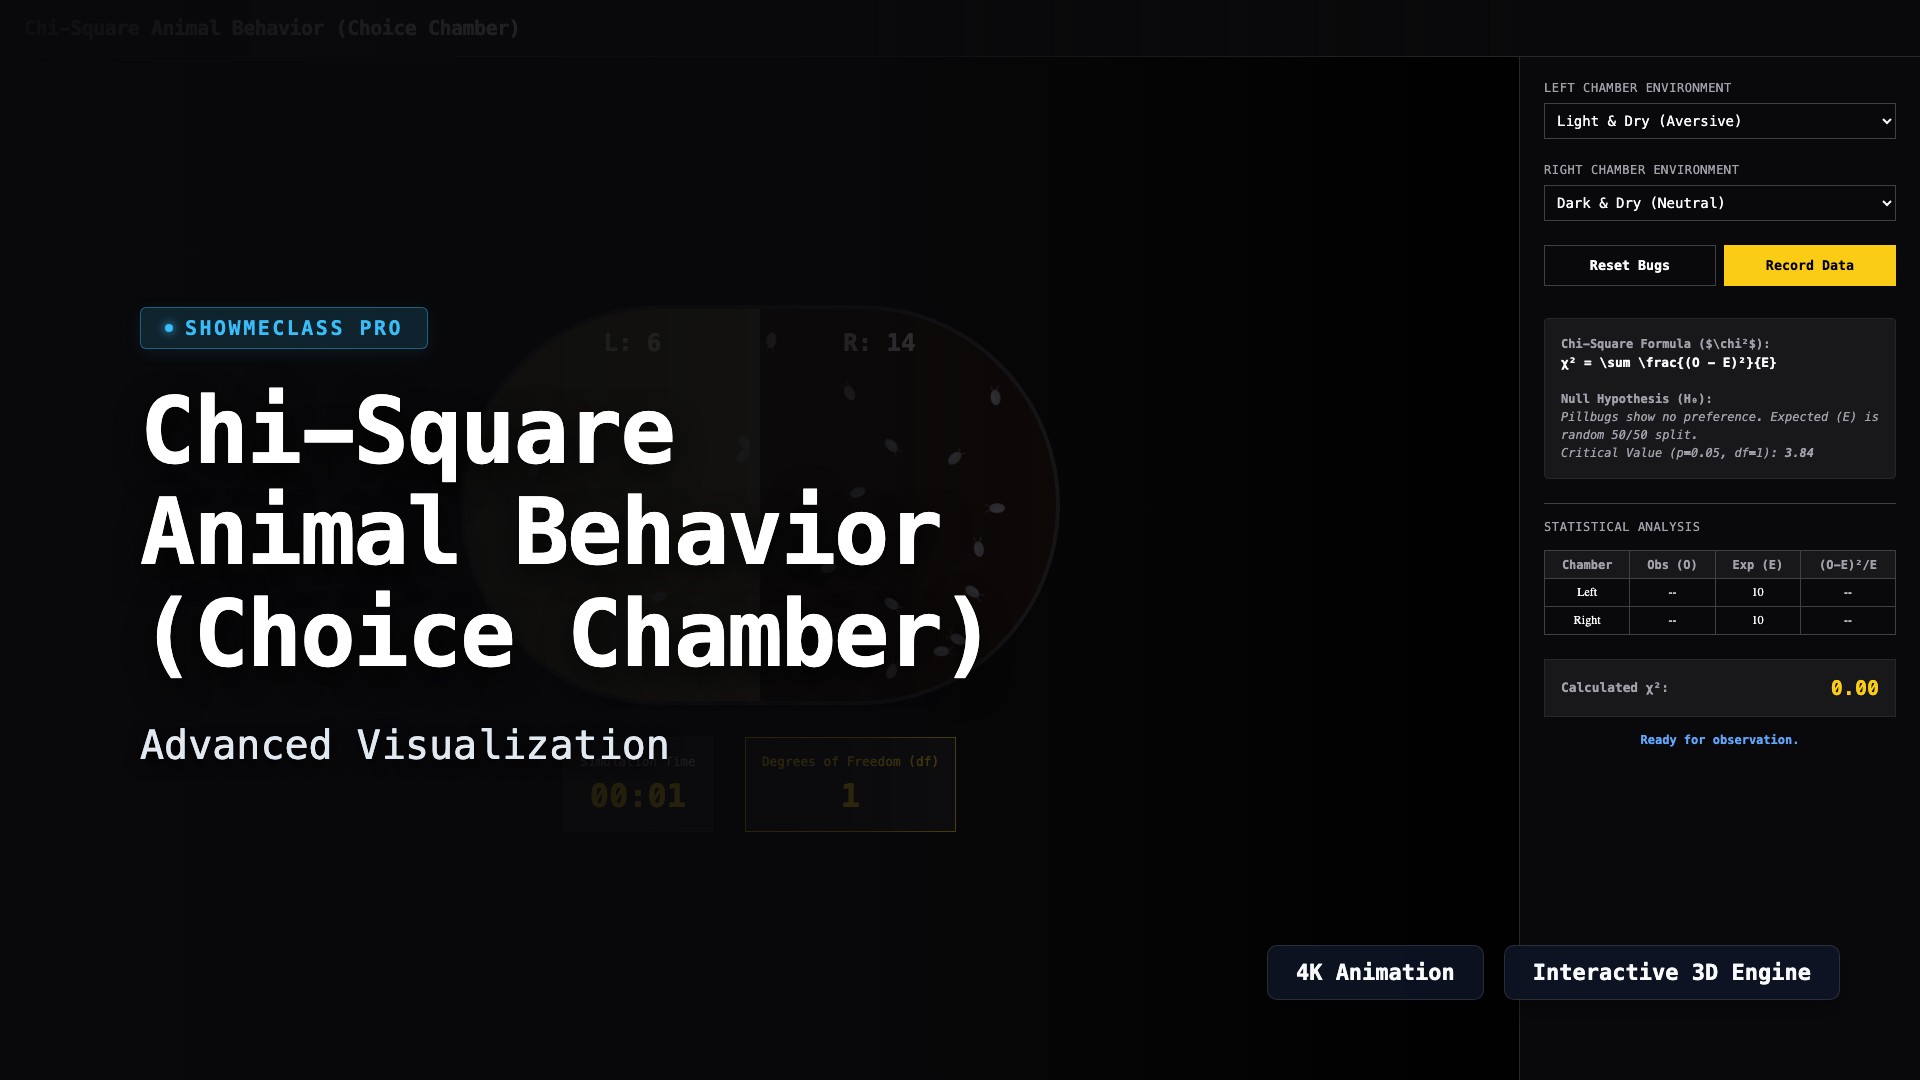
Chi-Square Animal Behavior (Choice Chamber)
Simulate pillbug movement across varying environmental conditions (Light/Dark, Dry/Wet). Record real-time location data and dynamically calculate the Chi-Square (χ²) statistic to reject or fail to reject the null hypothesis of random distribution.
Water Properties & Hydrogen Bonding
Interactive water molecule simulator demonstrating polarity, hydrogen bonding networks, and temperature effects acting as solvent shells around NaCl ions.
Macromolecule Structure Comparator
Compare the 2D SVG molecular structures of Carbohydrates, Lipids, Proteins, and Nucleic Acids. Identify key elements and monomers.