Showing 12 results

Central Limit Theorem (Galton)
Drop dynamic particles through a physics-enabled Galton Board. Watch the Binomial Distribution organically construct and flawlessly approximate a continuous Normal Curve.

Simpson's Paradox Visualizer
Examine confounding variables dynamically. Toggle between global and clustered regression data to observe mathematical trends magically reverse polarity (Pearson r) when separated.
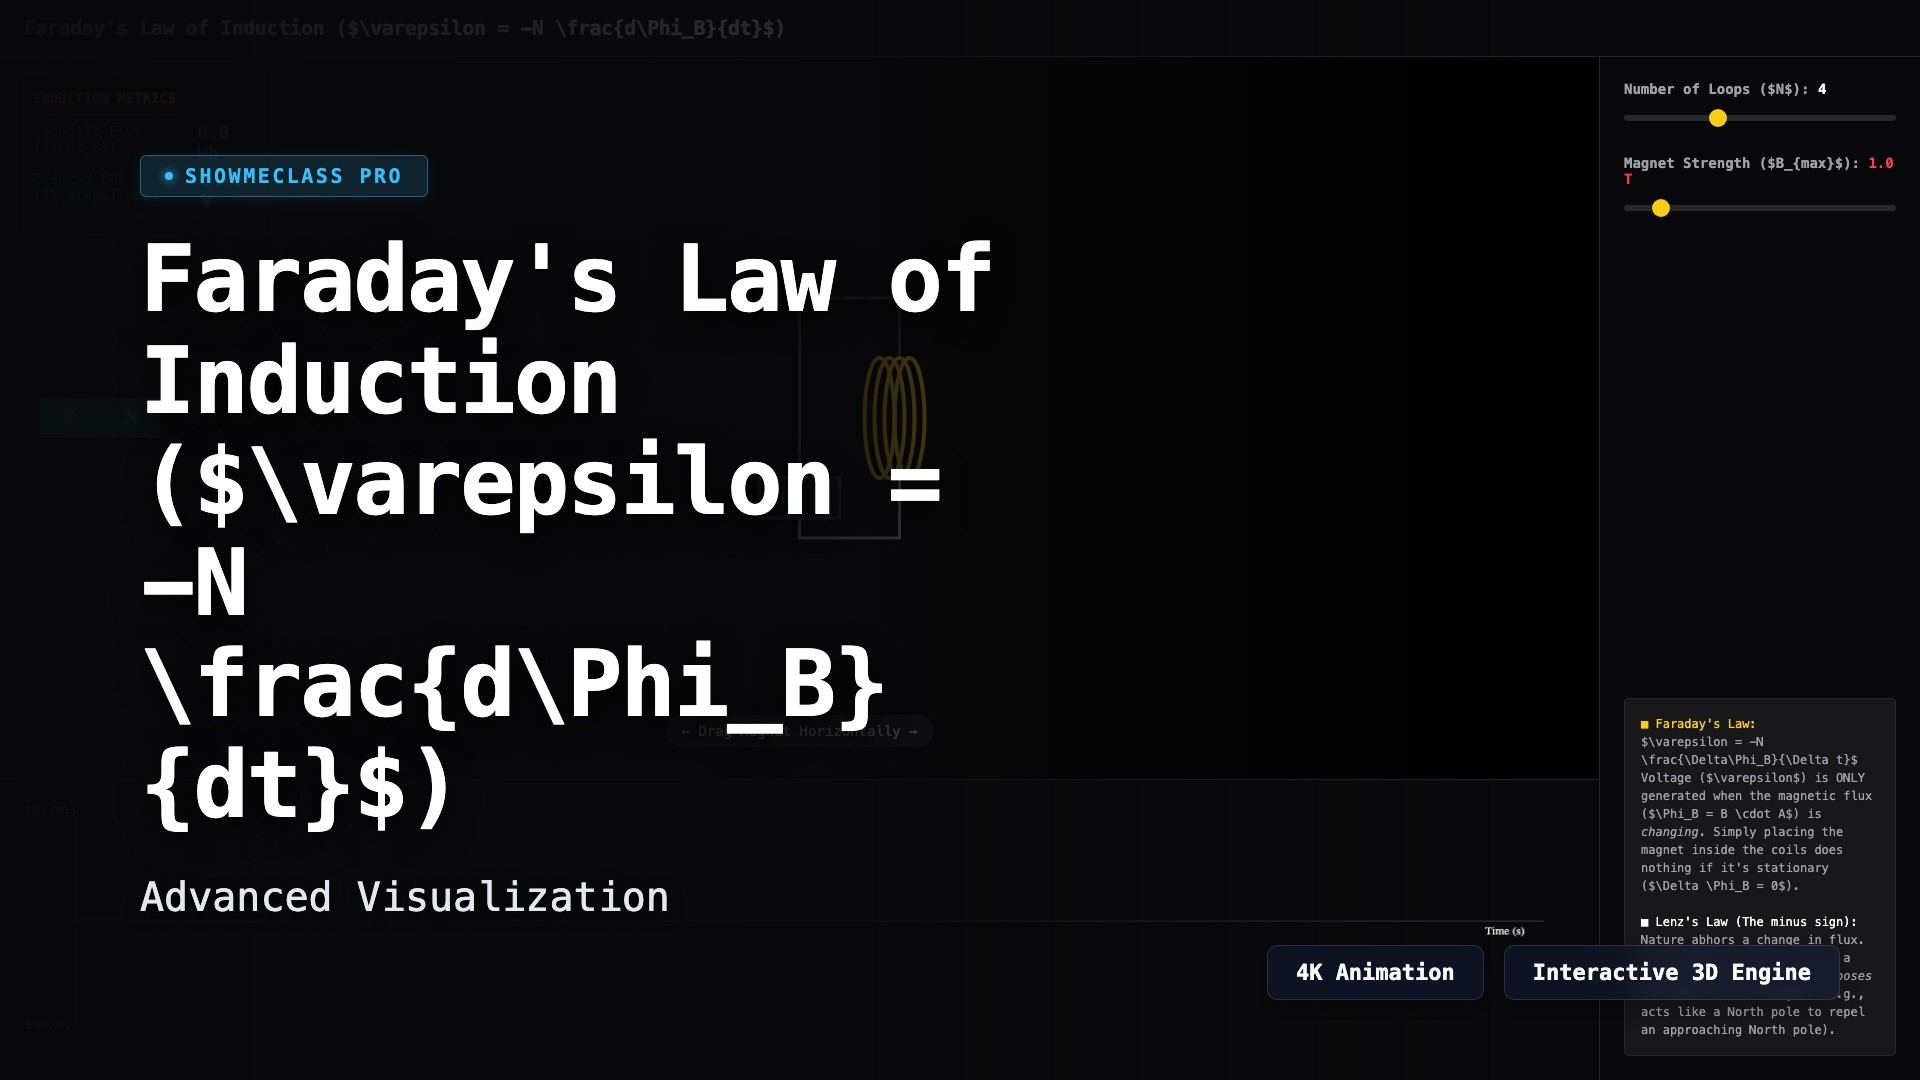
Magnetic Flux & Faraday/Lenz's Law
Visualize Maxwell's equations in action. Drag a permanent magnet through an Amperian coil and observe how dΦ/dt directly induces an opposing EMF spike dictated by Lenz's Law.

Ampere's Law Solenoid Constructor
Construct an ideal solenoid and visualize the uniform internal magnetic field utilizing Ampere's Law. Adjust current I, solenoid length L, and turn count N to map B-field intensity.

Hall Effect Sensor Lab
Inject current through a conducting slab placed in a transverse magnetic field to visualize the buildup of charge on the edges, generating the measuarble, transverse Hall Voltage.

RC Circuit Transient Response
Analyze the asymptotic decay curves of isolated RC Circuits. Switch between charging and discharging phases to plot Voltage and Current dynamically against the Time Constant (τ = RC).

Capacitors with Dielectric Insertion
Visualize how pushing a dielectric constant (K) between parallel plates dynamically shifts Capacitance, Charge, Voltage, stored Energy (U), and E-Field intensity. Compare connected vs isolated scenarios.

Lorentz Force 3D Particle Accelerator
Fire charged particles into a uniform magnetic field. Visualize cyclotronic motion derived from the cross product F = q(v × B) and measure the resulting orbital radius based on mass, velocity, and charge.

Simple vs Physical Pendulum Period
Simulate and compare the oscillation period of a point mass on a string (simple pendulum) versus a rigid uniform rod (physical pendulum) to visualize how mass distribution speeds up the rotational cycle.

Variable Mass System (Rocket Equation)
Explore the Tsiolkovsky Rocket Equation. Model continuous thrust as mass exponentially decreases due to fuel burn, comparing standard linear kinematic acceleration against variable-mass exponential acceleration.
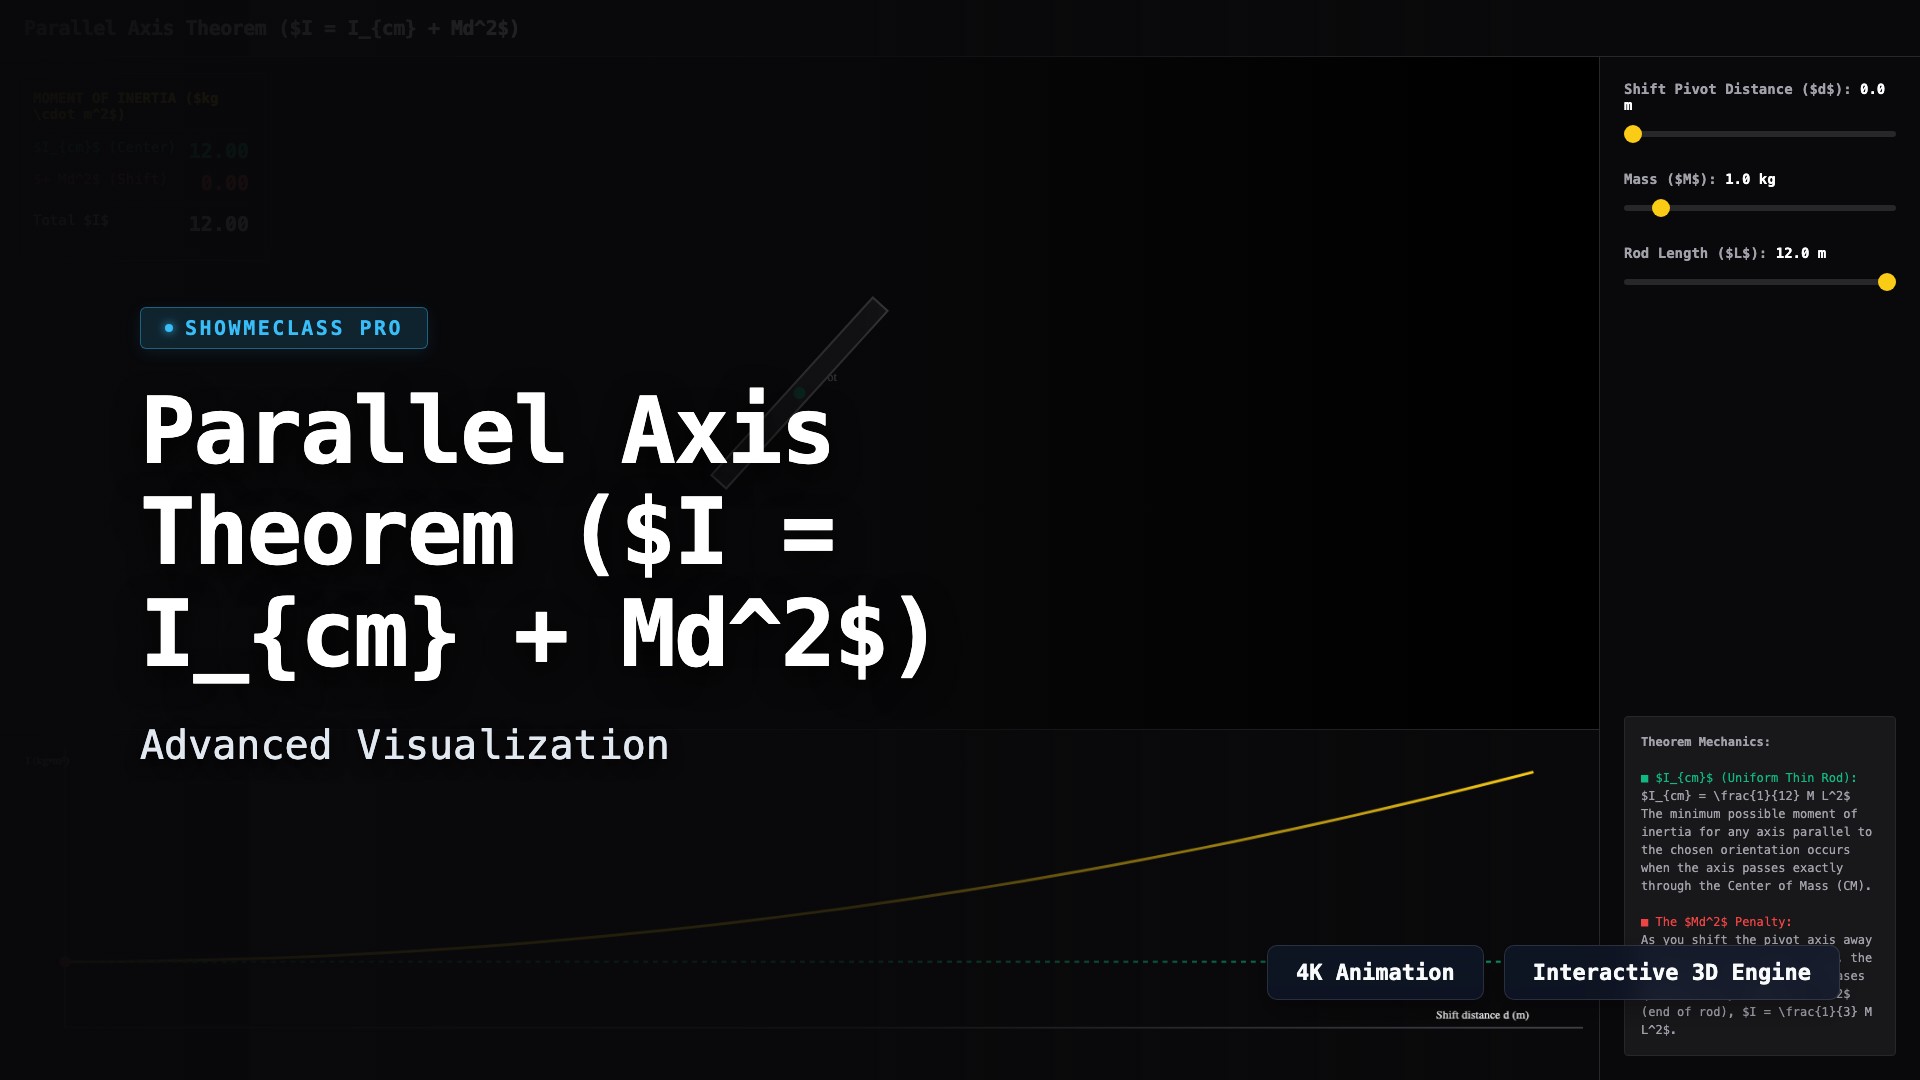
Parallel Axis Theorem Visualizer
Visualize how the moment of inertia scales quadratically as the rotation axis shifts away from the center of mass. Interactively drag the pivot point along a rigid rod and plot the Md² penalty.

Rolling vs Sliding Friction (Incline Race)
Compare the translational acceleration of a solid cylinder, a hollow cylinder, and a frictionless sliding block down an incline. Visualize how rotational inertia steals kinetic energy from linear motion.