Showing 12 results
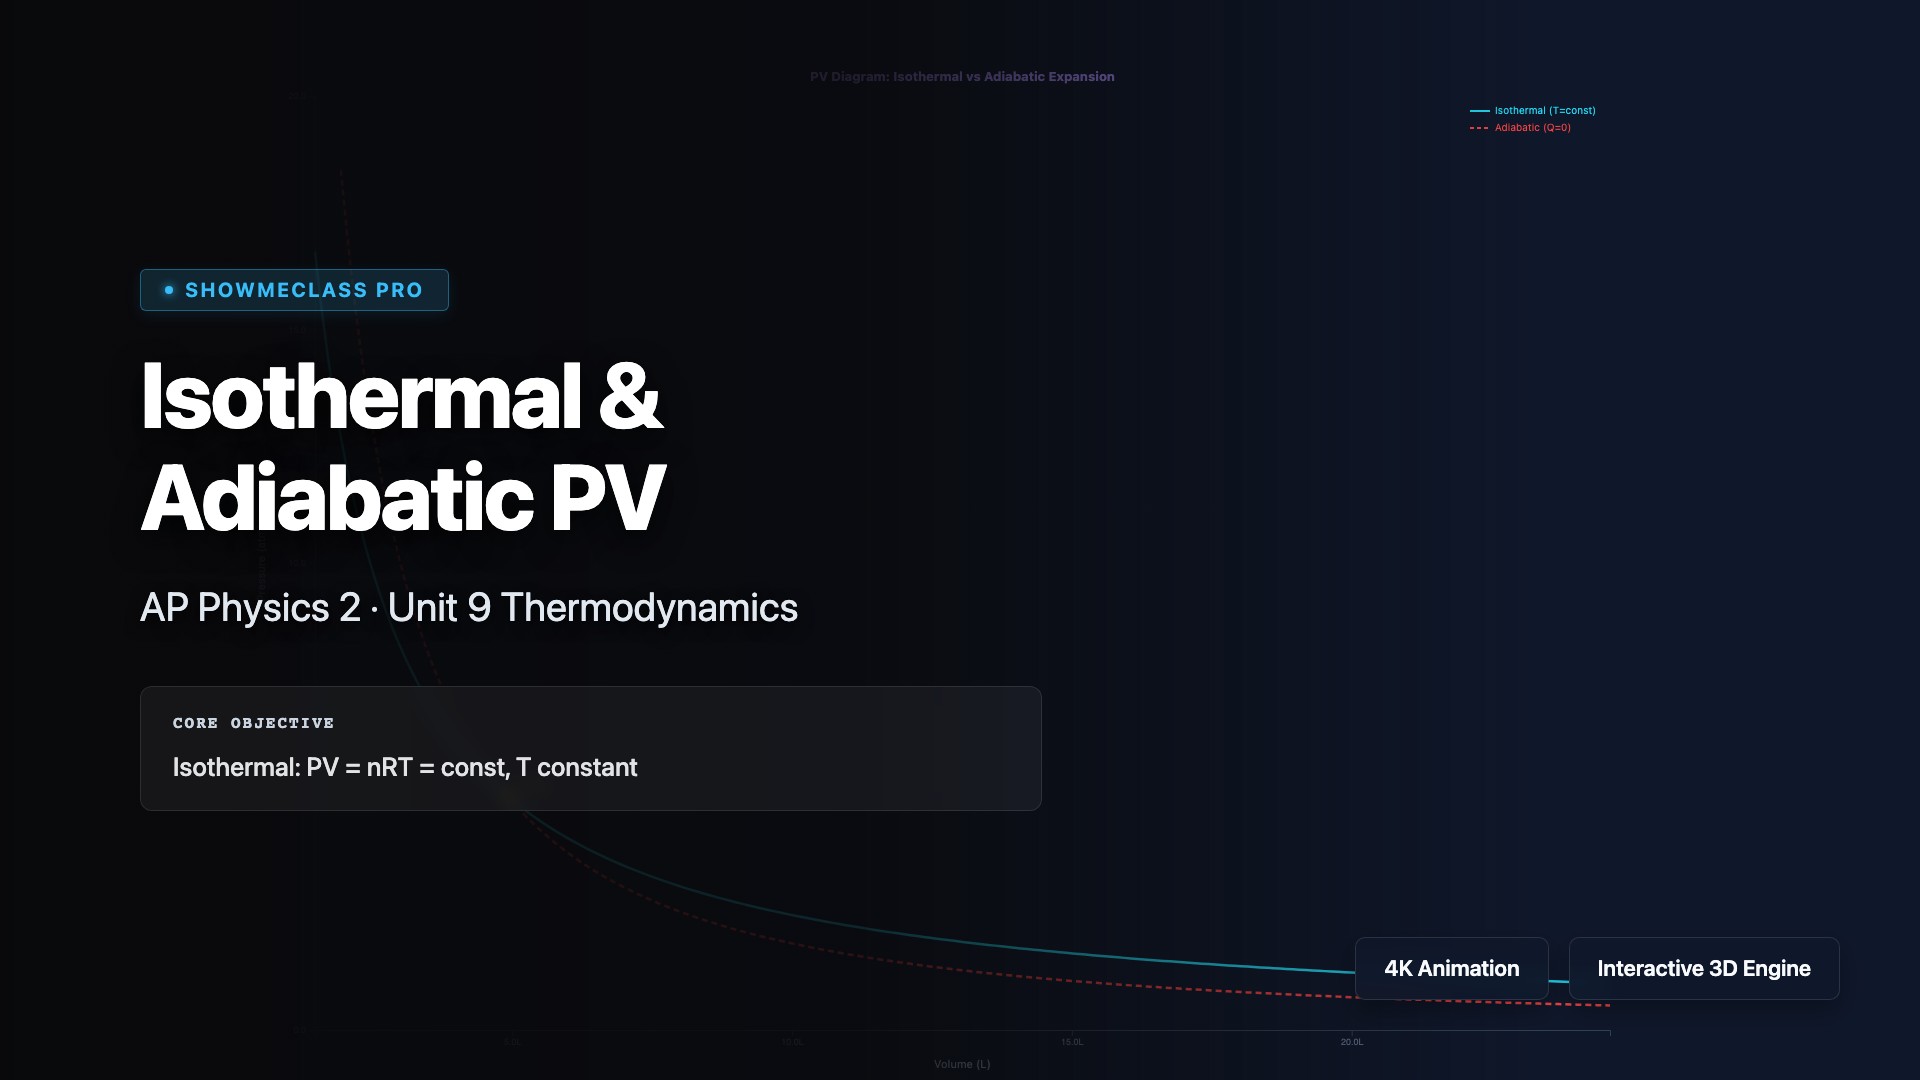
Isothermal & Adiabatic PV Processes
PV diagram overlay of isothermal (PV=nRT) and adiabatic (PVᵞ=const) processes. Compare curve steepness and work done for expansion.
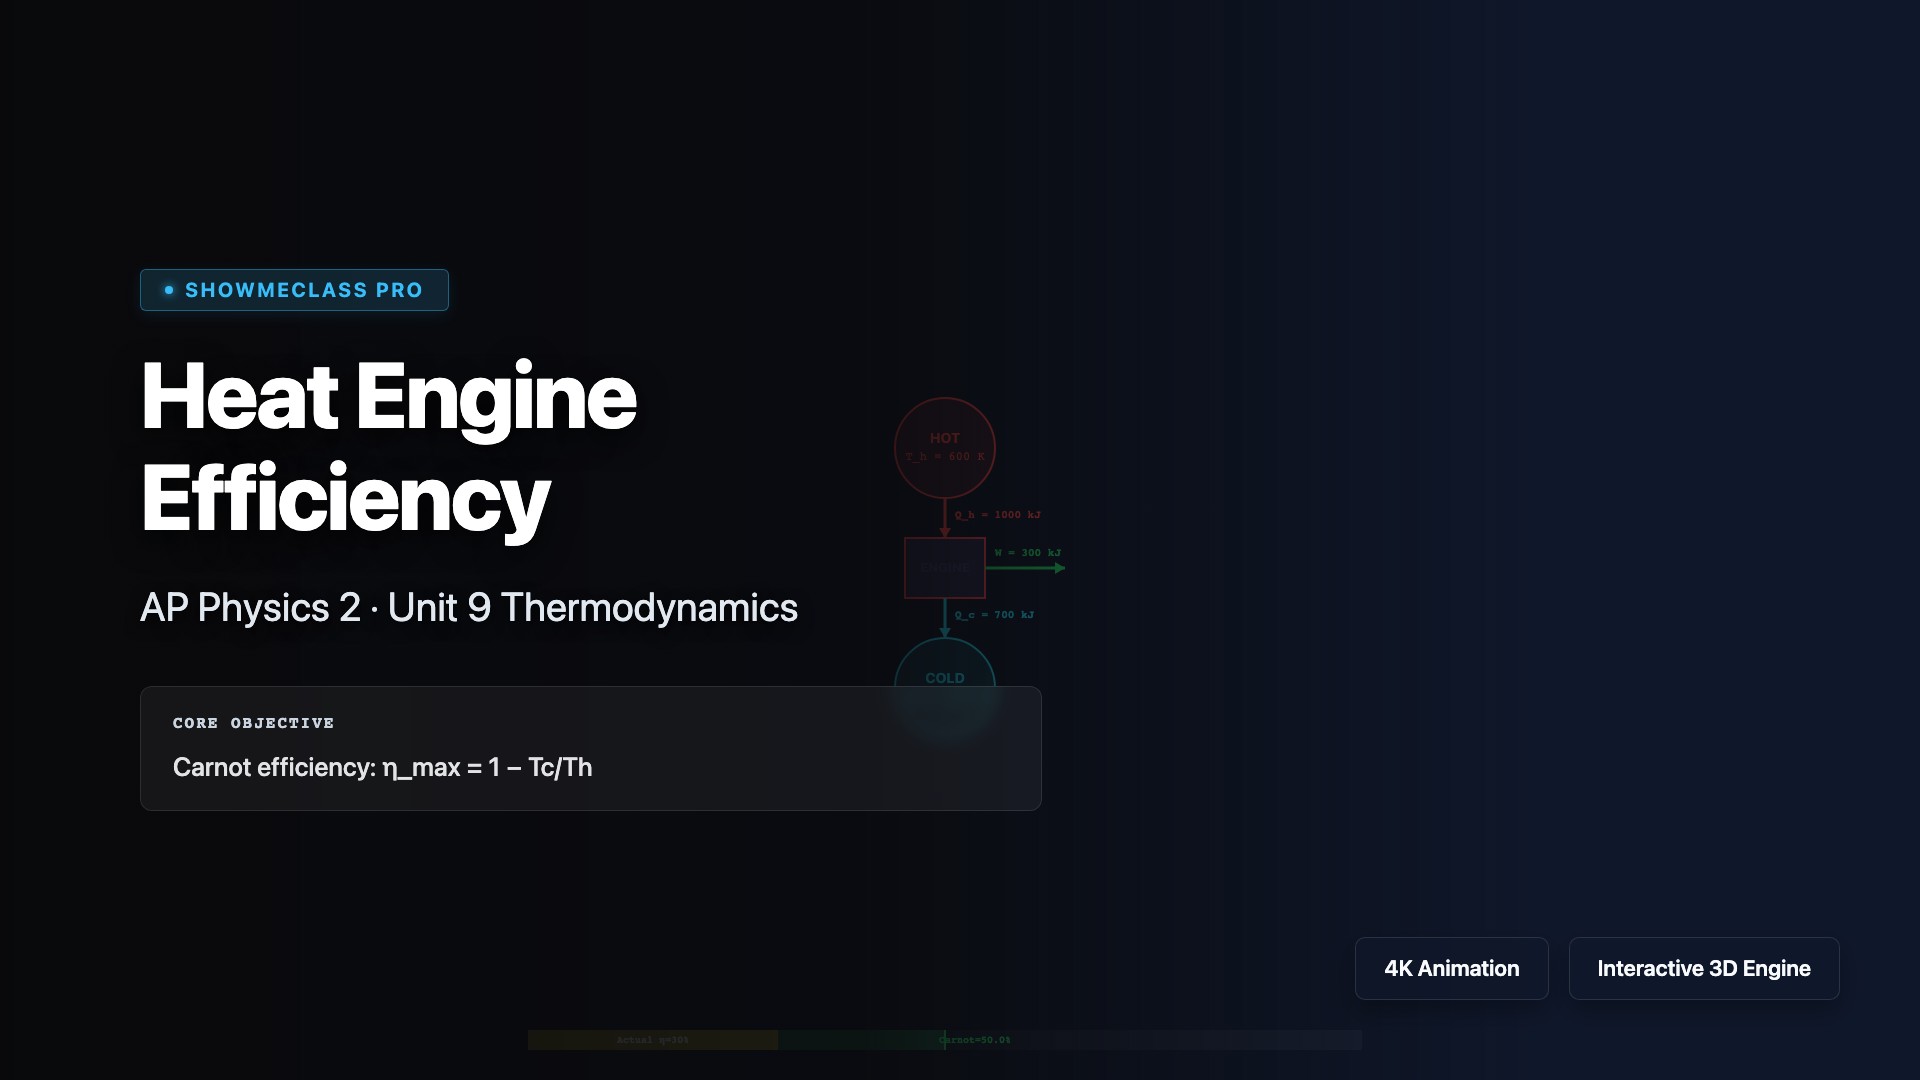
Heat Engine Efficiency Comparator
Carnot cycle efficiency diagram: η_max = 1−Tc/Th. Compare actual vs maximum efficiency with energy flow visualization. Impossibility warning when η > η_Carnot.
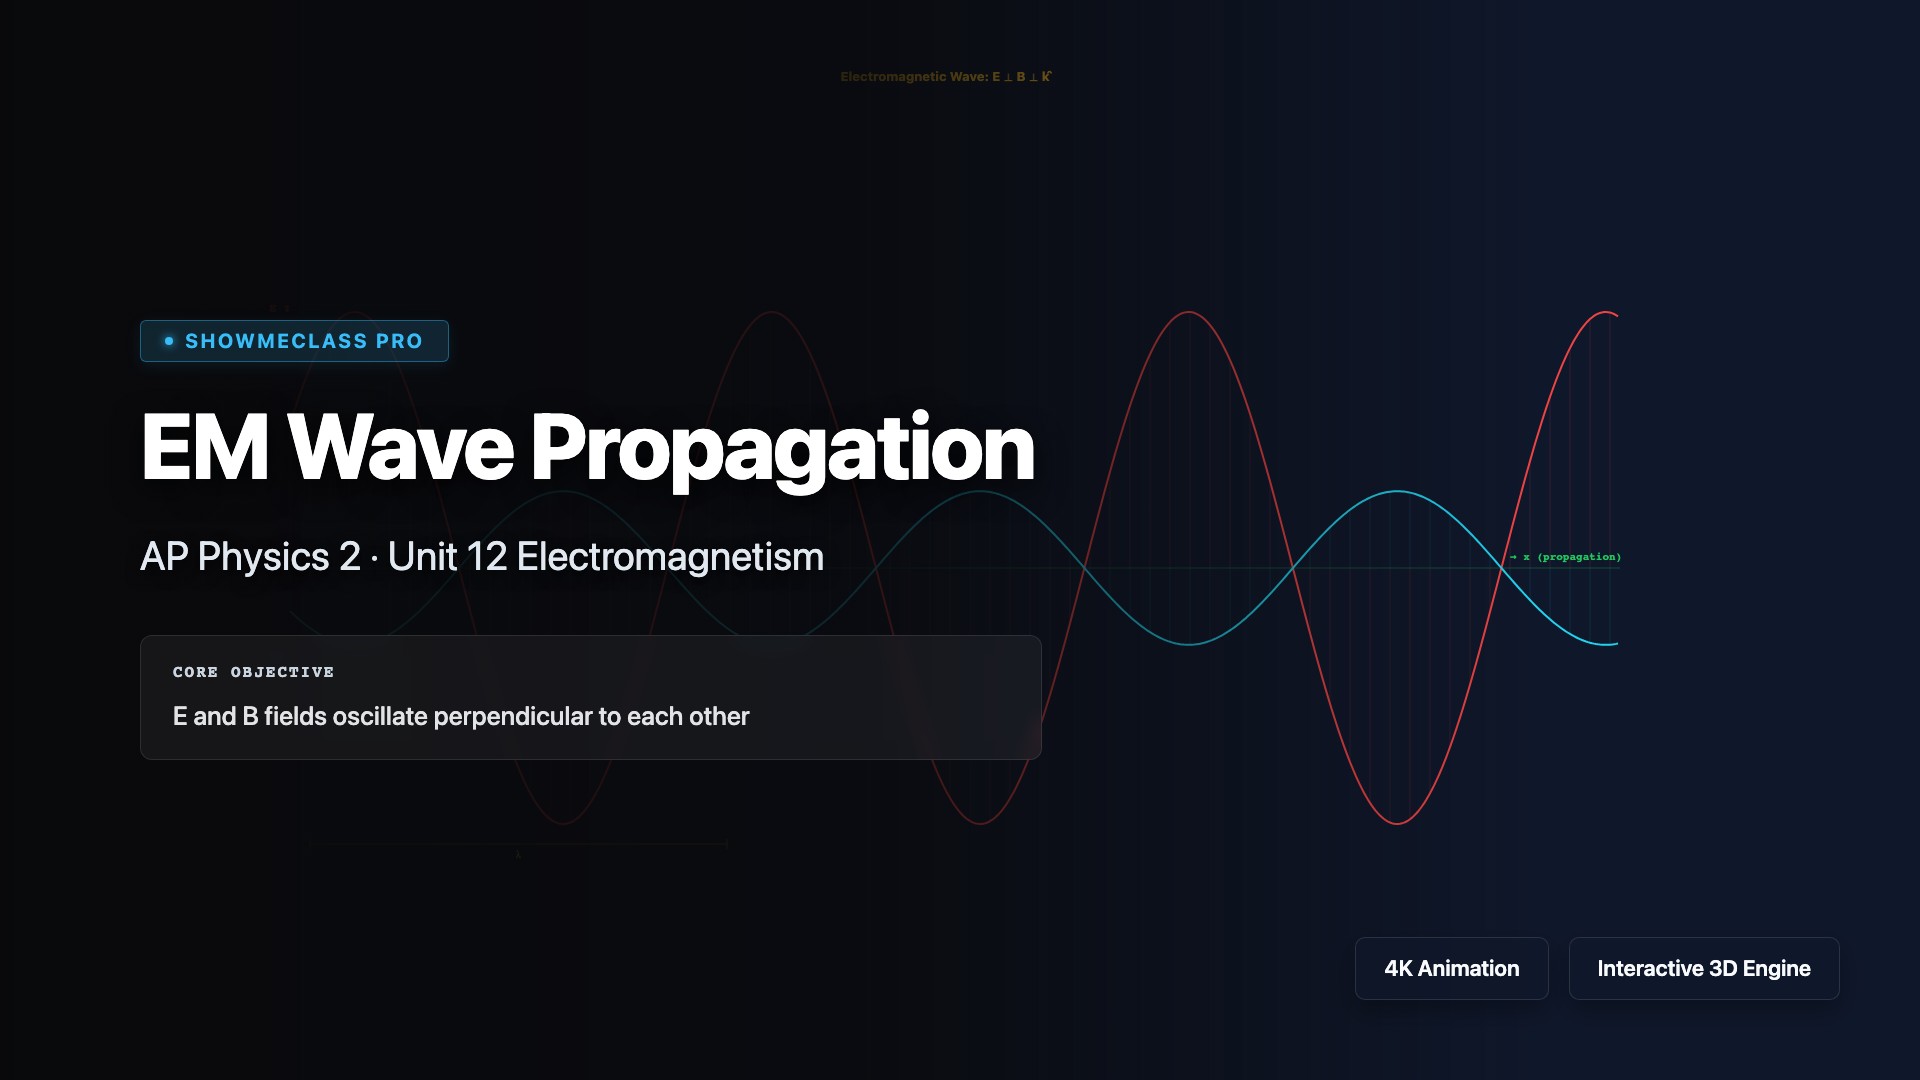
Electromagnetic Wave Propagation
Animated EM wave with perpendicular E and B field oscillation. Adjustable frequency, amplitude, and propagation speed with wavelength marker.
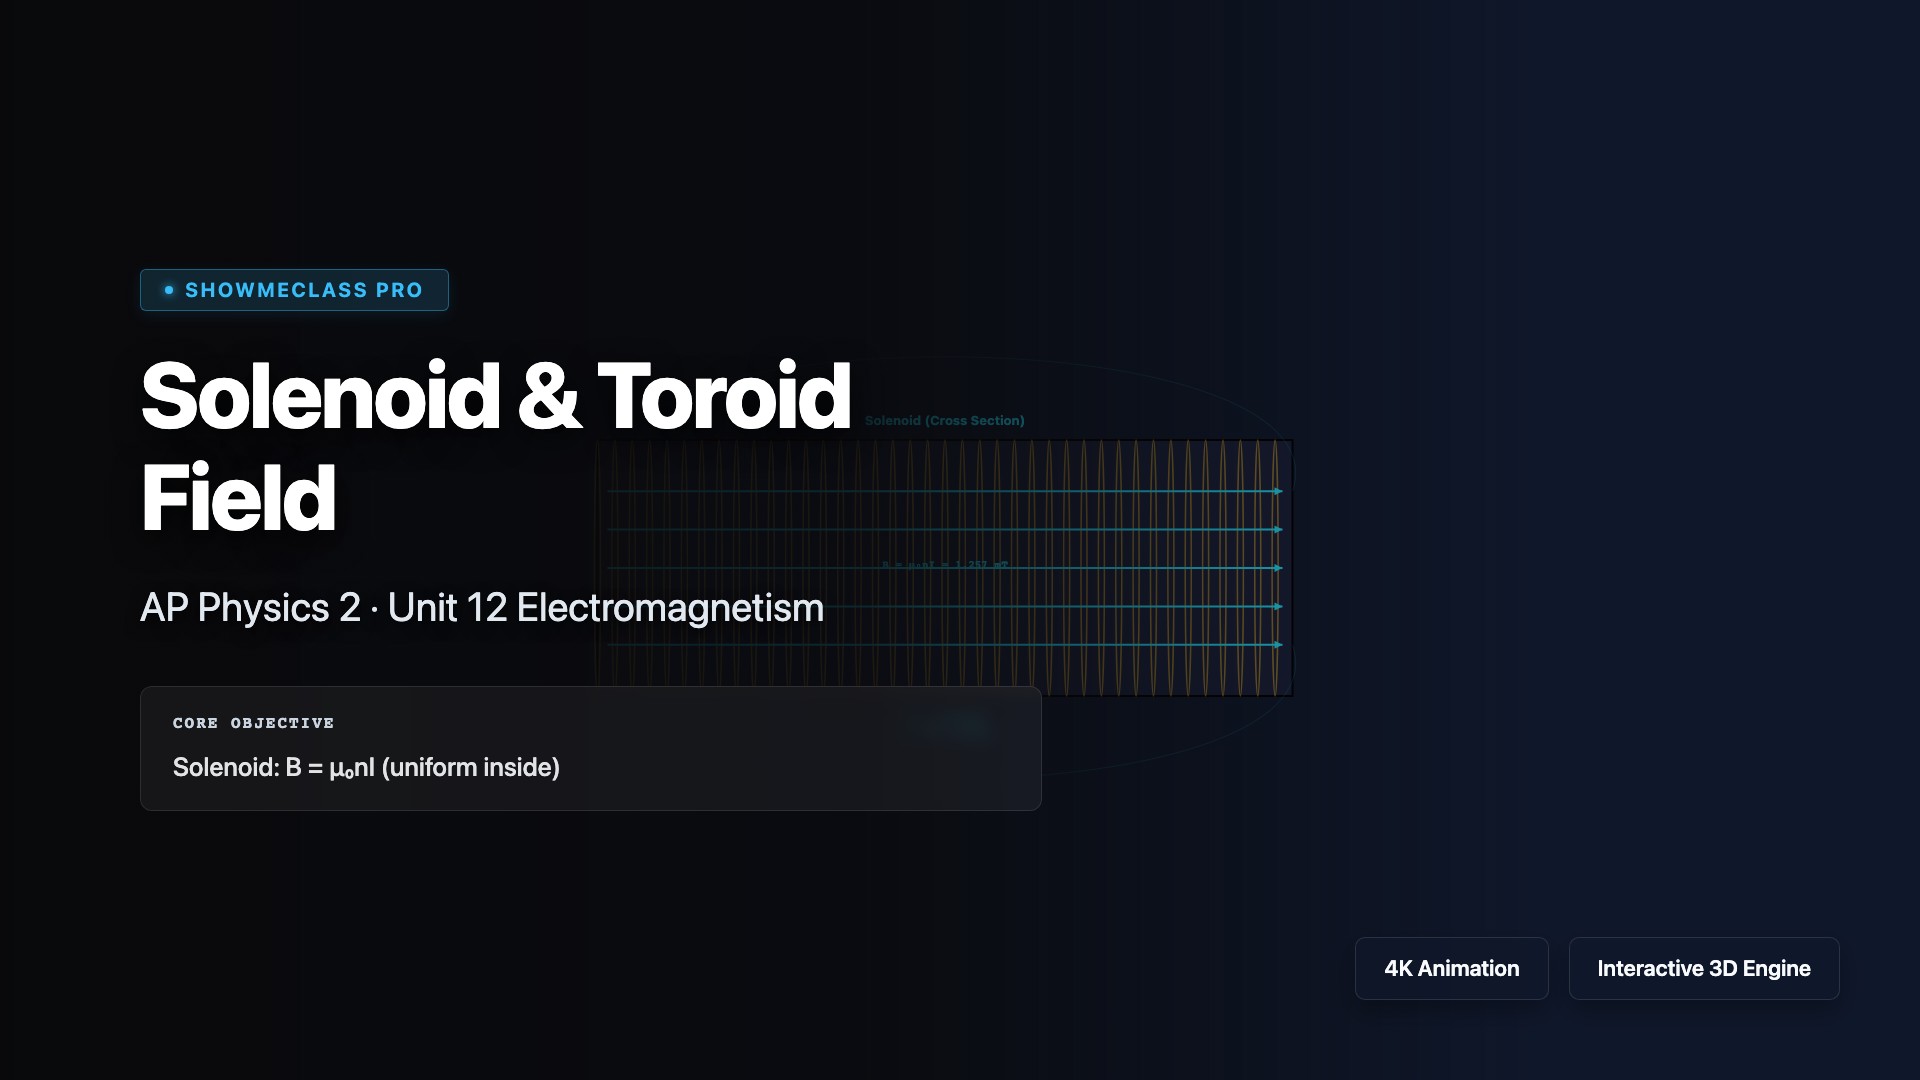
Solenoid & Toroid Magnetic Field
Visualize magnetic field inside solenoid (B=μ₀nI) and toroid (B=μ₀NI/2πr). Shows coil turns, field lines, and B=0 outside.
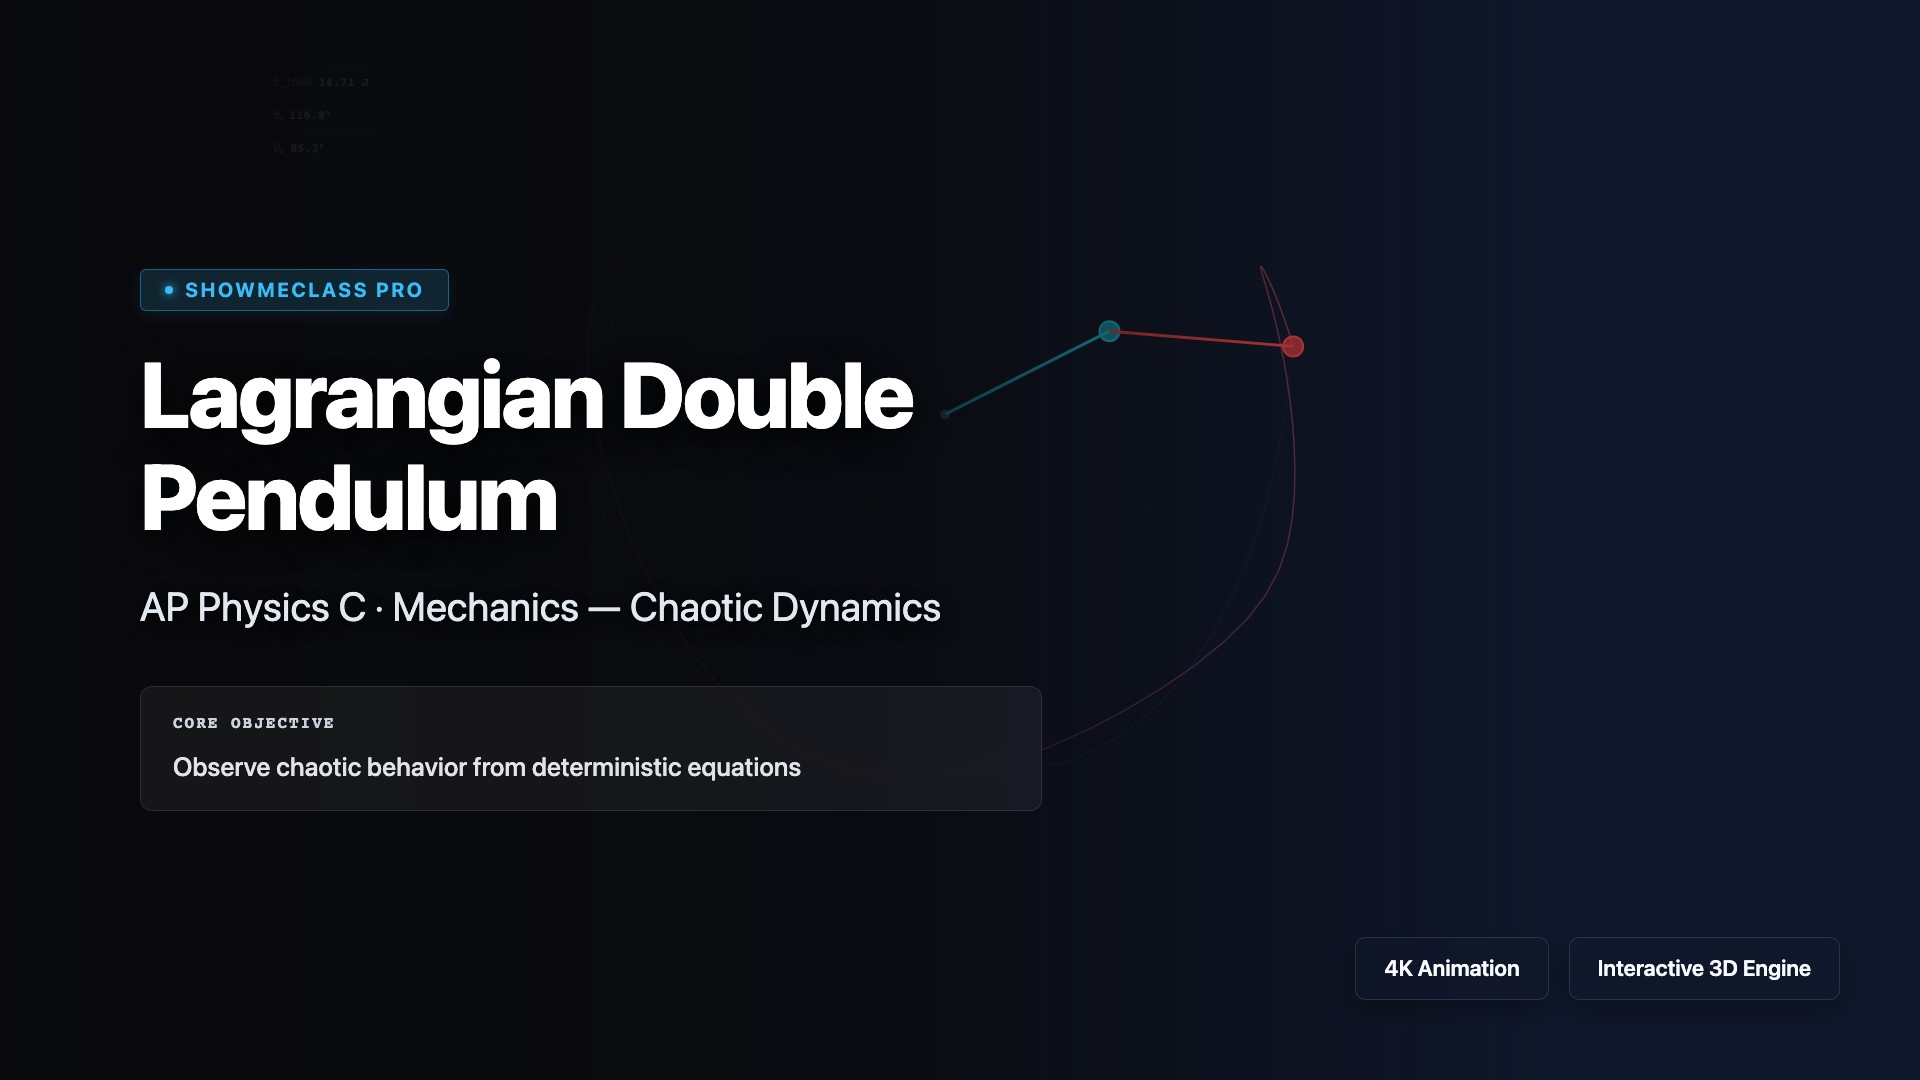
Lagrangian Double Pendulum
Simulate chaotic double pendulum motion using RK4 numerical integration of Lagrangian equations. Observe butterfly effect with adjustable initial angles, masses, and lengths.
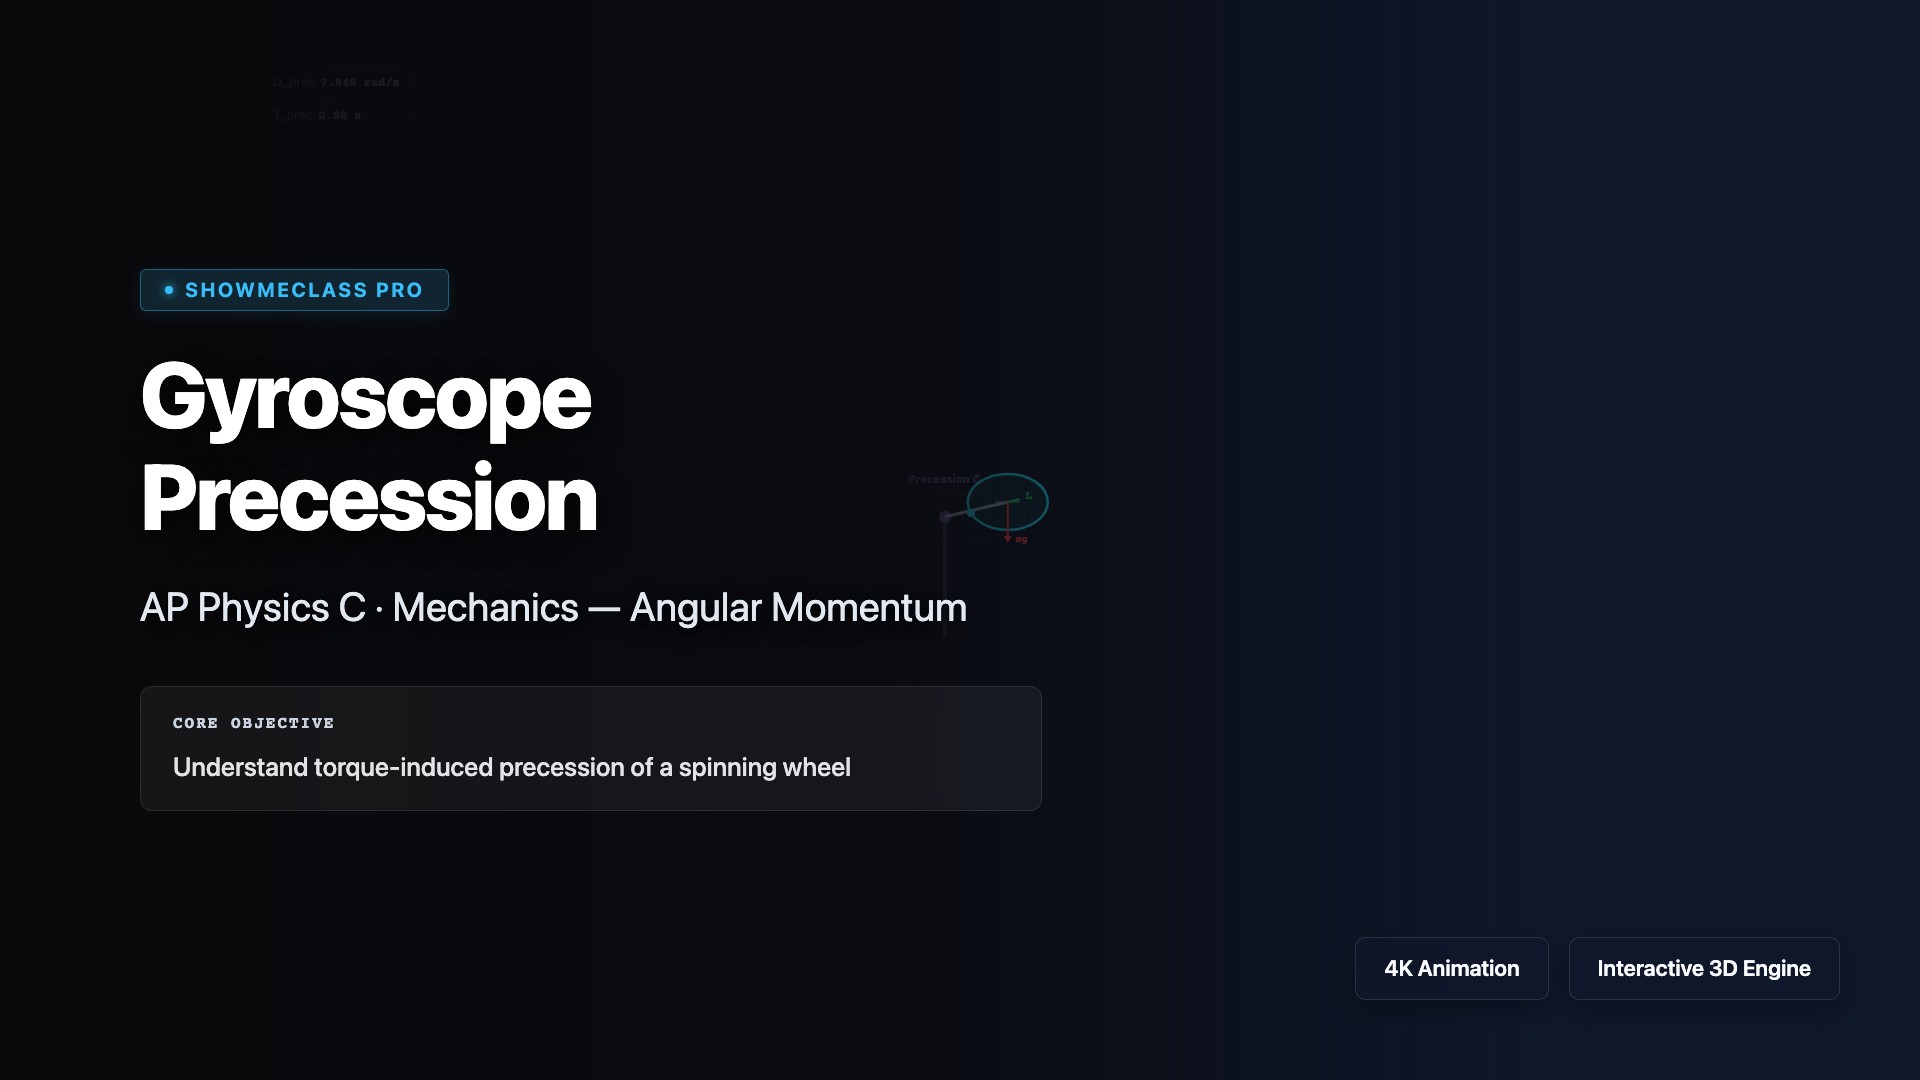
Gyroscope Precession
Visualize gyroscopic precession with adjustable spin speed, mass, arm length, and disk radius. See how Ω_prec = τ/(Iω) relates torque to angular momentum direction.
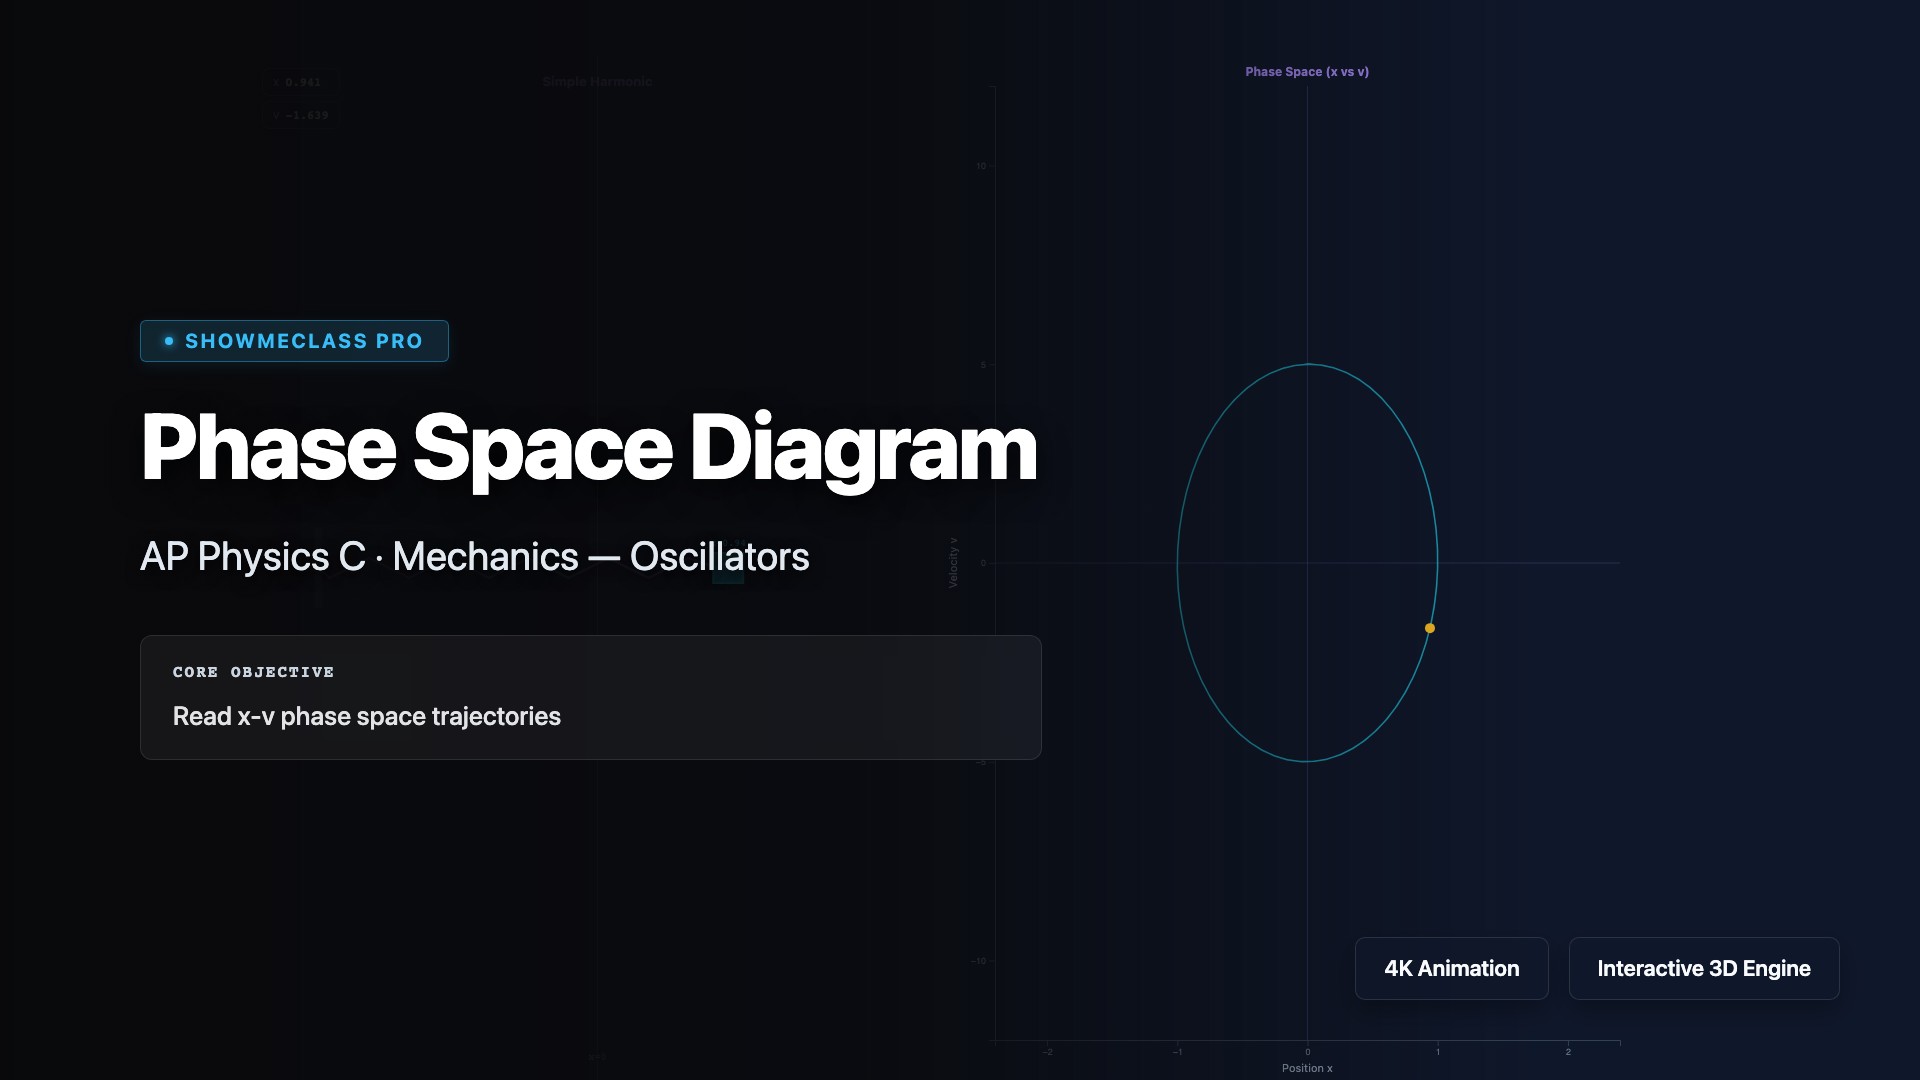
Phase Space Diagram (Oscillator)
Explore x-v phase space for SHM, underdamped, overdamped, and forced oscillators. Watch trajectories form ellipses, spirals, or limit cycles in real time.
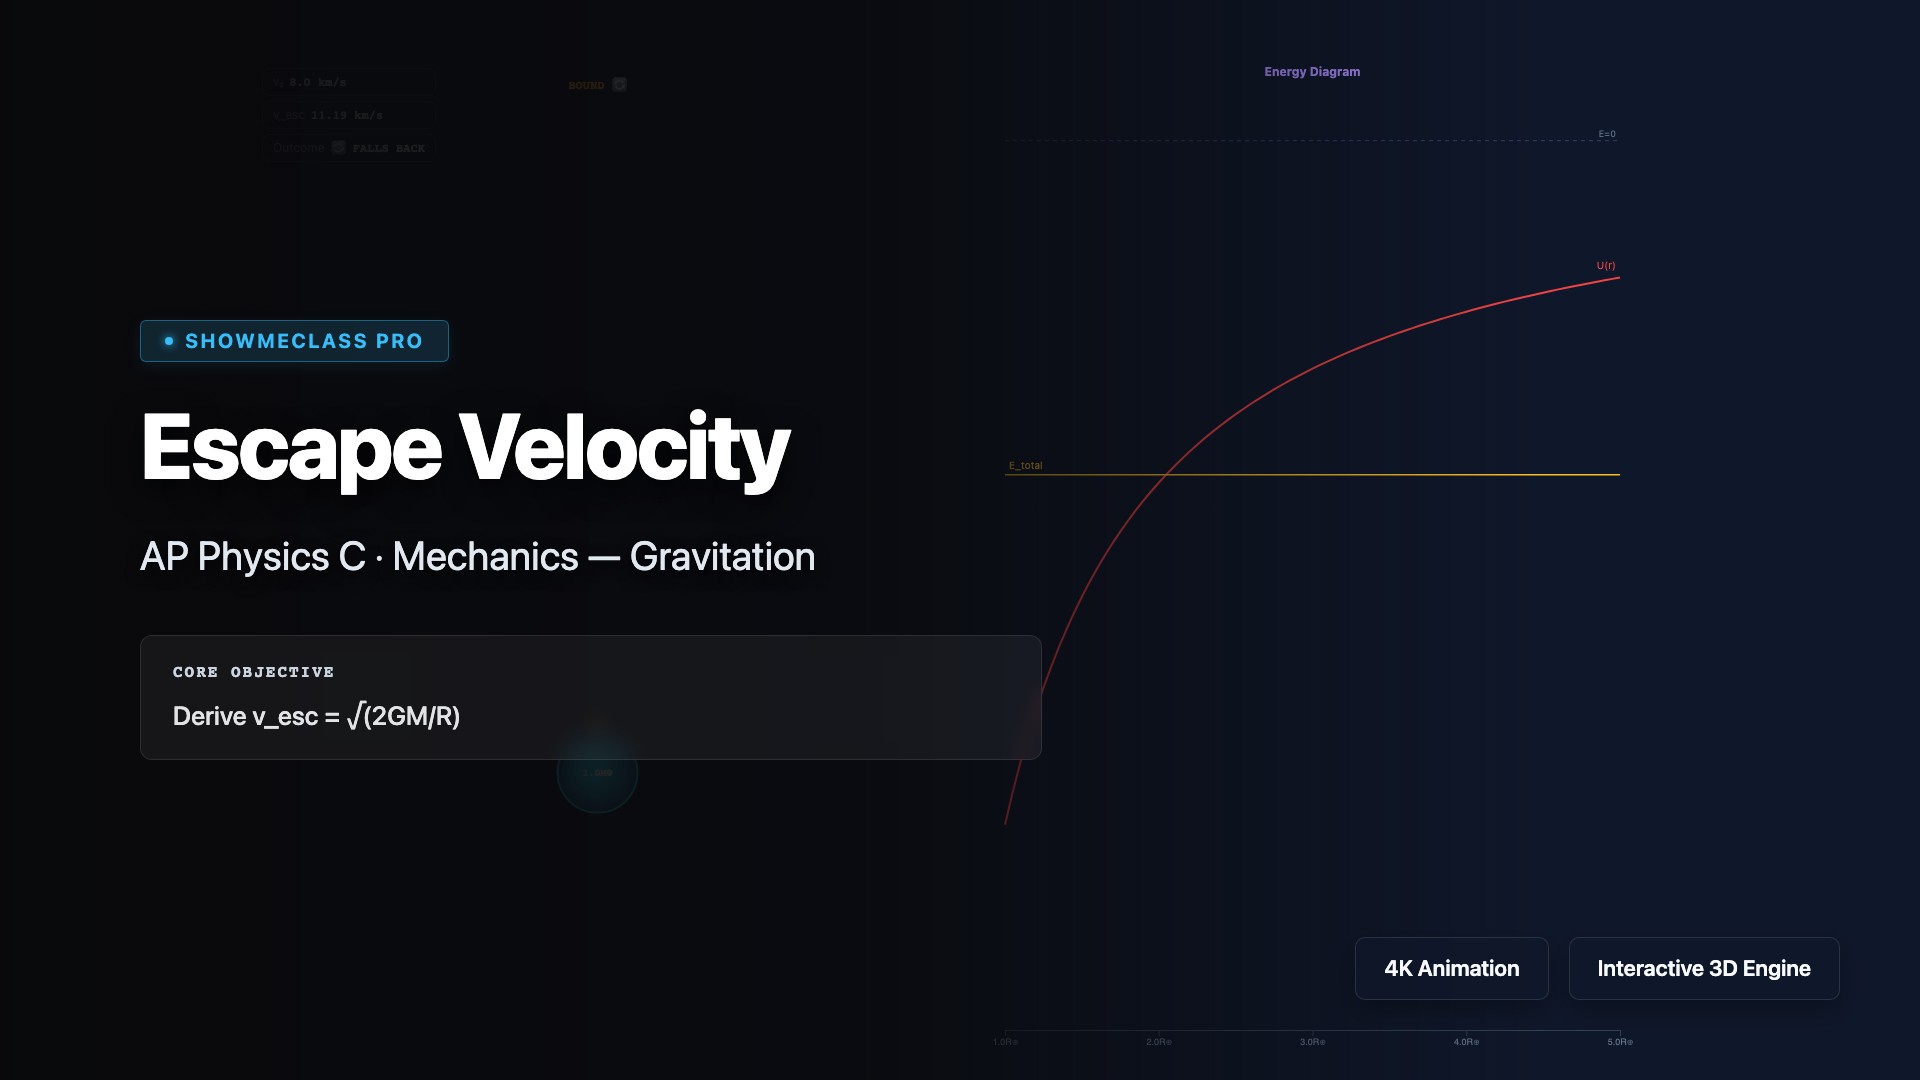
Escape Velocity & Gravitational Binding
Launch a projectile and see whether it escapes or falls back. Energy diagram shows U(r) vs total energy. Compare escape velocities of Earth, Mars, Jupiter, and Moon.
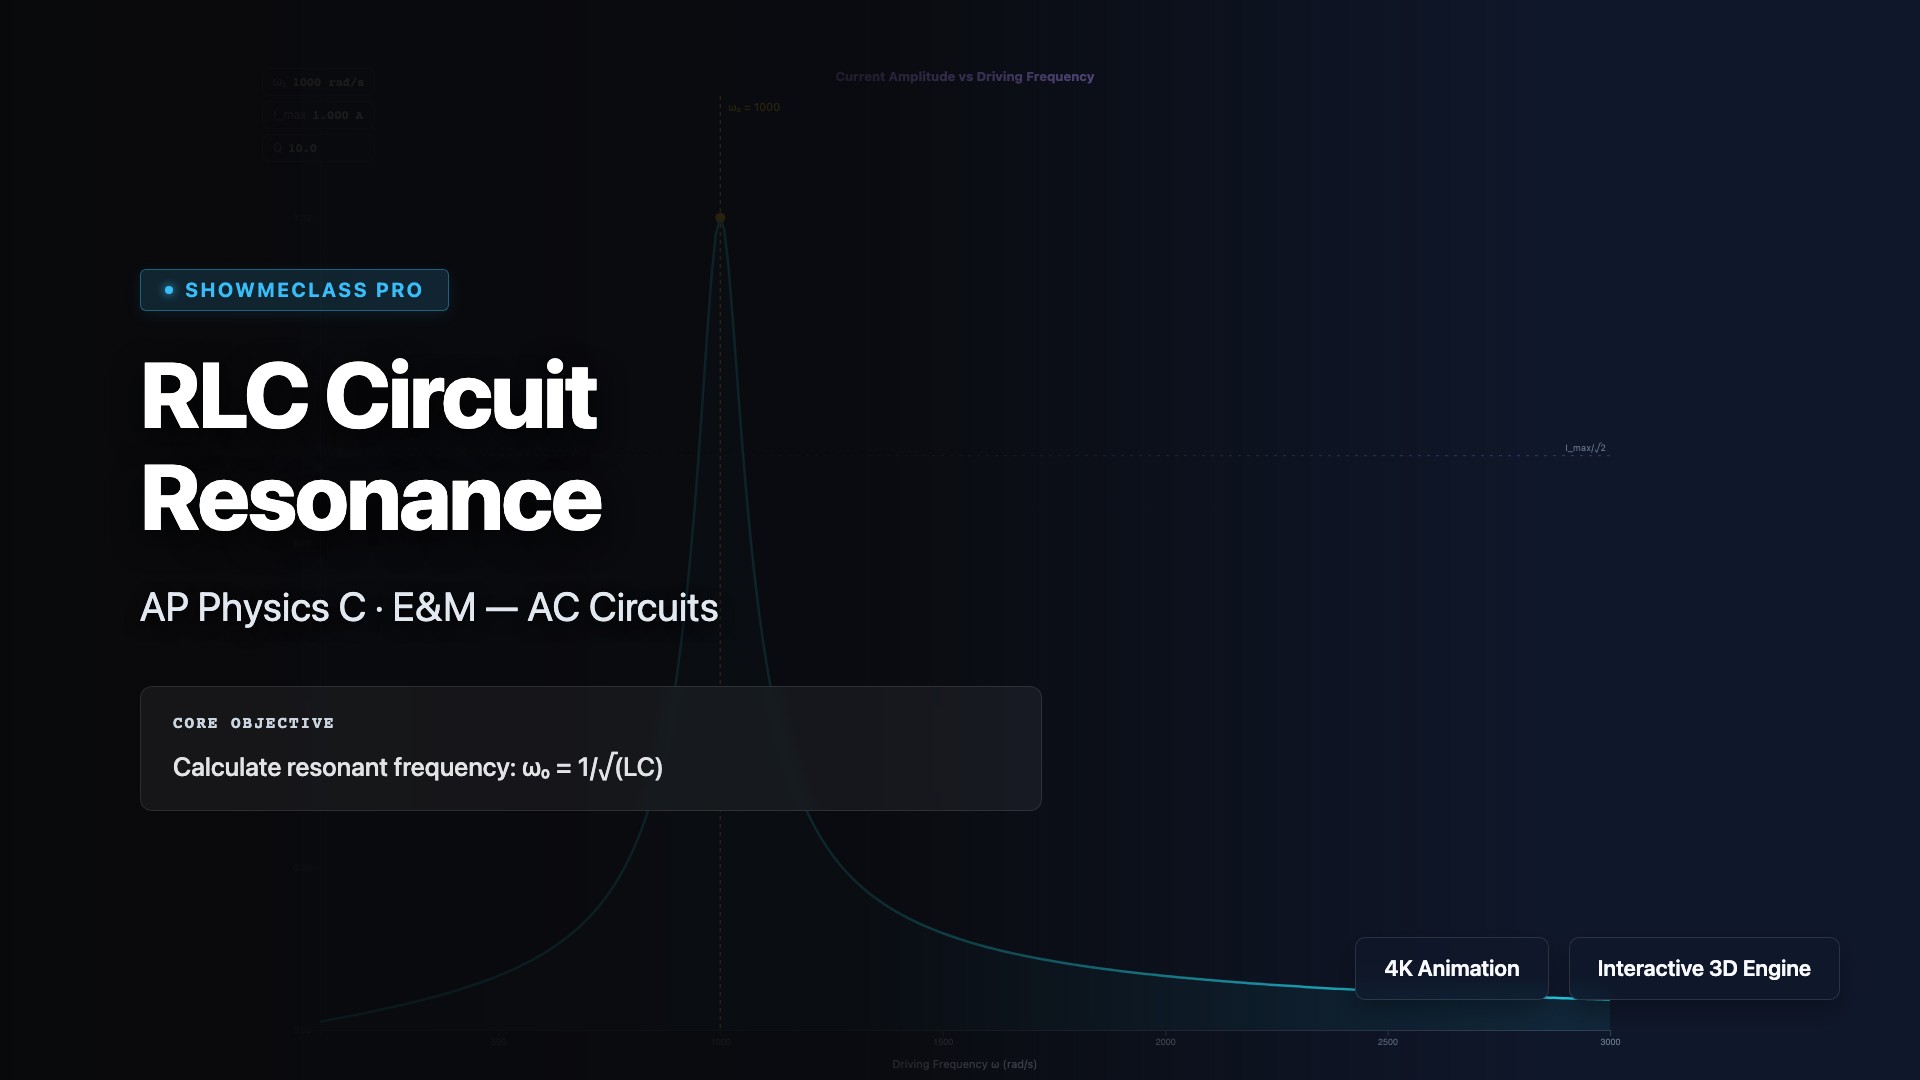
RLC Circuit Resonance
Explore series RLC resonance by sweeping driving frequency. See current amplitude peak at ω₀ = 1/√(LC), impedance minimum at Z = R, and quality factor determining bandwidth.
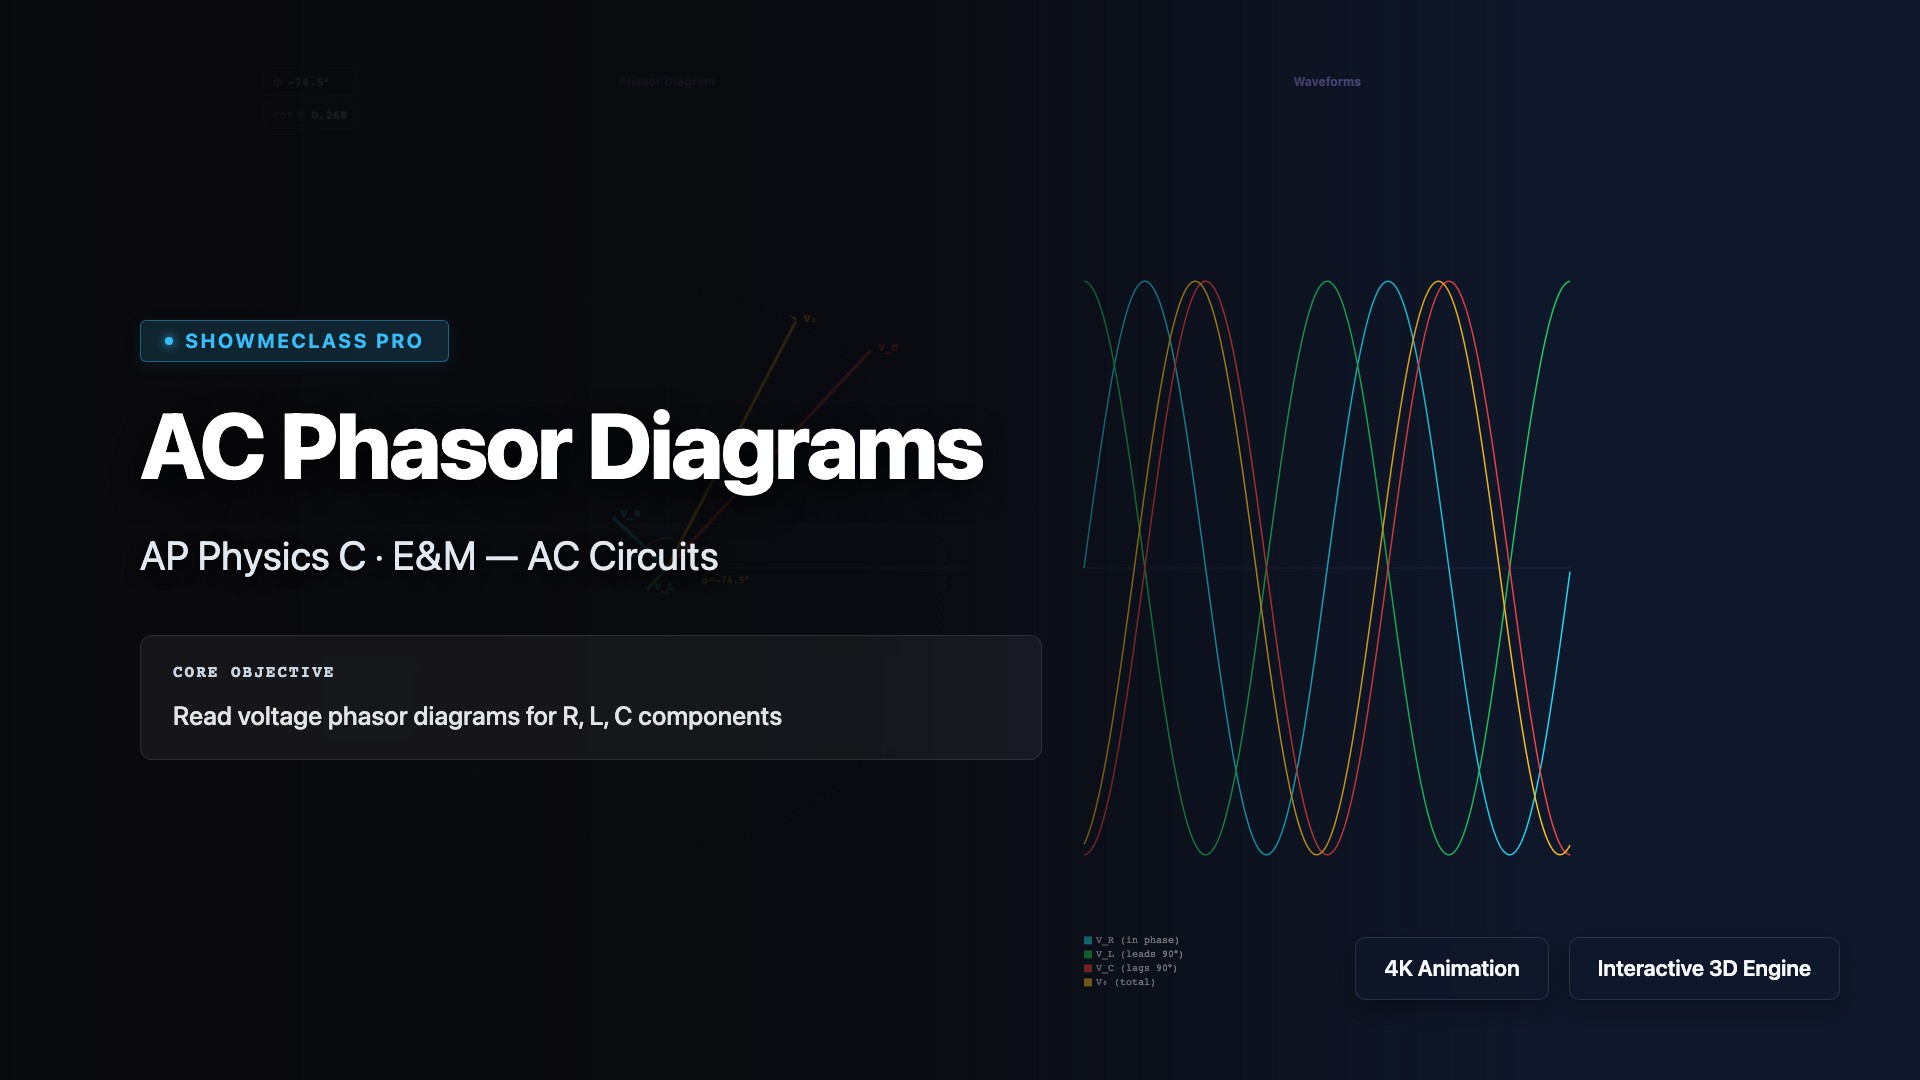
AC Circuit Phasor Diagrams
Animated phasor diagram showing V_R, V_L, V_C rotating vectors with real-time waveforms. Adjust ω, R, L, C to see phase angle φ and power factor change dynamically.
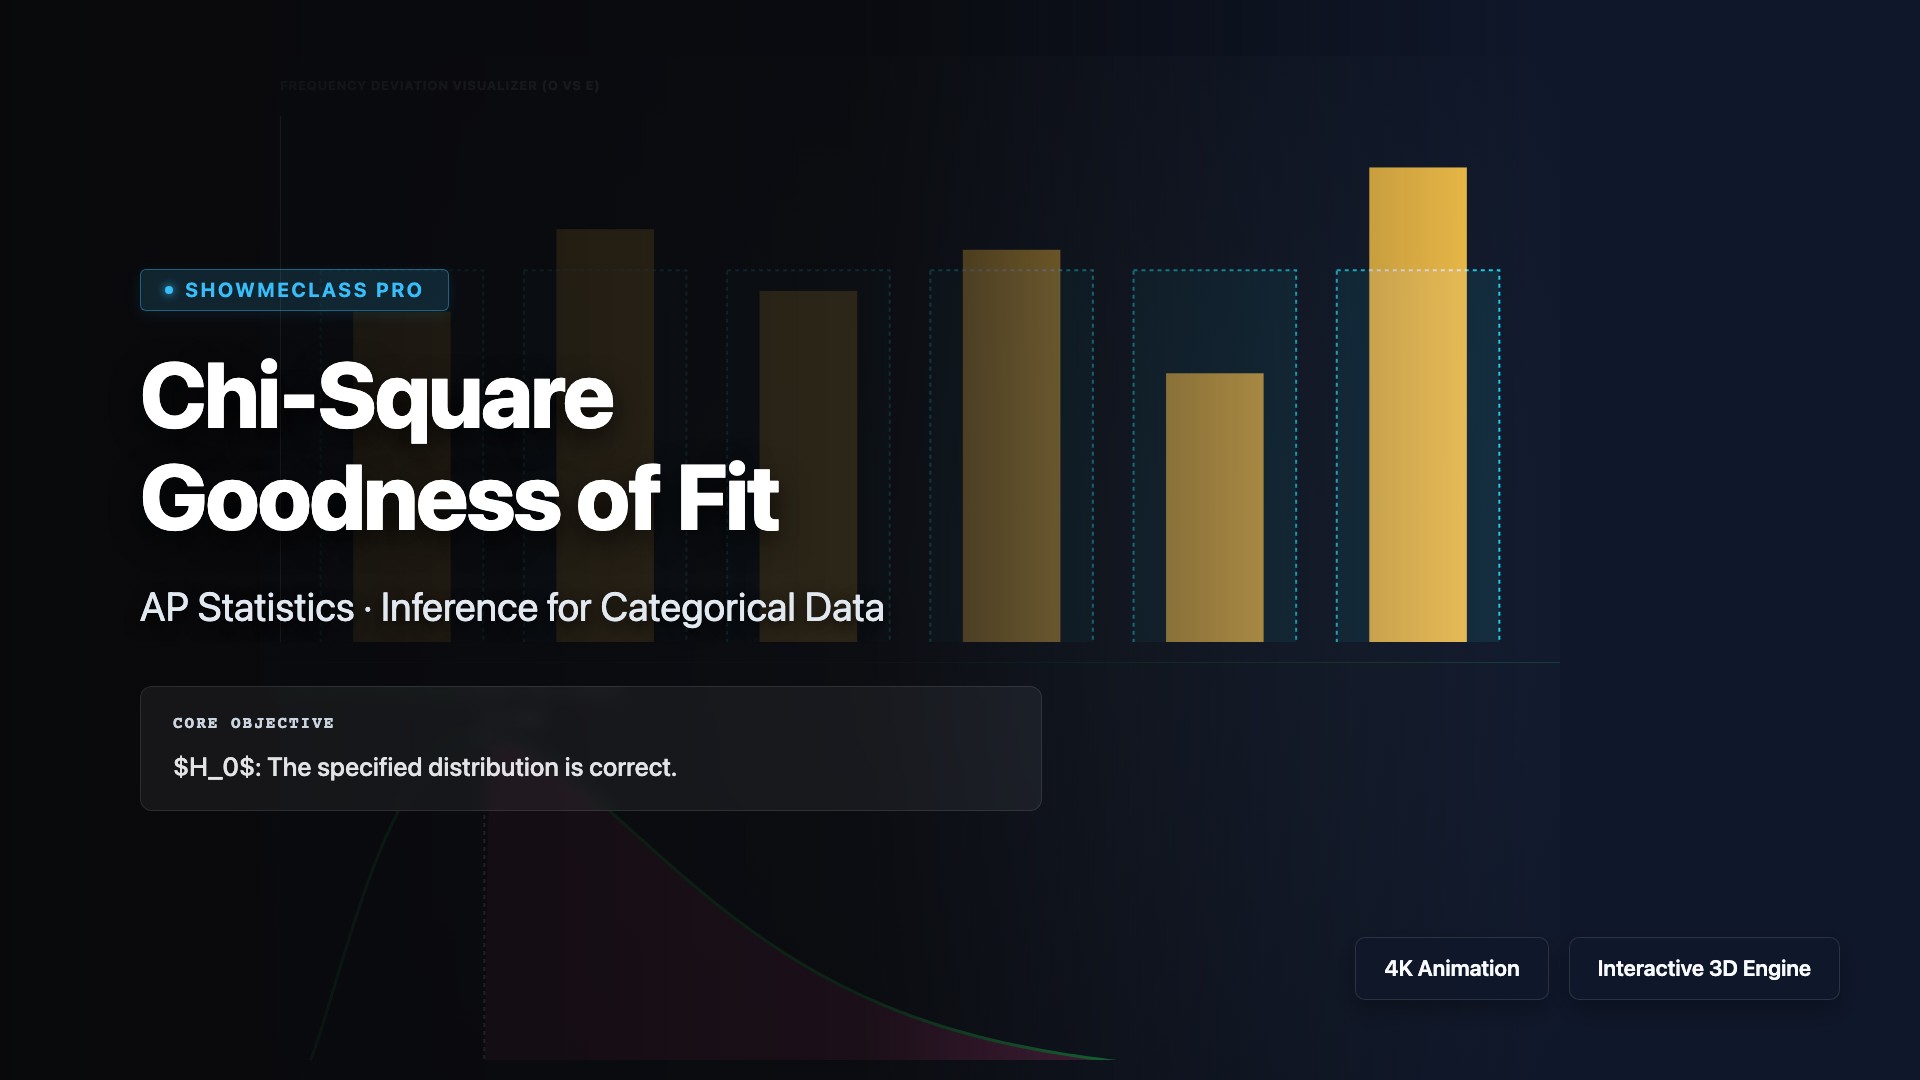
Chi-Square Goodness of Fit
Calculate and visualize the Chi-Square test statistic. Compare expected vs observed dice rolls across categories and plot how deviations force the P-value into the rejection region.
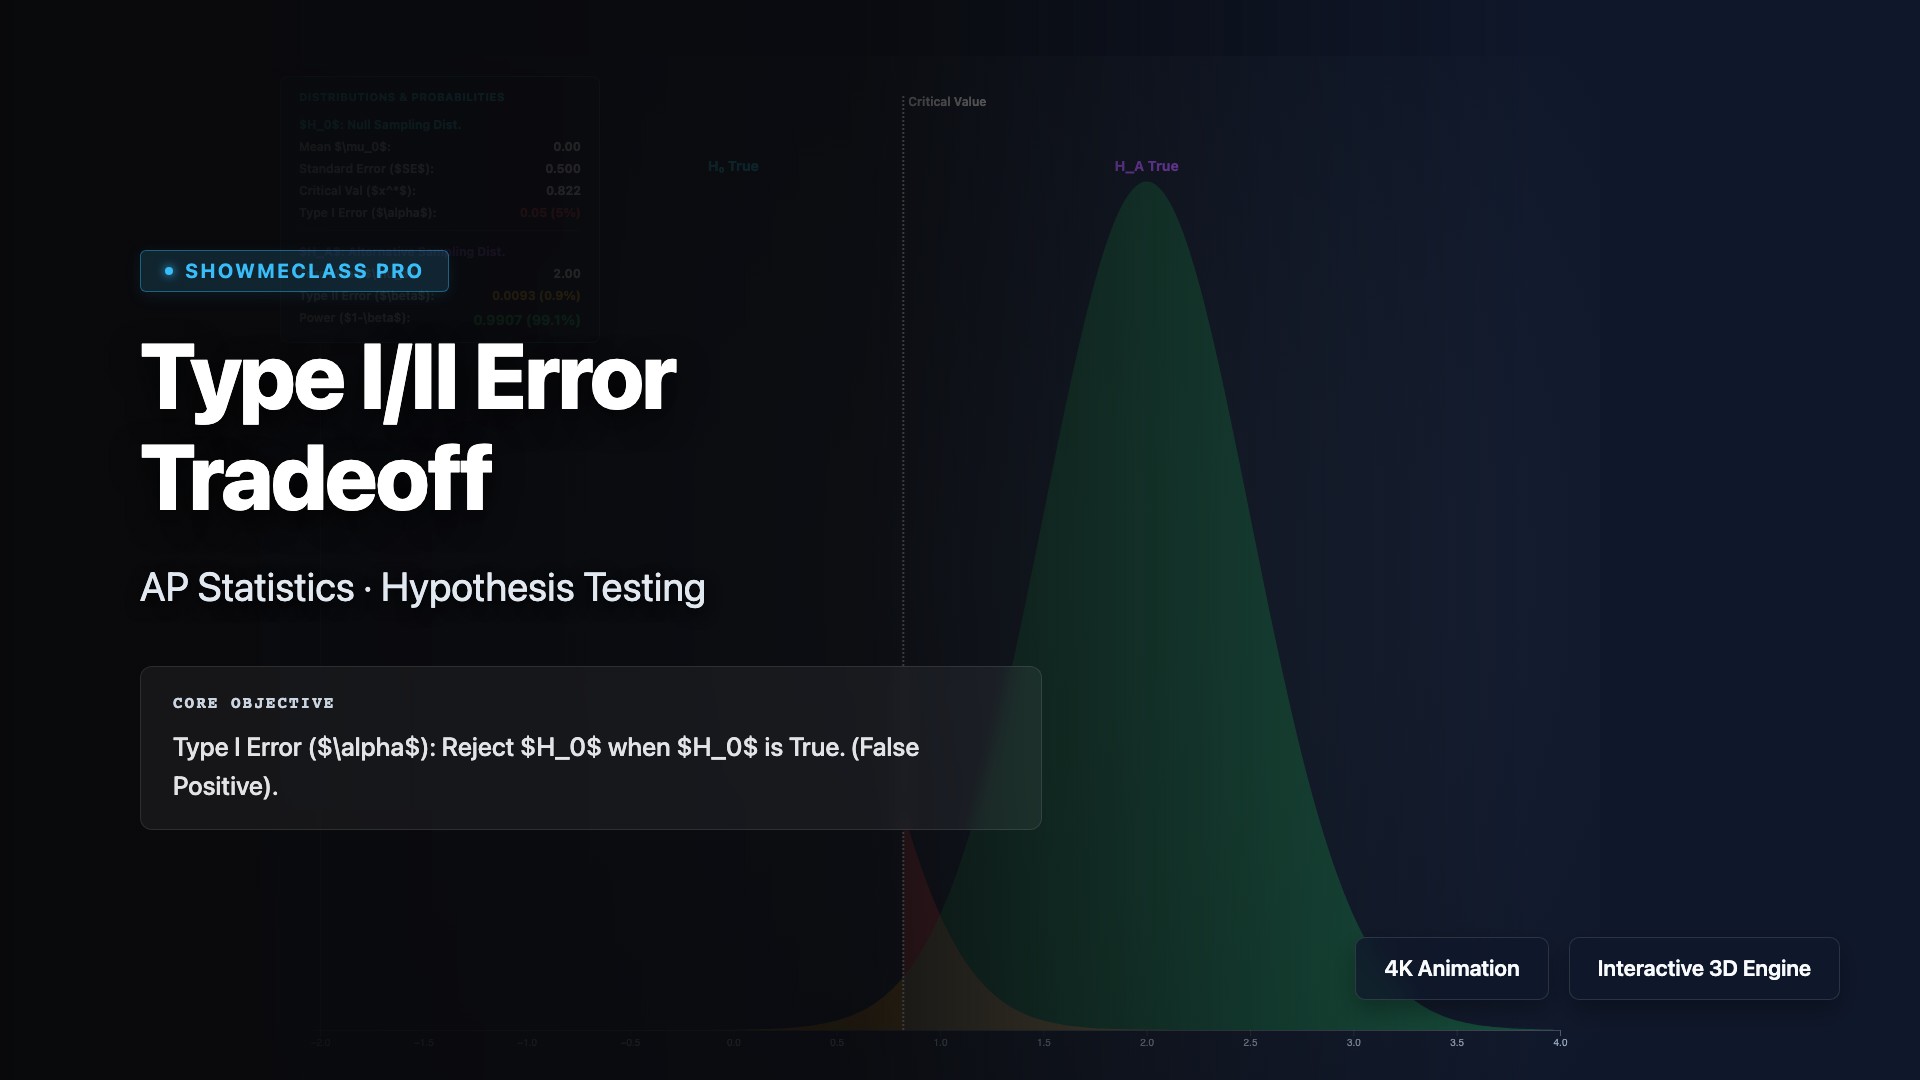
Type I/II Error & Statistical Power
Interactive hypothesis testing visualizer. Adjust Effect Size, Sample Size, and Alpha to instantly see the tradeoff balance between Type I Error, Type II Error, and Statistical Power.