Showing 12 results
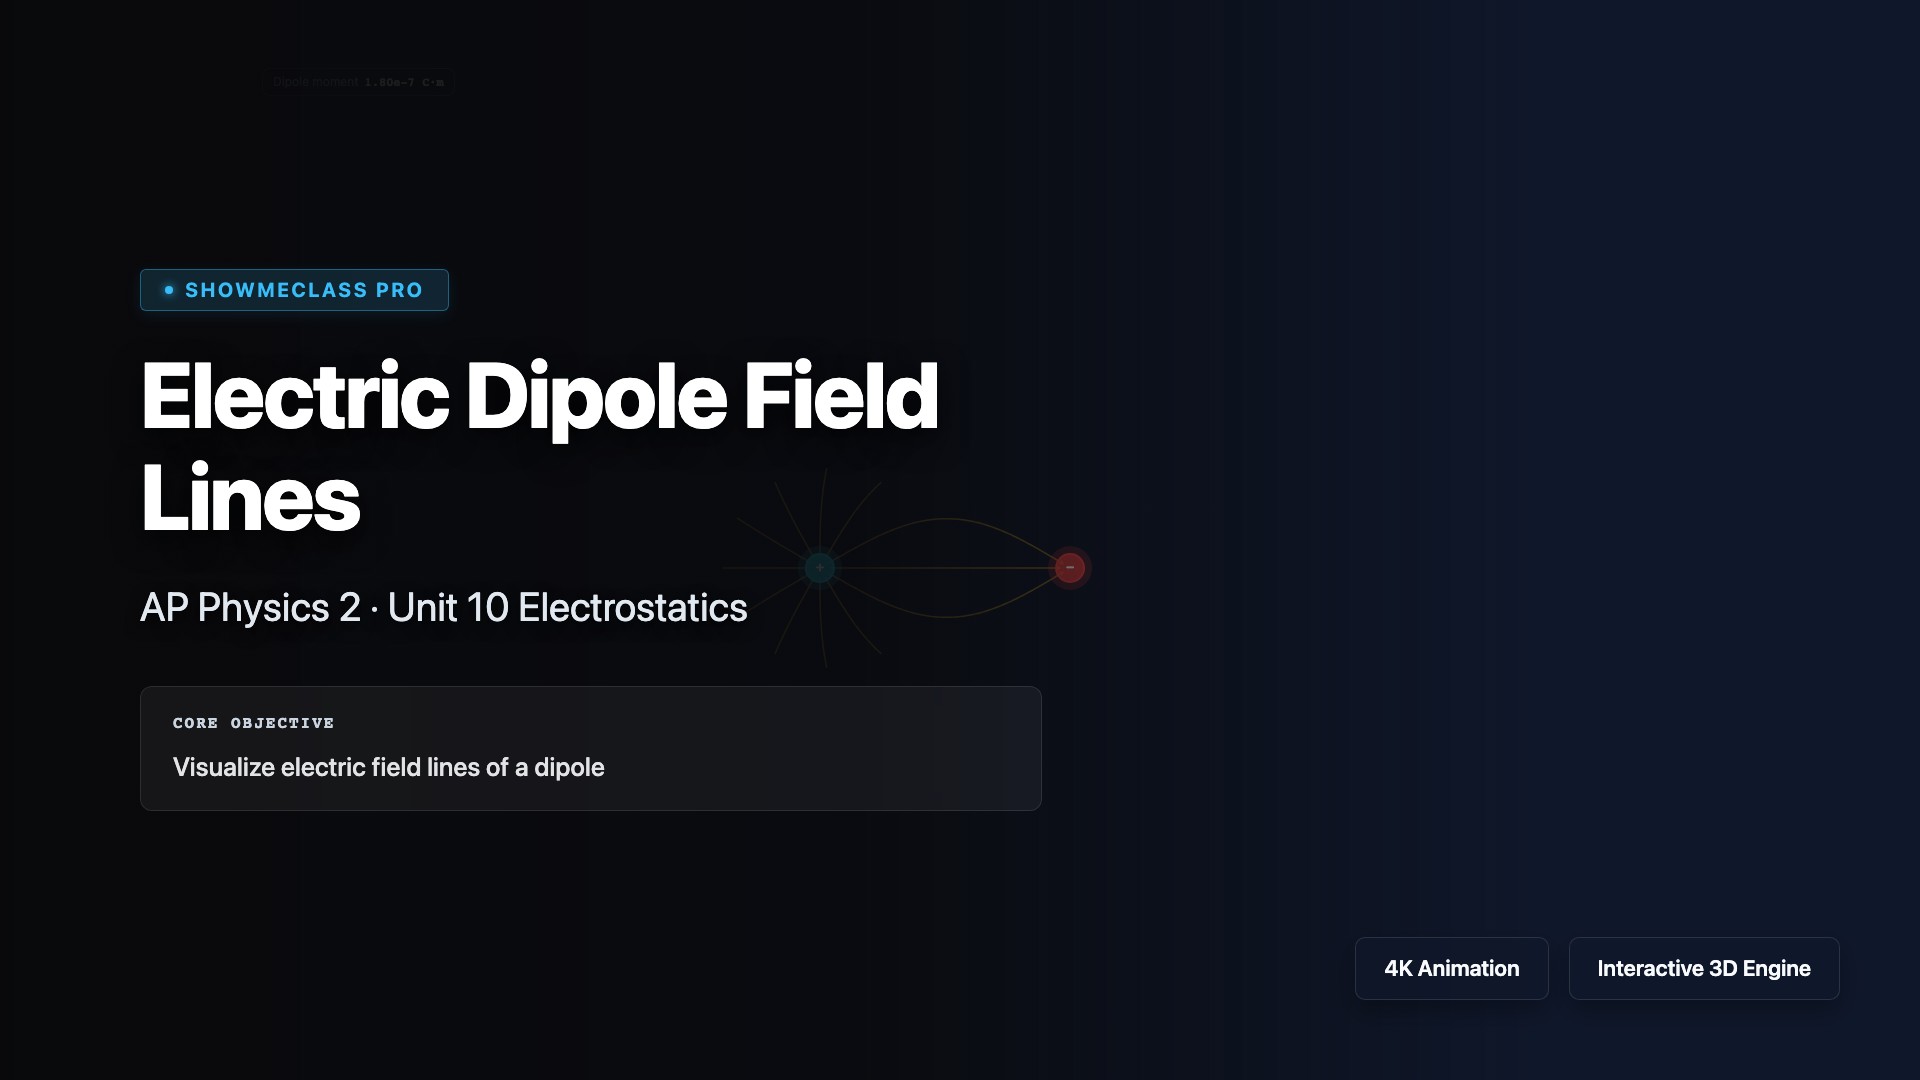
Electric Dipole Field Lines
Visualize the electric field lines and equipotential surfaces of an electric dipole. Trace field lines from positive to negative charge with adjustable charge and separation.
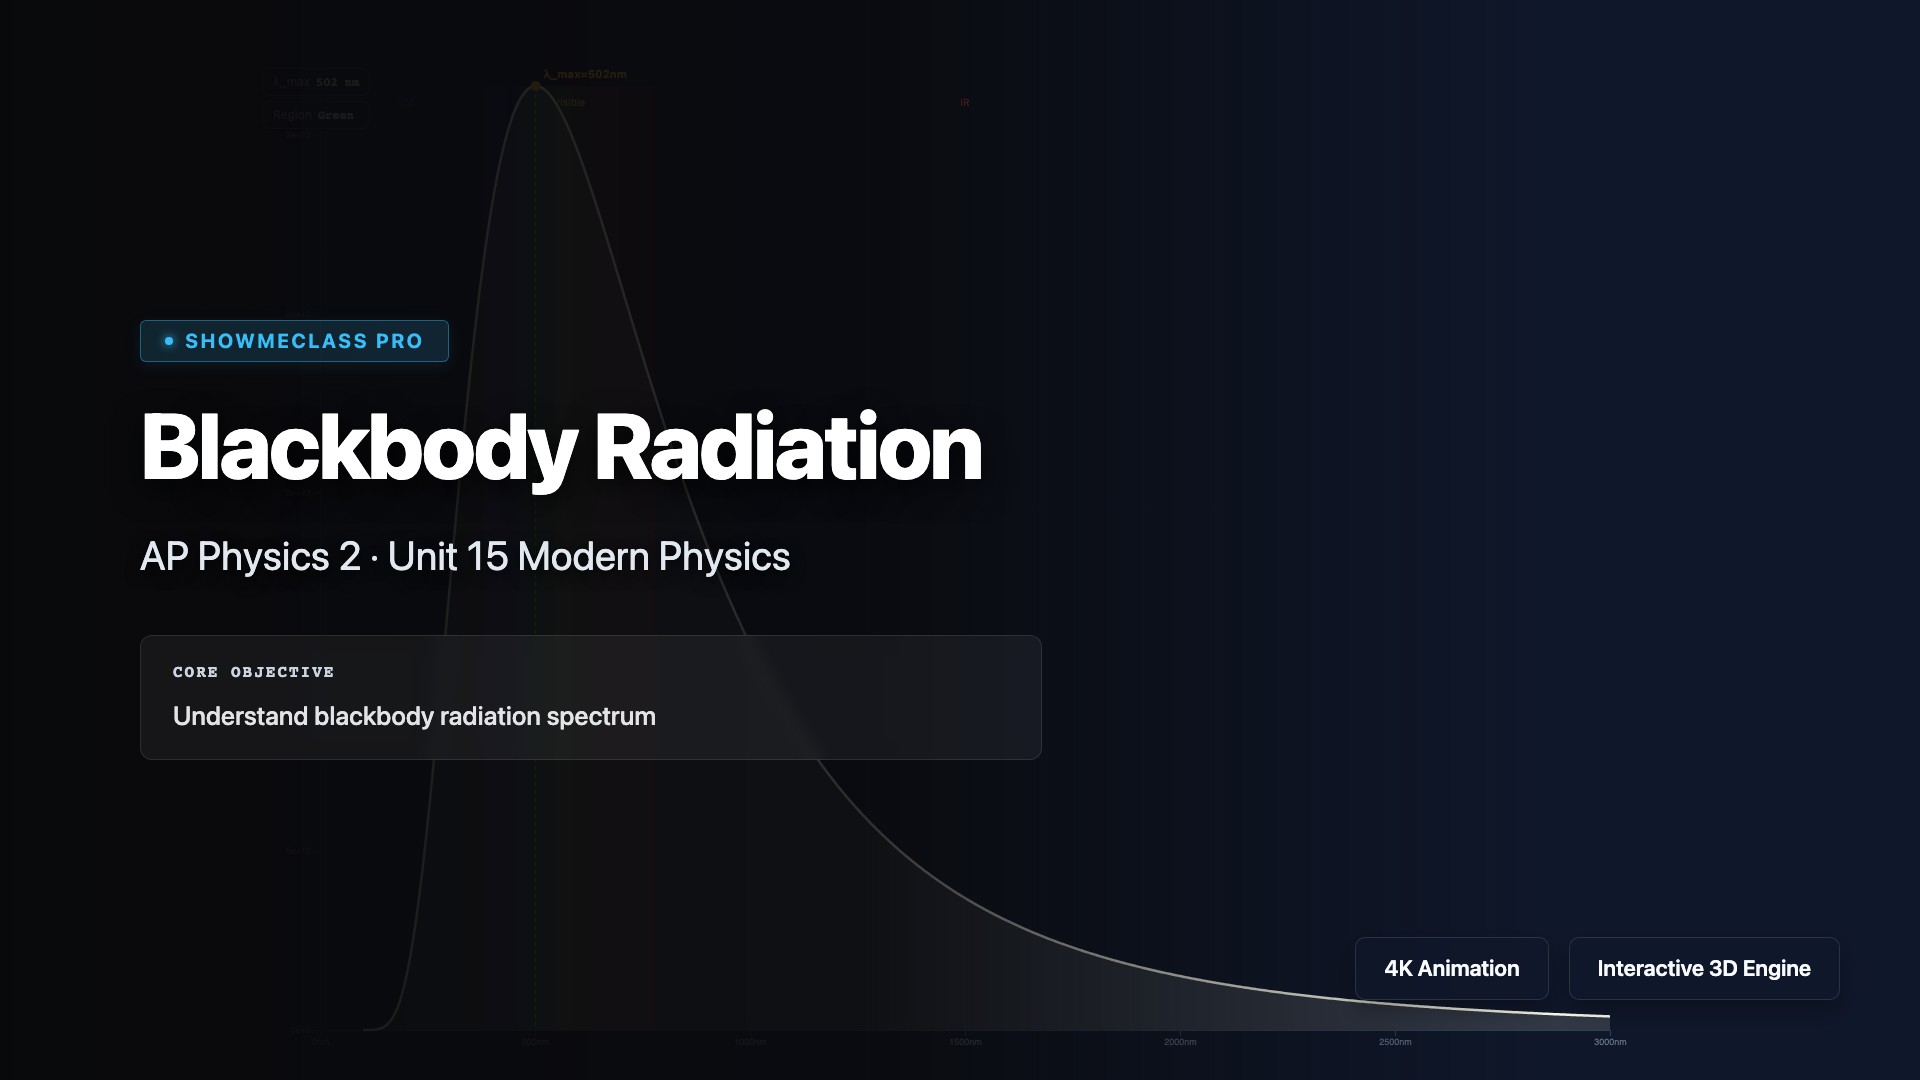
Blackbody Radiation & Wien's Law
Explore the Planck radiation spectrum with adjustable temperature. See Wien's displacement law locate the peak wavelength and compare star temperatures from red dwarf to blue giant.
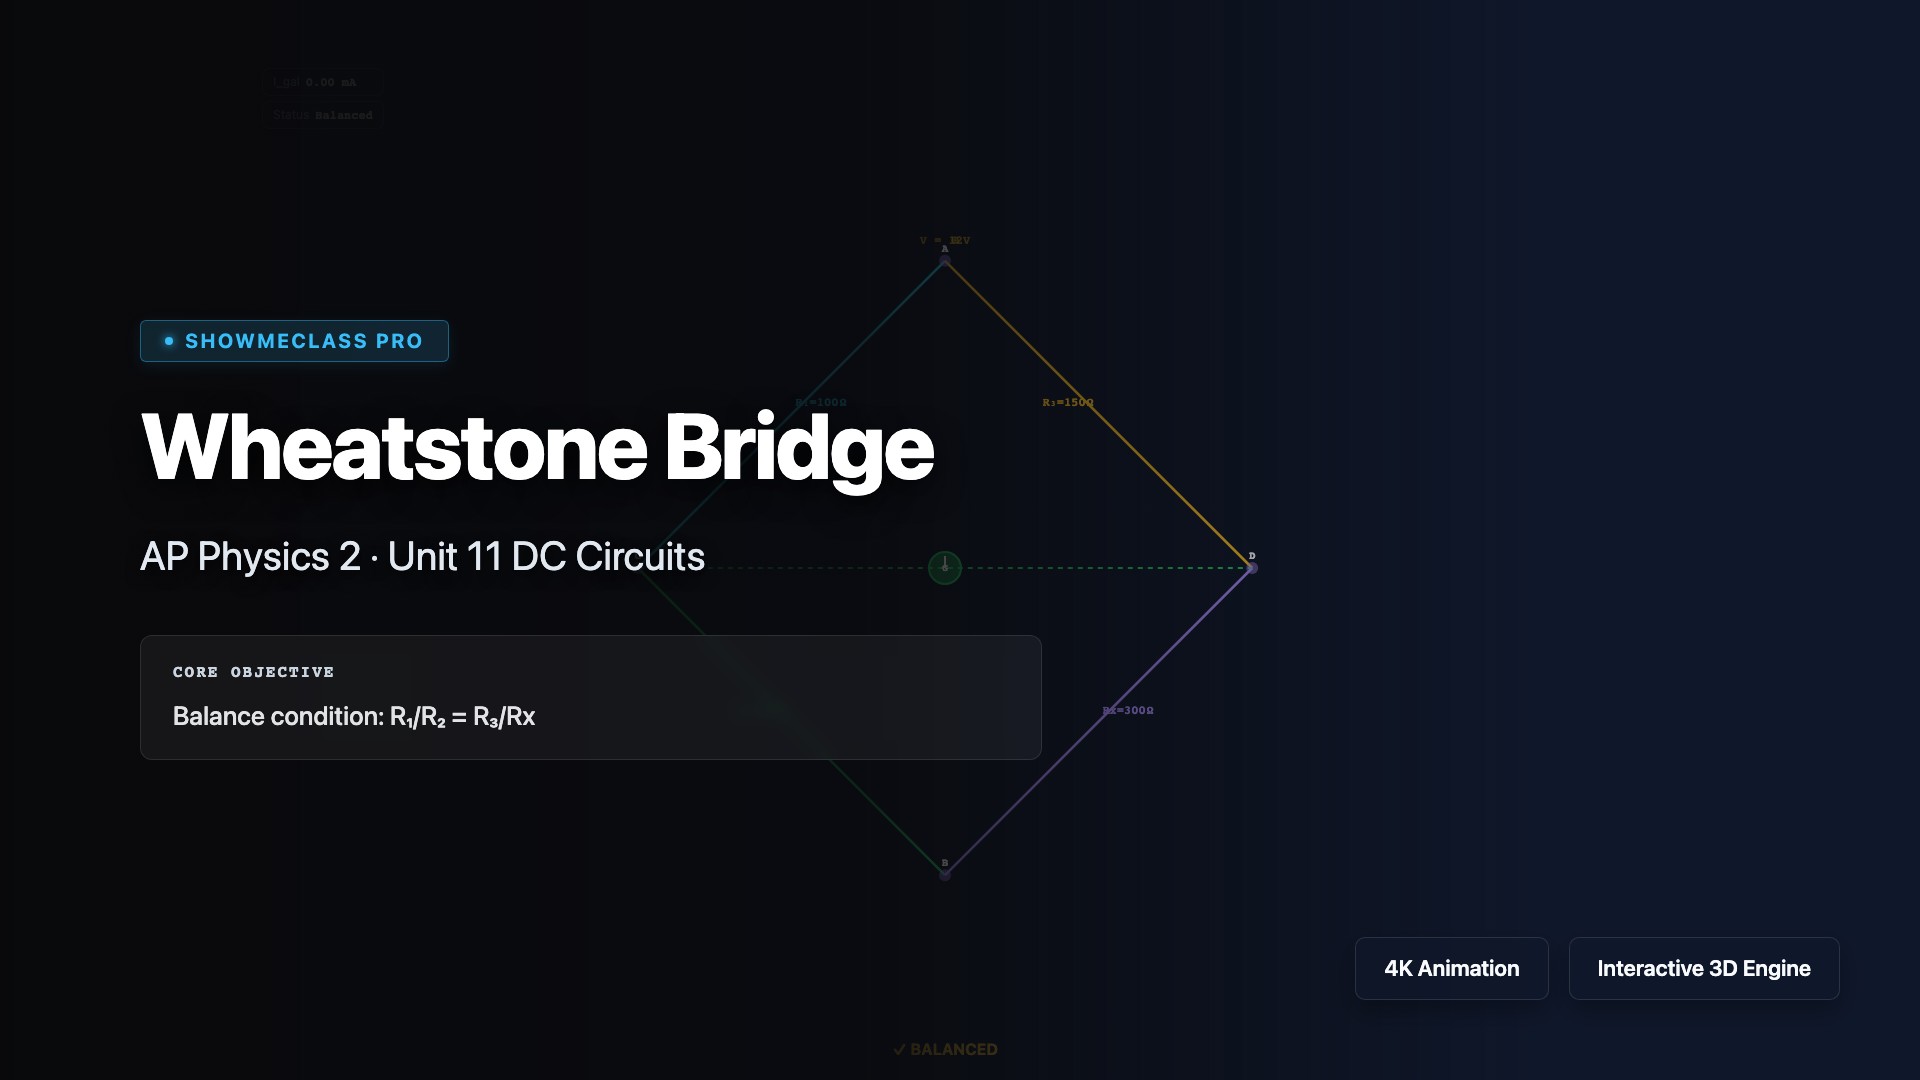
Wheatstone Bridge Balance
Adjust four resistors and voltage source to balance a Wheatstone bridge. Galvanometer needle shows current; R₁/R₂ = R₃/Rx condition for zero deflection.
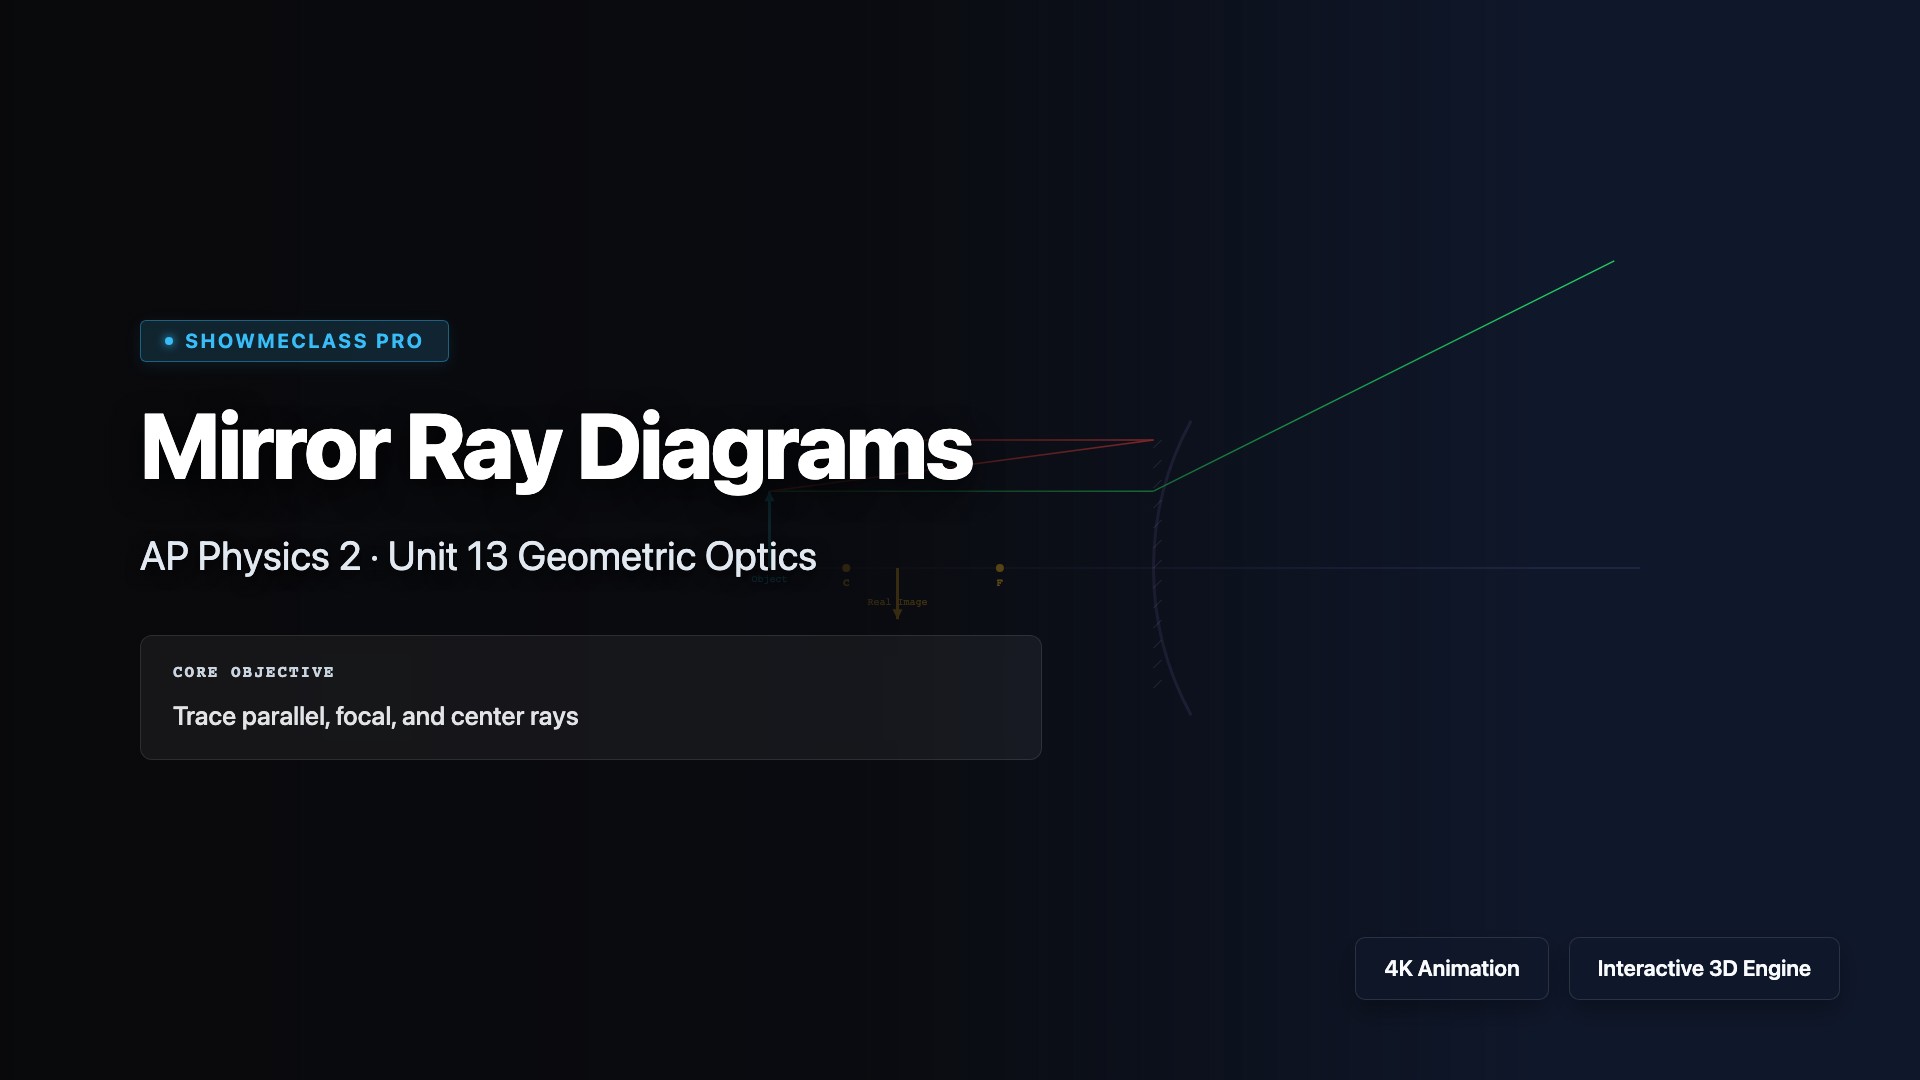
Concave & Convex Mirror Ray Diagrams
Trace parallel and focal rays for concave/convex mirrors. Calculate image distance, height, magnification, and identify real vs virtual images.
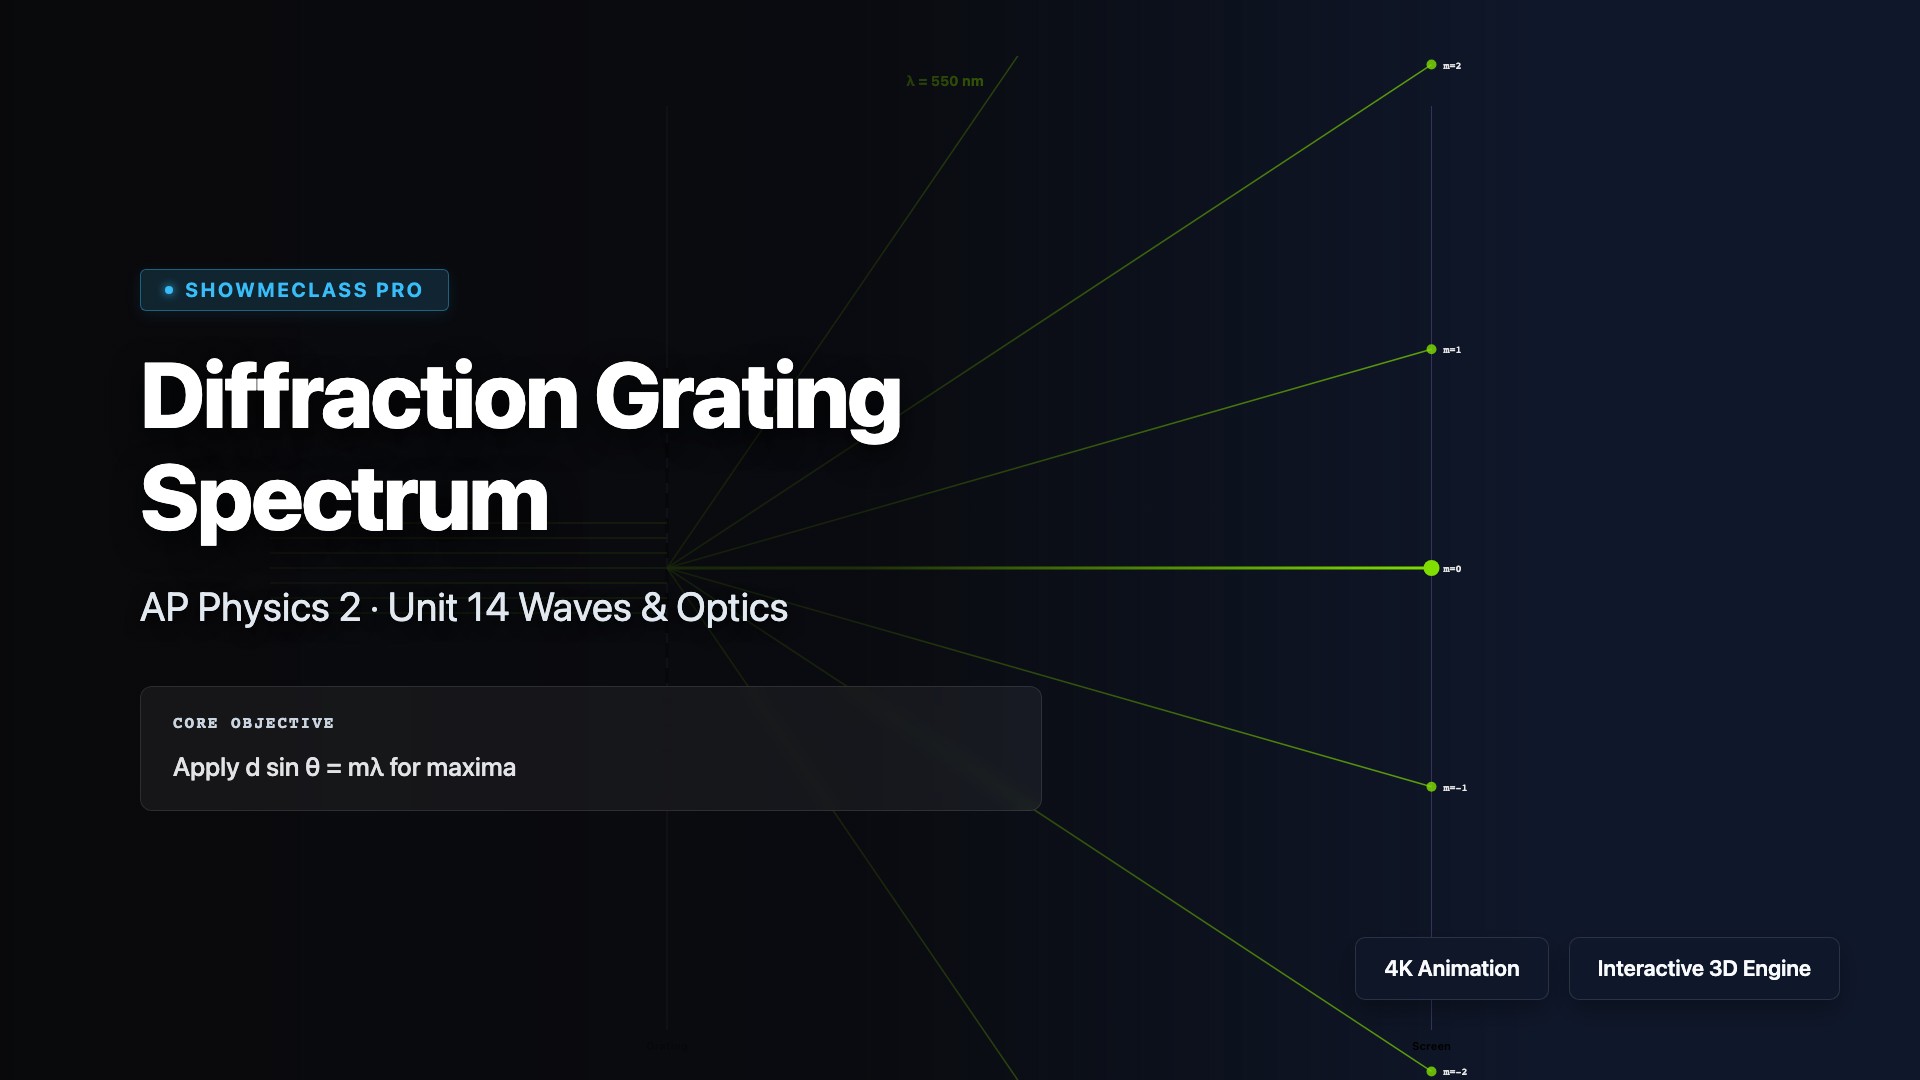
Diffraction Grating Spectrum
Visualize diffraction grating spectra with d sin θ = mλ. Adjust wavelength (color-coded), slit spacing, and max order to see angular positions of maxima.
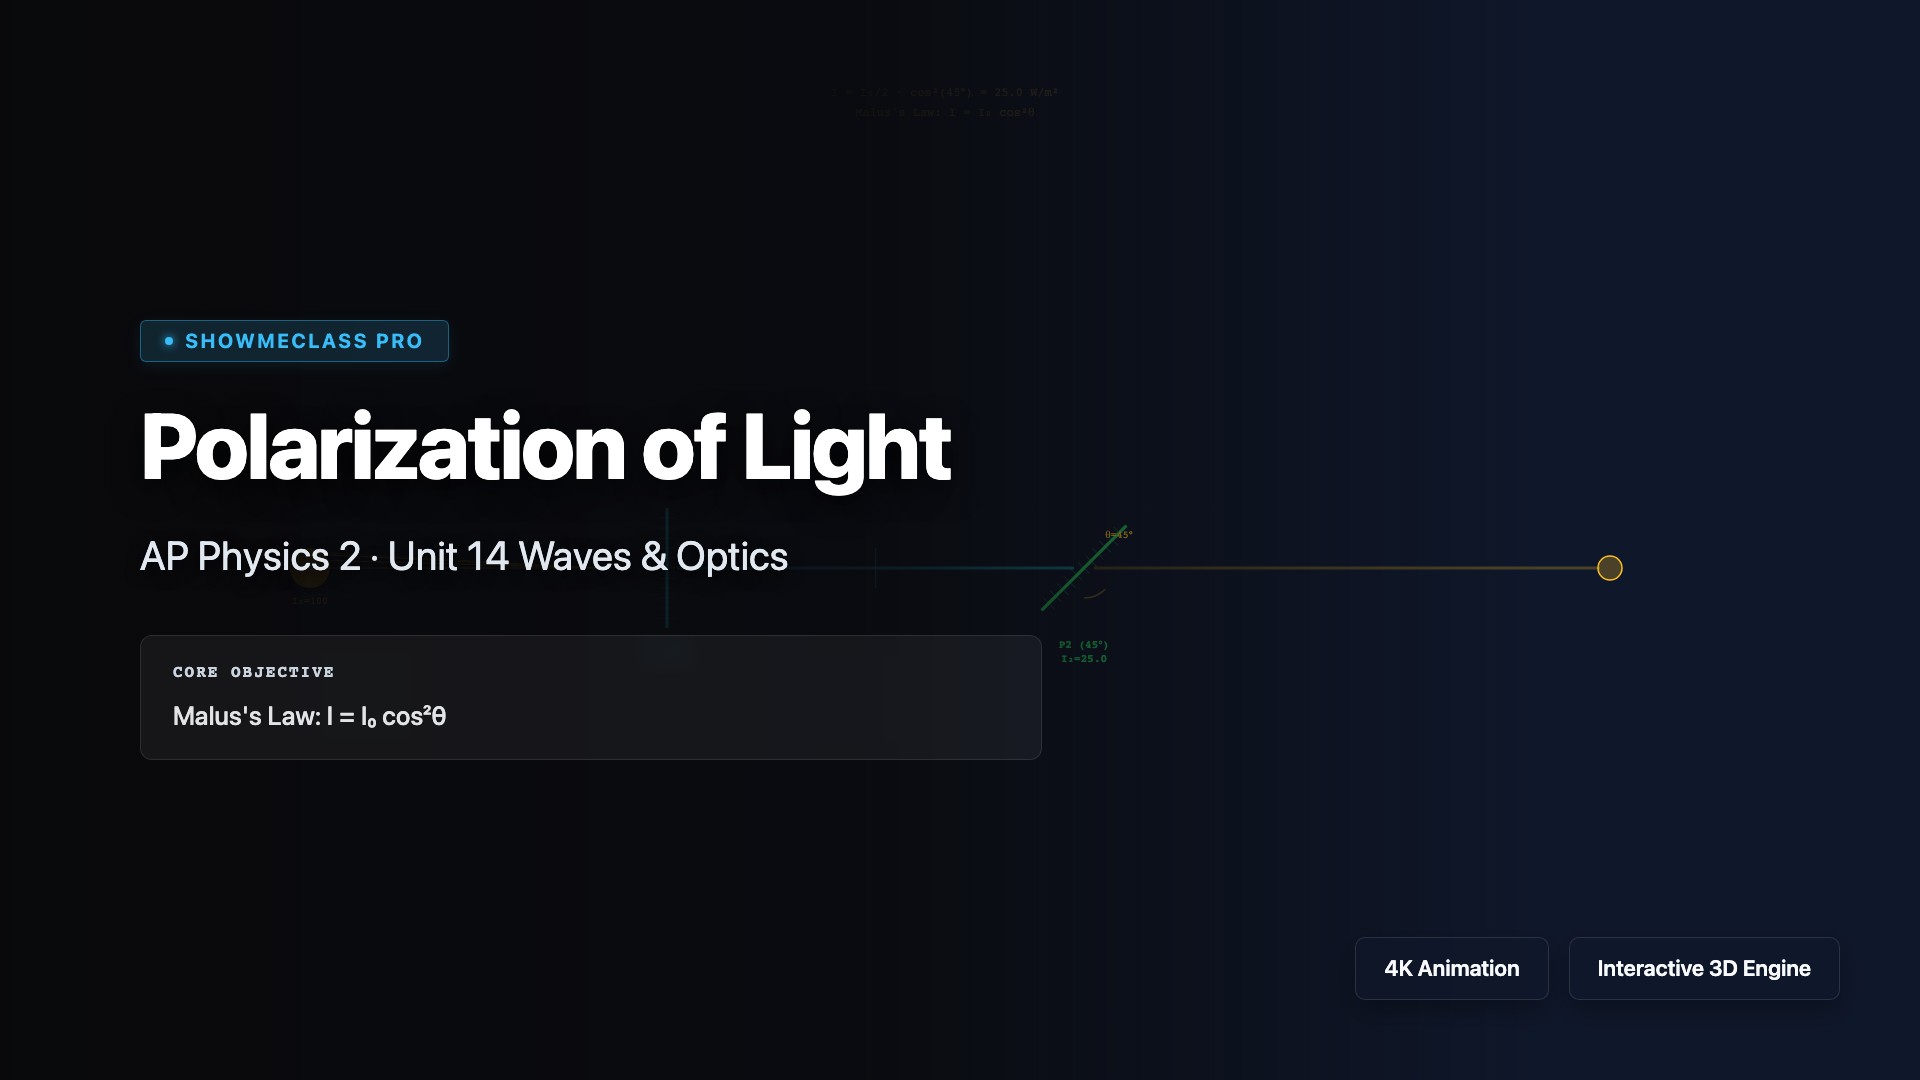
Polarization of Light (Malus's Law)
Malus's Law I = I₀cos²θ with two-polarizer system. Adjust polarizer angles and see transmitted intensity change. Crossed polarizers block all light.
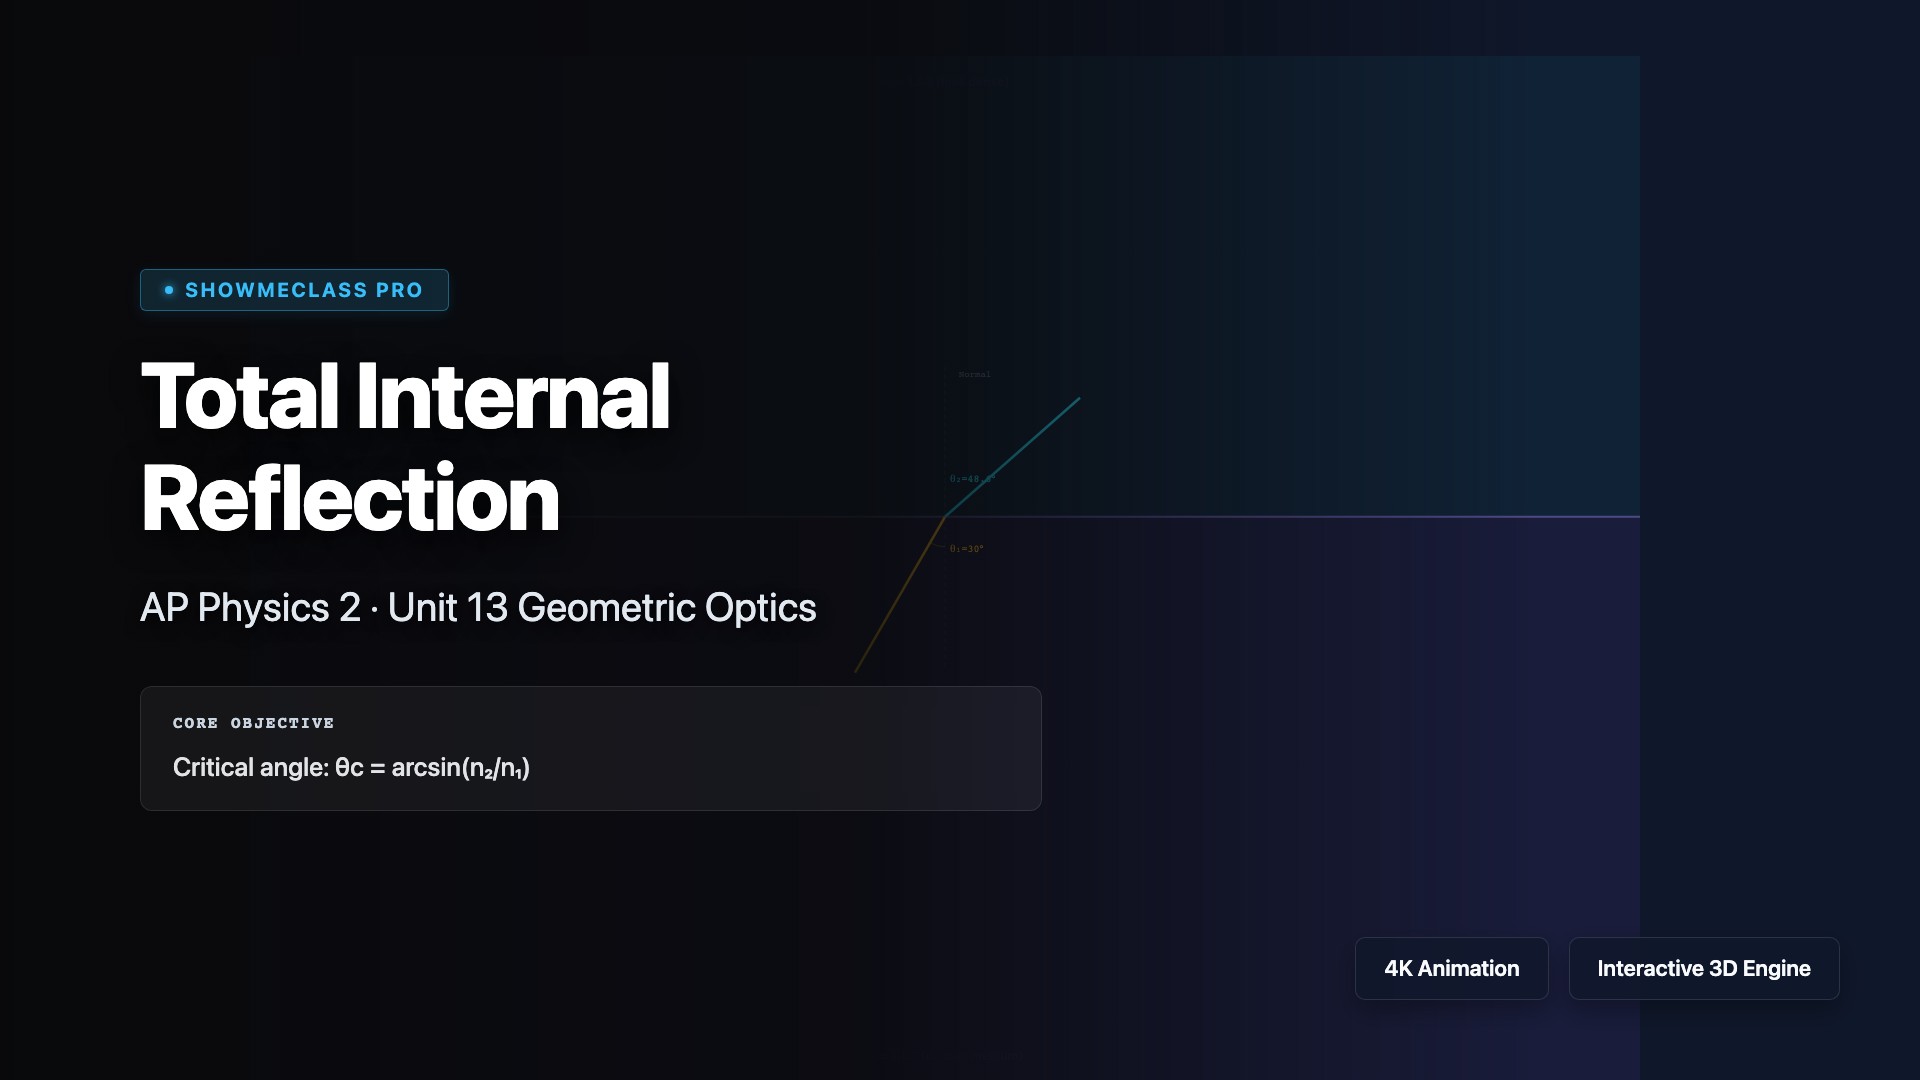
Total Internal Reflection & Fiber Optics
Adjust angle of incidence and refractive indices to observe total internal reflection. Critical angle θc = arcsin(n₂/n₁). Snell's Law visualization.
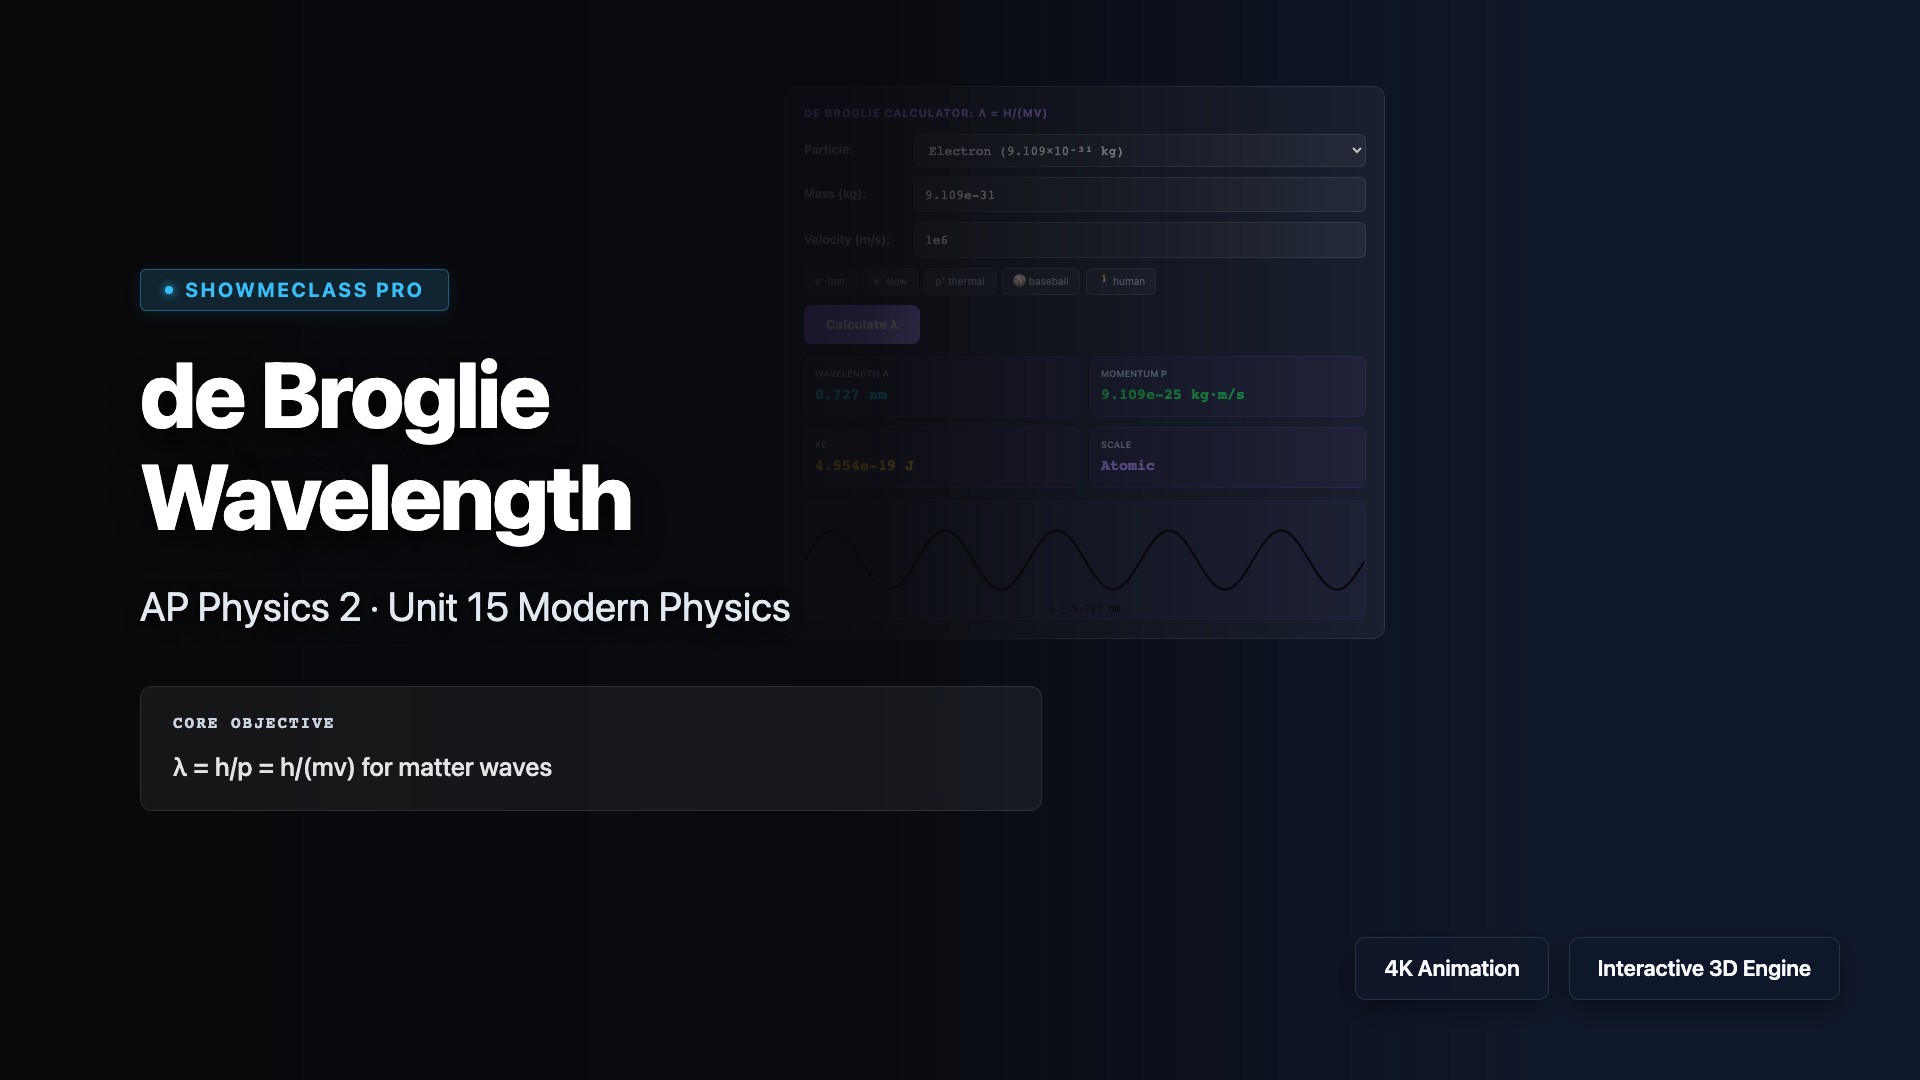
de Broglie Wavelength Calculator
Calculate matter wave wavelength λ = h/(mv). Presets for electron, proton, baseball, and human. Shows scale comparison and wave visualization.
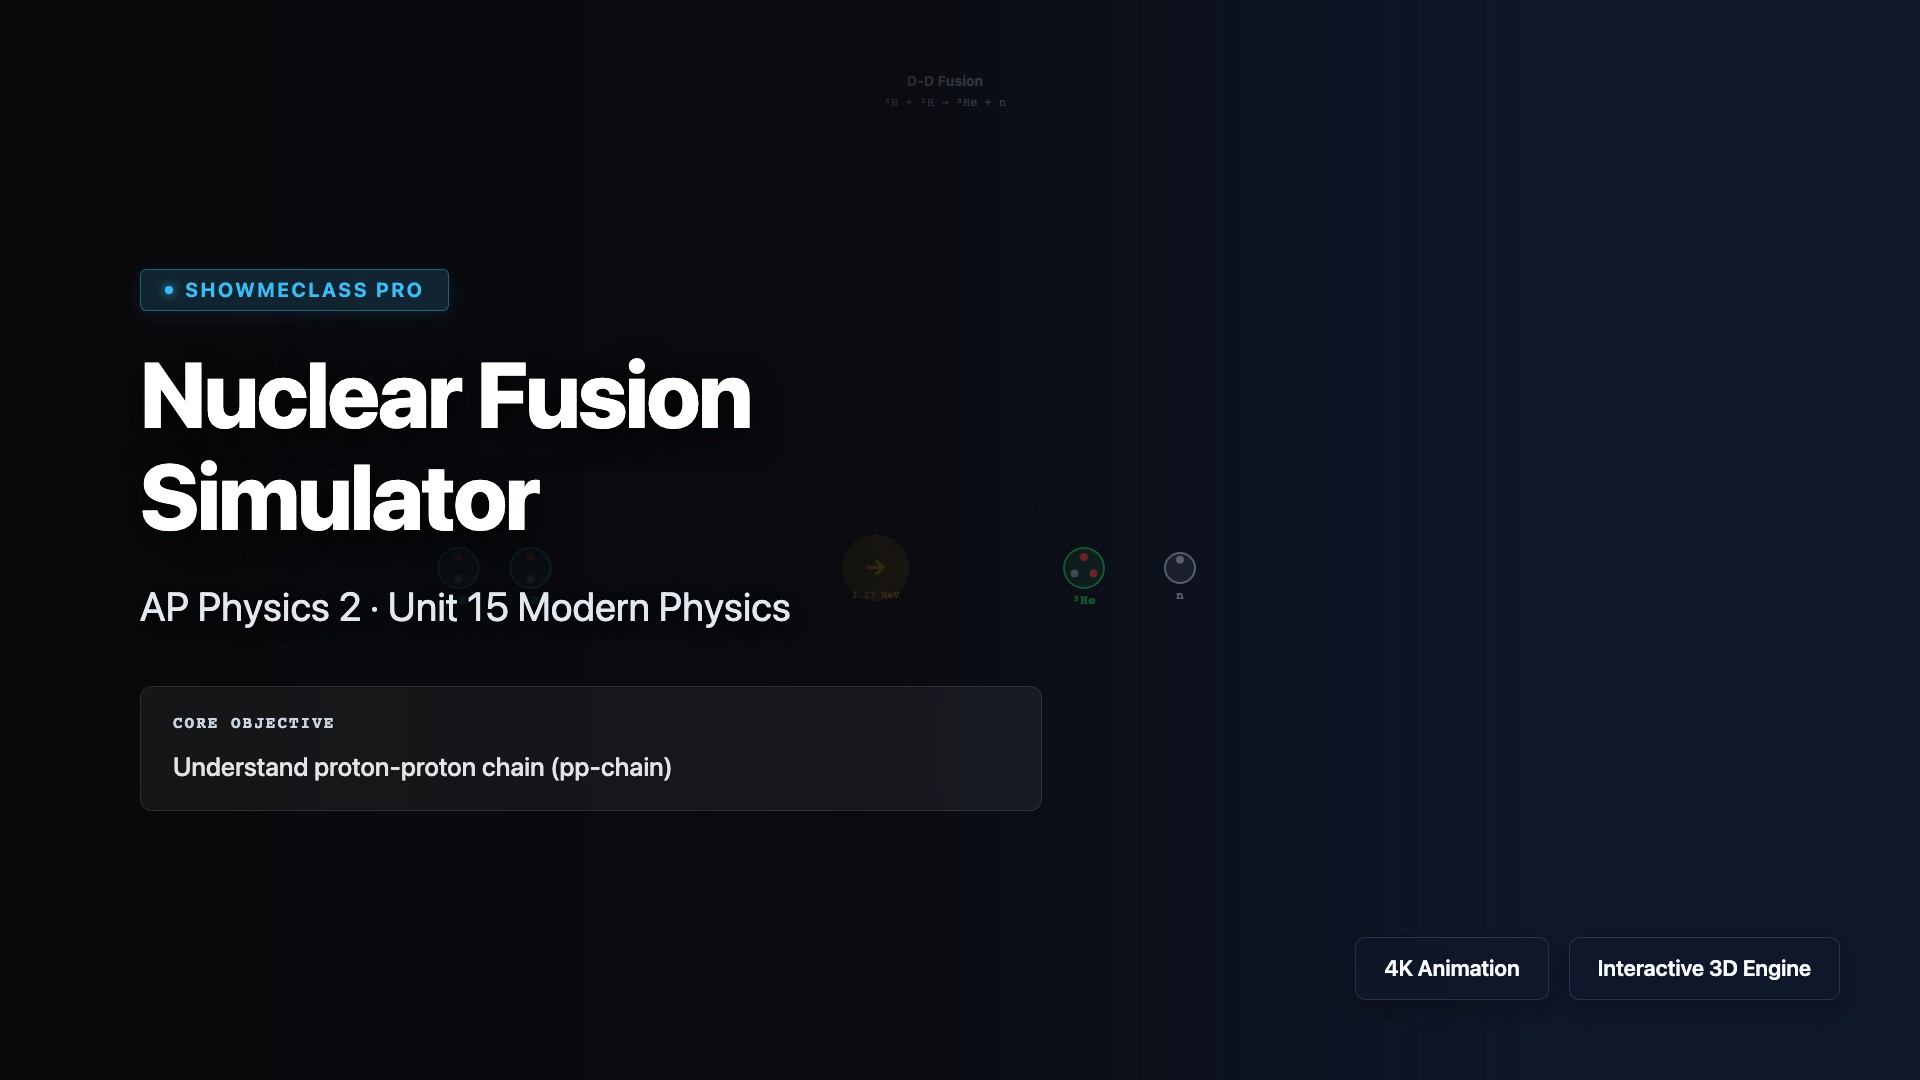
Nuclear Fusion Simulator
Animated D-D, D-T, and pp-chain fusion reactions. Shows nucleons, mass defect, energy release (MeV), and required temperature.
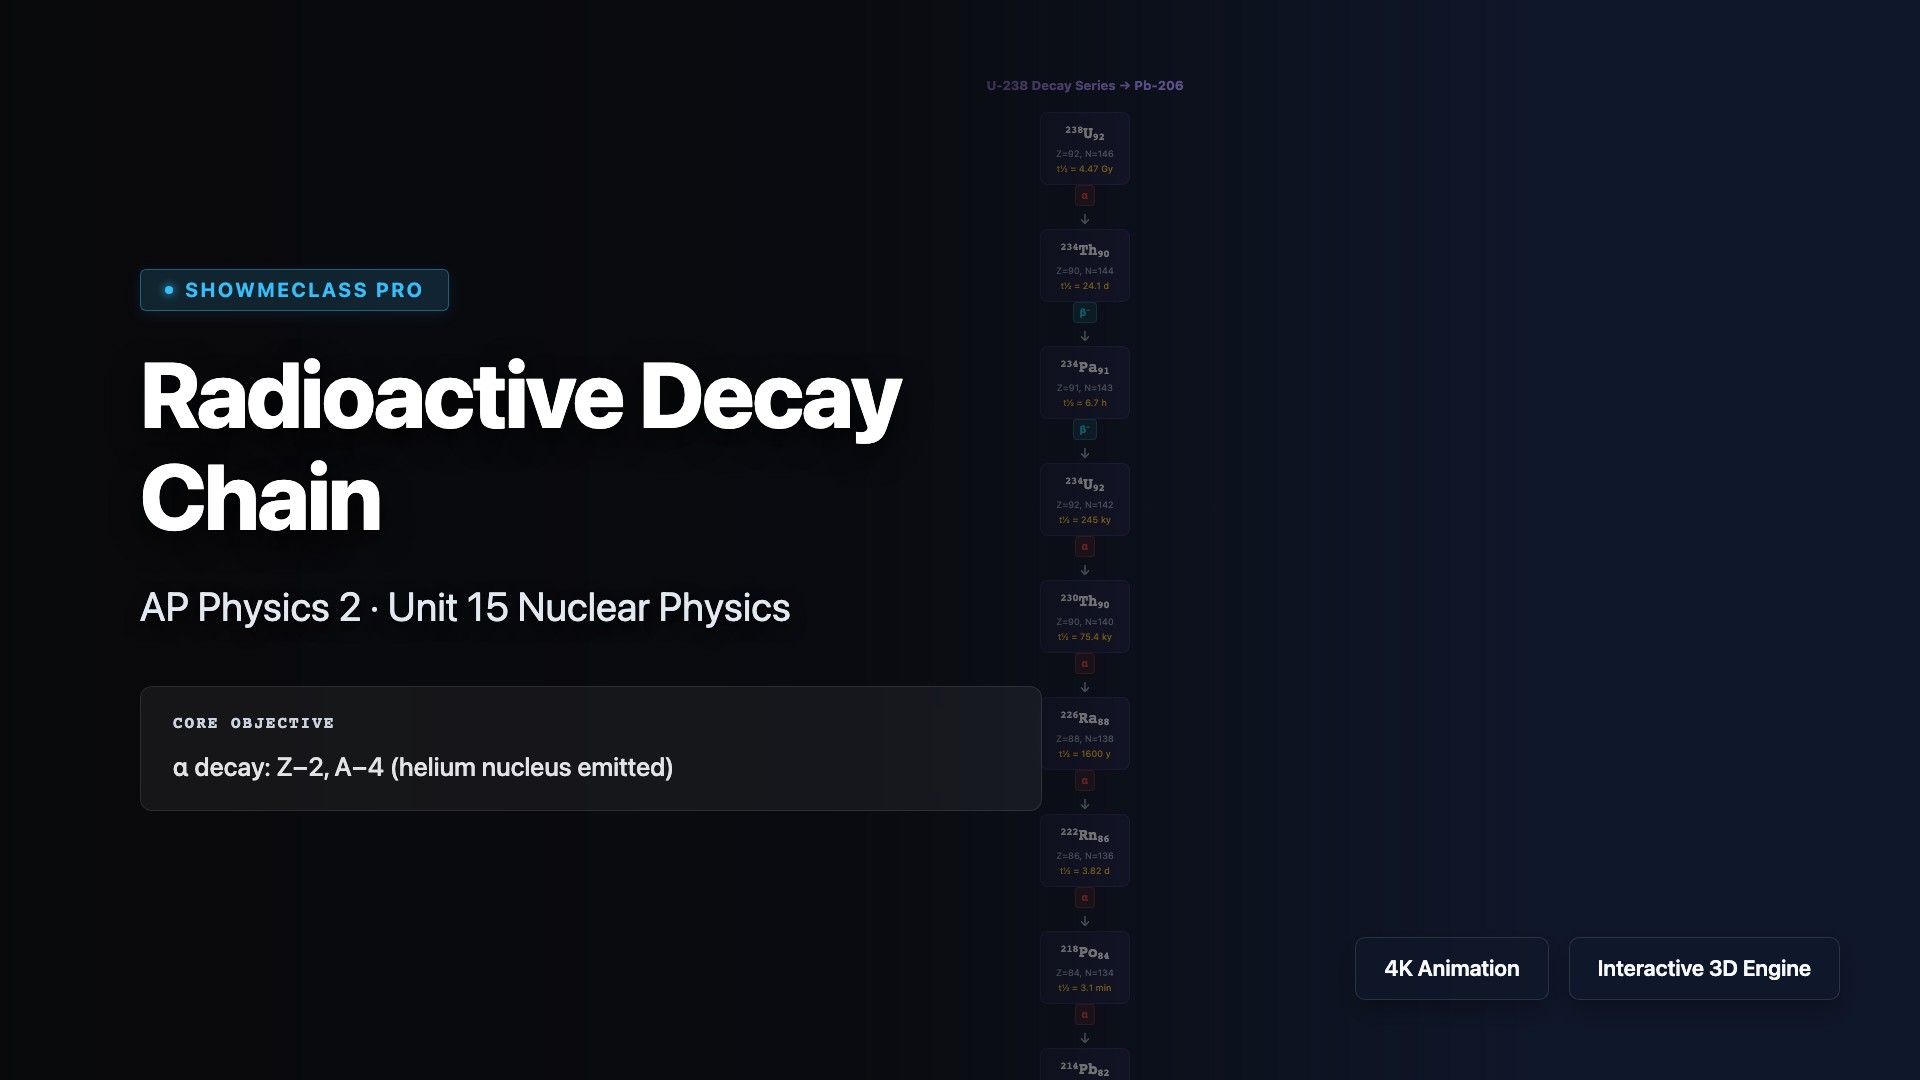
Radioactive Decay Chain (U-238 → Pb-206)
Complete U-238 decay series to stable Pb-206 with 14 steps. Shows α/β⁻ decay type, mass/atomic number changes, and half-lives.
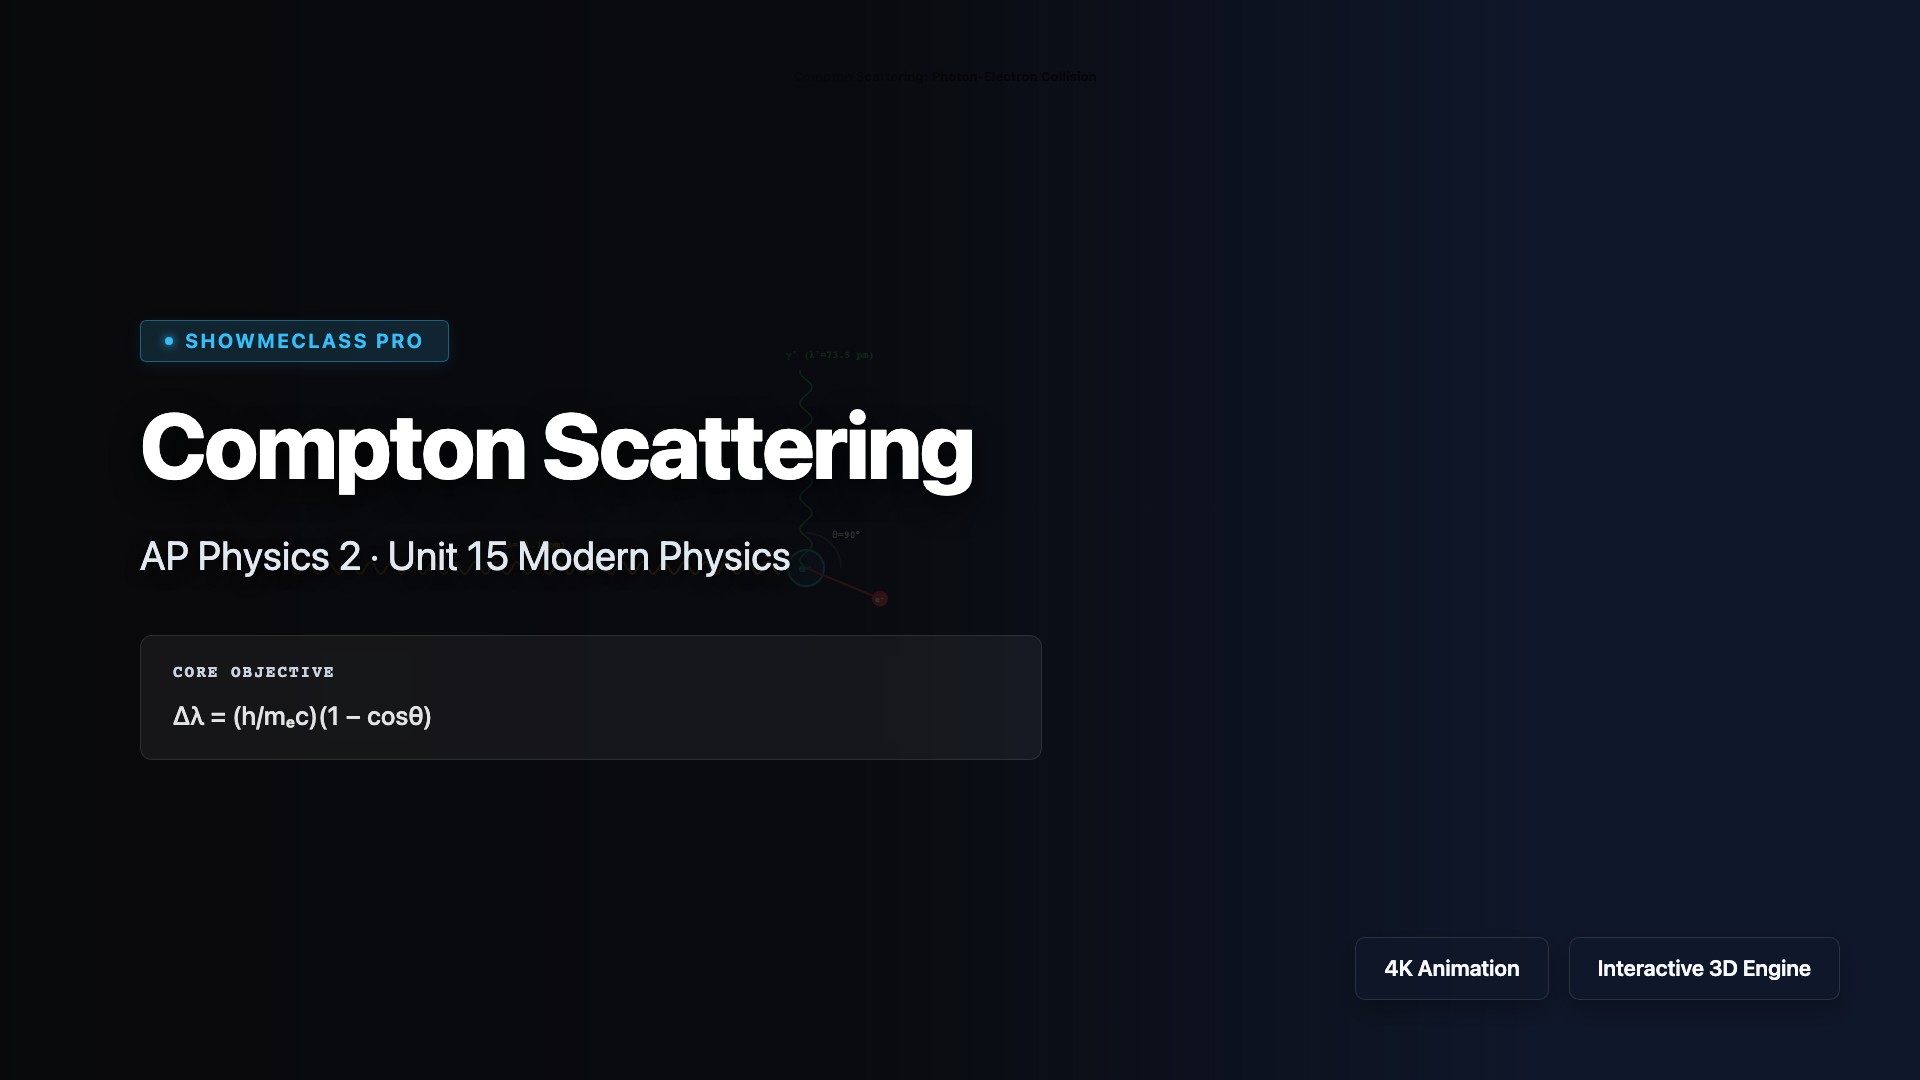
Compton Scattering Visualizer
Photon-electron collision with Δλ = λc(1−cosθ). Adjust angle and wavelength to see scattered photon, recoil electron, and energy transfer.
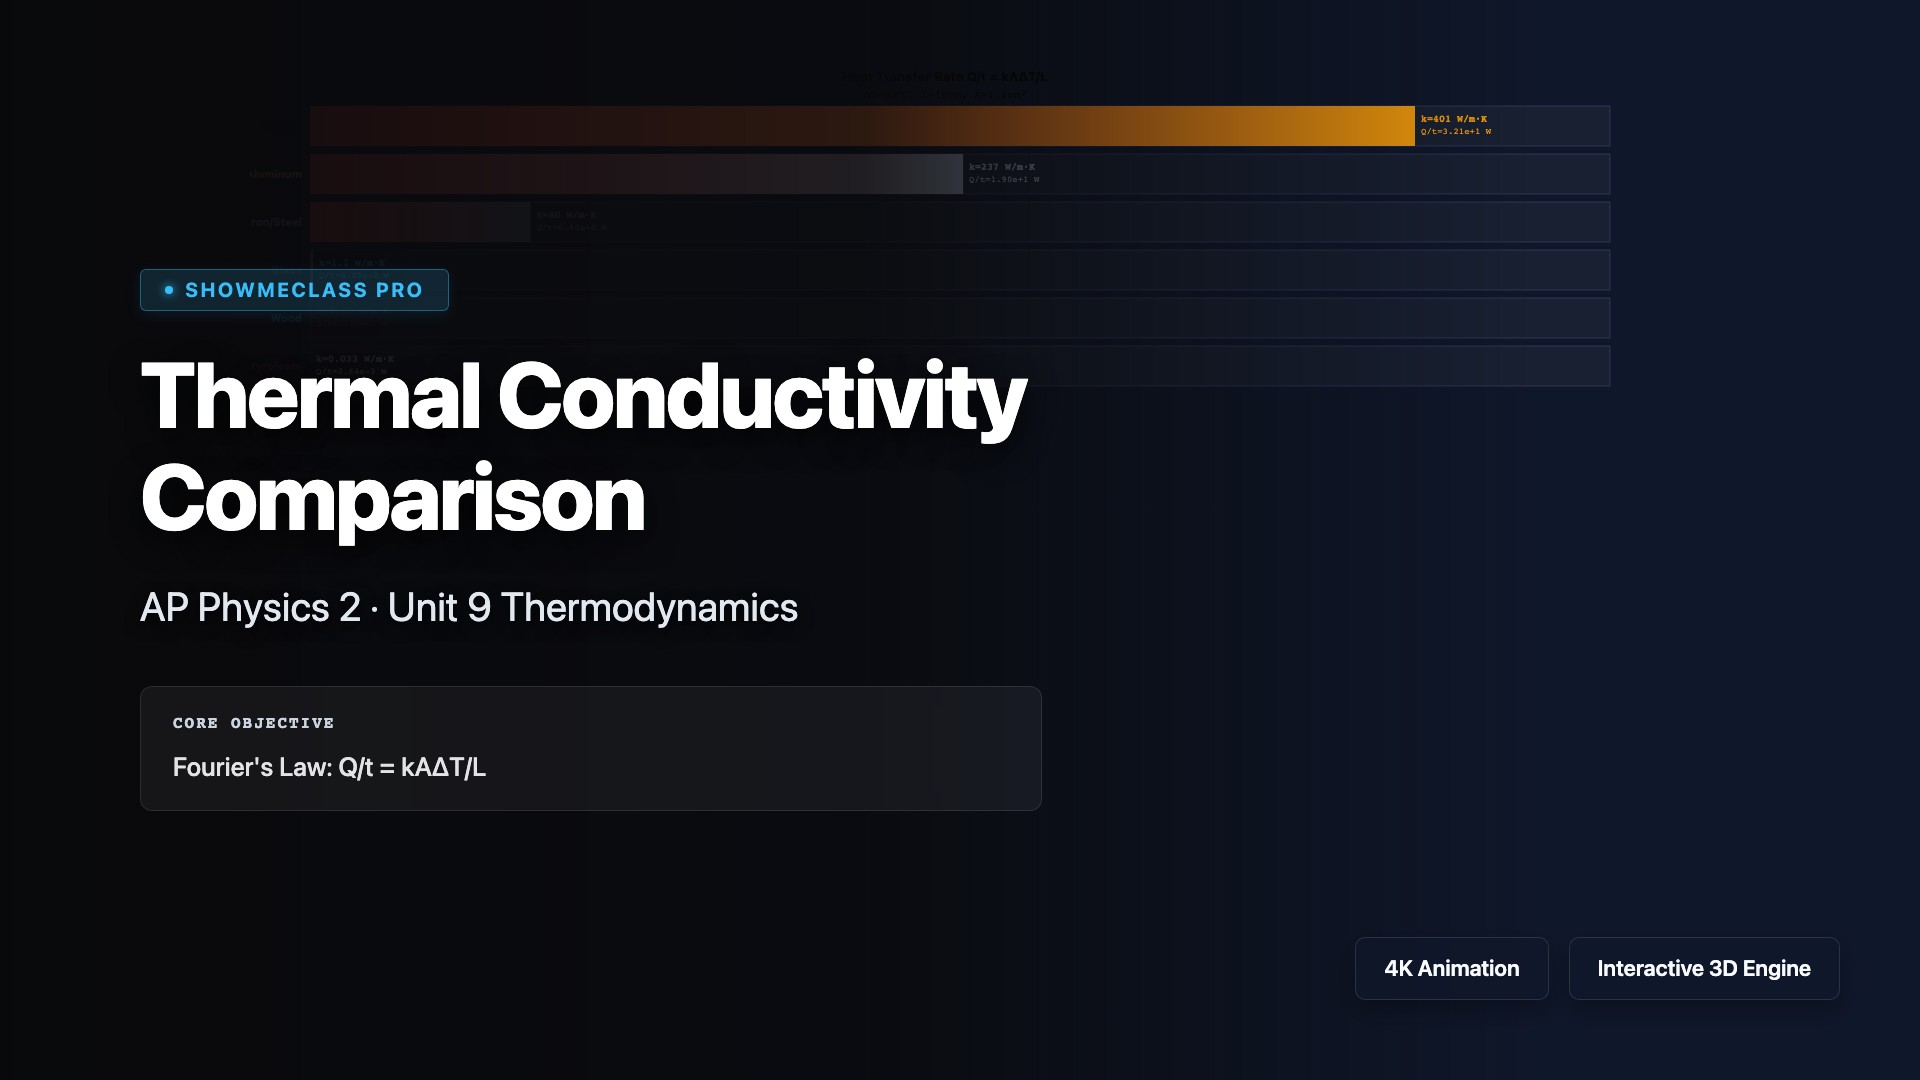
Thermal Conductivity Comparison
Compare heat transfer rates of 6 materials (copper to styrofoam) using Fourier's Law Q/t = kAΔT/L. Adjustable temperature, length, and area.